- Submissions

Full Text
Forensic Science & Addiction Research
Characterization and Differentiation of Ballpoint Pen Ink Strokes on Paper Using Orbitrap Mass Spectrometry and Multivariate Statistic
Bello de Carvalho Carina Mariaa1,2*, Ortiz Rafael Scorsatto1, dos Reis Monique2, Zamboni Amanda2, Limberger Renata Pereira2, Ferrao Marco Antonio3 and Vaz Boniek Gontijo4
1Rio Grande do Sul Technical and Scientifical Division, Brazilian Federal Police, Brazil
2Department of Pharmacy, Federal University of Rio Grande do Sul, Brazil
3Institute of Chemistry, Federal University of Rio Grande do Sul, Brazil
4Institute of Chemistry, Federal University of Goiás, Brazil
*Corresponding author: Carina M Bello de Carvalho, Rio Grande do Sul Technical and Scientifical Division, Brazilian Federal Police, Av. Ipiranga 1365, 8th floor, 90160-030, Porto Alegre, RS, Brazil
Submission: January 10, 2017; Published: February 06, 2018

ISSN: 2578-0042 Volume2 Issue3
Abstract
In criminal expertise routine, the expert is confronted by the challenge of detecting fraud in several important documents. One kind of forgery is the change of a document date of emission by one type of fraud is the adulteration of the date of emission of a document through the erasure and addition of another date with ballpoint pen of color similar to original. The forgery can be detected by characterization of colorant substances of each ink formulation. This could be done by using Orbitrap mass spectrometry. This study performed analysis in ESI-Orbitrap mass spectrometer to obtain the colorants and additives pattern of each brand of blue and black ballpoint pen tested, and after differentiated the pens by multivariate statistic (PCA and HCA). The analysis of ballpoint pen samples in a Q-Exactive® Orbitrap mass analyser was able to differentiate the samples, even for inks of very similar color, and the method proved to be very sensitive. The exact mass spectra were submitted to multivariate statistical analysis and the Principal Component Analysis (PCA) and Hierarchical Cluster Analysis (HCA) was able to characterize the variables that were responsible for the variation and similarity of the samples. The HCA and PCA were able to group pens from the same brand and also to approximate pens of different brands but similar formulations. At the same time, multivariate analysis could identify pens that were very dissimilar from the others.
Keywords: Ballpoint pen ink; Mass spectrometry; Orbitrap; Multivariate statistic; Forensic analysis; Documentoscopy
Introduction
In criminal expertise routine, the expert is confronted by the challenge of detecting fraud in several important documents. One kind of forgery is the change of a document date of emission by one type of fraud is the adulteration of the date of emission of a document through the erasure and addition of another date with ballpoint pen of color similar to original. It is reported that around 80% of questioned documents requiring analysis contain ballpoint pen ink [1]. The forgery can be detected by characterization of colorant substances of each ink formulation.
The dyes used in blue and black ballpoint pens are basic dyes based on triarylmethane and acid dyes derived from diazo compounds or phthalocyanine, and both types are ionic in nature, with the basic and acid dyes generally containing iminium and sulfonate groups, respectively [2]. The dyes and pigments (organic and/or inorganic) make up about 25% of the formulation, while the solvent makes up about 50% by weight. The remainder is a variety of additives like resins, viscosity adjusters, antioxidants, surfactants, softeners, and lubricants [3].
Many methods have been nowadays used to analyze the chemical composition of ballpoint pen ink such as high performance liquid chromatography (HPLC) coupled to Diode Array or Ultraviolet Detection [4-8] or Mass Spectrometry detection [9,10]. Direct insertion methods, without chromatographic separation, are more suitable for forensic samples because the analyst don't need to develop chromatographic methods that involve mobile phase, columns, and other factors of variability. The direct insertion of samples also has less sample preparation, and small quantity of ink is required to achieve good results. New sampling interfaces for mass spectrometers are Electrospray Ionization Mass Spectrometry (ESI-MS) [2,11], Desorption Electrospray Ionization (DESI) [12], Laser Desorption Ionization Mass Spectrometry (LDI-MS) [13-15], Direct Analysis in Real Time Mass Spectromety (DART-MS) [16], Matrix Assisted Laser Desoption Ionization (generally coupled with Time-of-Flight Mass Spectrometry) (MALDI-TOF) [15,17,18] and finally, Easy Ambient Sonic-Spray Ionization (EASI) [19]. Some studies applied surface analysis by Time of Flight- Secondary Ion Mass Spectrometry (ToF-SIMS), to discriminate ballpoint pen inks. The ToF-SIMS can simultaneously collect organic and inorganic information of the samples [3,20]. It is also highly feasible to analyze cationic nitrogen compounds and sulfonated azo dyes by positive and negative ESI/MS (electrospray ionization/Mass Spectrometry) [21,22].
The simple Ion Trap Mass Spectrometer has low resolution, and when mixture or unknown substances have to be identified on ballpoint pen ink, Ion Trap is insufficient for unambiguous identification. However, a new member of high resolution mass spectrometry (HMRS) analyzers, Orbitrap is an electrostatic ion trap that uses the Fourier transform to obtain mass spectra, and operate with good sensivity, high mass resolving power (up to 150000), and mass accuracies in the order of parts per million [23,24].
Until now, just Sun et al. [25] applied Orbitrap to the identification of dyes and blue ballpoint pens inks, although they have used Liquid Chromatography-Diode Array Detection prior to Orbitrap Mass Analyzer and differentiated the ballpoint pens using Discrimination Power Equation provided by Gallidabino et al. [17].
A chromatogram of a spectrum may be visualized as a pattern in multivariate space. Samples displaying similar patterns cluster together and those displaying dissimilar patterns are located away from each other in multivariate space. By knowing this concept, the Principal Component Analysis (PCA) and Hierarchical Cluster Analysis (HCA) of each ink mass spectrum can be used to differentiate the ballpoint pens. Kher et al. [2] used multivariate analysis to discriminate ballpoint pen inks HPLC chromatograms, and Denman et al. [3] did Principal Component Analysis of ToF- SIMS spectra of 07 different brands of blue ballpoint pens, but none study tried to perform multivariate analysis using Orbitrap mass sprectra data for classification of blue and black pens.
Many studies subjecting ballpoint pens characterization has been conducted with ballpoint pens from european manufacturers, however the pens in Brazilian market have different manufacturers and because of this, different formulations.
In a previous study [26], we concluded that strokes in paper, made with different brands/models of ballpoint pens have different initial concentration of 2-phenoxyethanol, a solvent generally determined to evaluate the age of manuscript strokes in forensic documents. Based on this finding, it is important to characterize the pen ink formulation; in a way that the forensic expert can know that he is comparing strokes made with the same pen, to avoid strong conclusions.
This study aim to perform analysis in ESI-Orbitrap mass spectrometer to obtain the colorants and additives pattern of each brand of ballpoint pen tested, in way to differentiate the pens by multivariate statistic (PCA and HCA).
Materials and Methods
Thirty-three different brands/models of blue ballpoint pens and twenty-six different brands/models of black ballpoint pens (Bic, Stabilo, Injex, Faber Castell, Pilot, Cis, Uni, BRW, Staedler, Molin, Jocar, Tilibra, Pentel, Ita, Tris, Compactor, Masterprint, Paper Mate, NewPen) were applied as strokes, with a ruler, on white office paper (75g/m2). The strokes were cut in one centimeter fractions, and extracted with 200|iL of methanol. The extracts were then analyzed on positive and negative mode, by direct infusion in an ESI-Q-Exactive® Orbitrap mass analyser (Thermo Scientifics®), located at Mass Spectrometry and Chromatography Laboratory of Federal University of Goias. The equipment conditions were Spray Voltage of 3,6kV, Capillary temperature of 275 °C, Sheat Gas flow rate of 10, and S-lens level of 50. In both positive and negative mode, it was scanned from 100 to 1500amu.
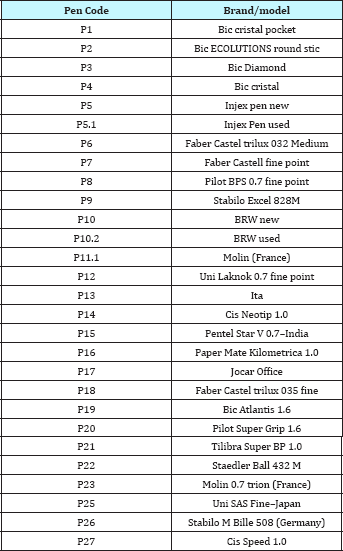
The exact mass substances detected were identified as dyes and other components of pen inks using exact masses reported in the literature. The brands of pens analyzed were chosen because they are the most sailed in Brazilian markets (Tables 1 & 2).
Table 1: Blue pens analyzed.
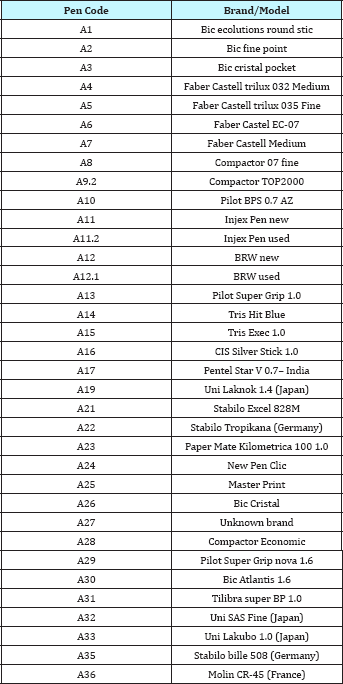
Table 2: Black pens analysed.
After the Orbitrap analysis, the relative intensities of the peaks of main components presented in the spectra obtained for each sample were selected for the Multivariate Statistic Analysis- Hierarchical Cluster Analysis (HCA) and Principal Component Analysis (PCA). The data were then processed with Chemostat software [27], where the integrated peak values were submitted to PCA analysis without any mathematical treatment.
Results and Discussion
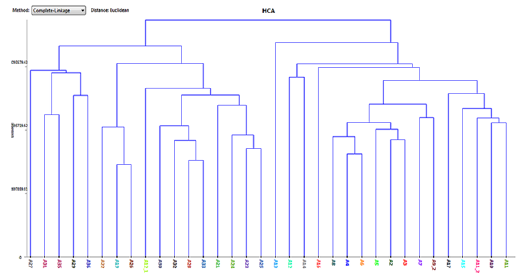
In relation to BLUE PENS, the first experiment included all samples of pens, but the PCA score plot showed that sample A1(Bic Ecolutions) located in the positive side of PC1, was totally divergent of the other samples (located in the negative side of PC1). Because of this, the experiment was redone without A1, and so the HCA was able to differentiate with a relative well Euclidian Distance, all of the samples analyzed. Along with this, the HCA presented six great hierarchical clusters and two isolated samples (A27-a pen similar to Faber Castell and A13-Pilot Super Grip) (Figure 1). The HCA showed that the majority of the clusters were formed by pens from same brand and/or similar pictorial aspect of the ink (i.e. color, texture), so the method was able to differentiate the individuals but at the same time to group similar pens. In the blue pens group, the pens A11 (Injex Pen) and A12 (BRW) are new pens, never used, and the pens A11-2 and A12-1 are pens that have been used already. The HCA plot showed A11 and A11-2 near to each other, confirming that there are not too much changes in the composition despite the use. But the same didn't occur to the samples A12 and A12-1, which were located far to each other, on the HCA plot.
Figure 1: HCA results for blue pens.
For the blue pens PCA, the PC1 versus PC2 plot accounted for 24,15% data variance, and with the others PCs until PC7 accumulated 53,75% of the variability (Figure 1). PC1 divided the samples in two great clusters, where the loadings responsible for the samples located onto PC1 positive side were mainly the more common dyes in pen inks (cristal violet, metil violet, basic violet family, basic blue 2 and Victoria blue family, and guanidine family) (Table 3). The samples located in PC1 negative side showed more influence of additives (surfactants, antioxidants, preservatives) and less common dyes (murexide m/z 265,1480; Victoria blue family dye m/z 429,2398). From PC2 positive side, the samples A27, A31, A35 and A36 (unidentified brand, Tilibra, Stabilo Bille, Molin) showed more difference to the others; and the loadings (m/z) responsible for the variability were cited on the Table 3.
Table 3: Blue pen PC1 and PC2 positive [1].

About the cited new and used pens A12 and A12-1, the PC2 loadings that are counting for the difference between these samples. The PC3 versus PC4 plot showed a well distribution of the samples, except for the A14 (Tris Hit), that differentiate from the others (more positive score at PC4) and A22 (more negative score at PC3). The loadings influencing this dissimilarity of the A14 and A22 samples from the others were mainly murexide (m/z 265,1480) and a piperazine dye (m/z 397,2265 [M-H]-). The PC4xPC5 plot differentiate the sample A13 (Pilot Super Grip), because of the influence of basic blue 7 on negative scores of PC5. The PC5xPC6 plot show the majority of the samples near the center and the samples A16 and A22 apart from the others having high positive scores on PC6; the samples A12, A12-1 and A21 have high positive scores on PC5, being different from the others. The main loadings influencing samples on PC6 positive score are crystal violet; methyl violet; Victoria blue and Basic blue 9, besides unknown substances with exact mass m/z 325,1844; m/z 246,2425 and m/z 219,2450. The samples A27 and A31 were located apart from the others on the PC6xPC7 plot, A27 presenting the more positive score and A31 the more negative score for PC7.
Figure 2: HCA results for black pens.
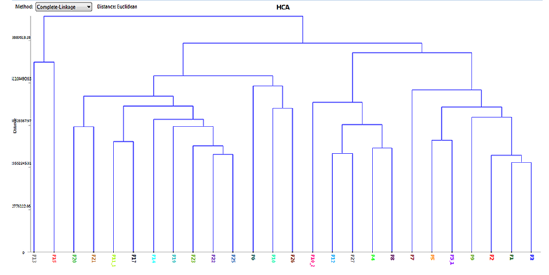
In relation to BLACK PENS, the first analysis including all the blue pens. Because of this, the multivariate statistic was remade samples showed two samples with great differences from the without that samples, and so the HCA was able to differentiate with others: Paper Mate and Faber Castell trilux 035, in the same way of a relative well Euclidian Distance, all of the samples analyzed. The HCA presented five hierarchical clusters and also four samples differed most from the others P13 and P15, P6 and P7 (ITA, Pentel, Faber 032 and Faber Fine Point). In the black pens group, in the same way of the blue pens, the pens A5 (Injex Pen) and A10 (BRW) are new pens, never used, and the pens A5-1 and A10-2 are pens that have been used already. Just like the blue pens, the HCA plot showed A5 and A5-1 near to each other, confirming that there are not too many changes in the composition despite the use, and A10 and A10-2 located far to each other, showing that this brand, no matter the color, changes its ink composition with the use. This finding was also reported in previous studies, were authors observed that some pens presented degradation of dyes [28] and sometimes the ink is inhomogeneous inside of pen cartridge [29].
In the PC1 versus PC2 plot accounted for 31,29% data variance, and with the others PCs until PC7 accumulated 63,39% of the variability (Figure 2), showing that the black pens have less variables responsible for the differentiation of the samples than the blue pens. Again, the HCA showed that the majority of the clusters were formed by pens from same brand and/or similar pictorial aspect of the ink (i.e. color, texture), so the method was able to differentiate the individuals but at the same time to group similar pens. Many samples projected onto PC1 had negative scores, characterized by the loading of the substance murexide, and the dyes basic blue 9 and acid orange family, besides ink additives.
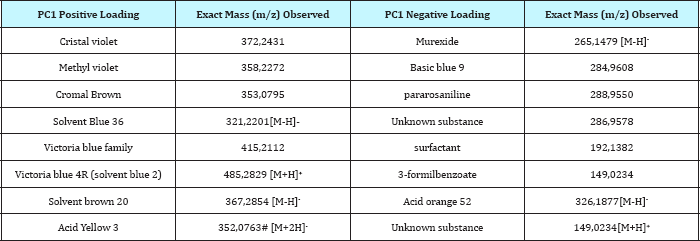
It is significant that almost all Bic brand pens had positive scores on PC1, where the loadings were mainly the more common dyes in pen inks (Table 4). When the samples were projected on PC2xPC3 plot, almost all samples grouped near the center, except for P13 (ITA), that had the more negative PC3 score, mainly because of the presence of a great concentration of basic blue 9 dye. For the samples projected onto PC4xPC5, the sample P15 (Pentel) had the more negative score on PC5 and the main loading were the m/z 126,9040 and the cromal brown dye (m/z 353,0795), besides the basic violet 14 (m/z 301,2384) (Figure 3 & 4).
Table 4: Black pen PC1 positive and negative loadings.
#Soltzberg et al. [18].
Figure 3: PCA scores for blue pens.
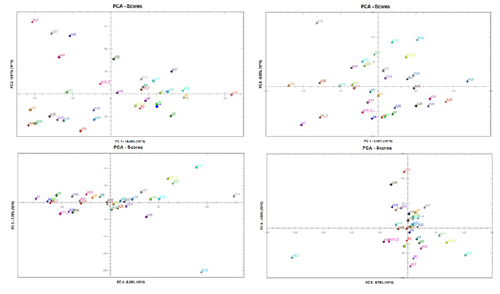
Figure 4: Black ball point pens PCA scores.
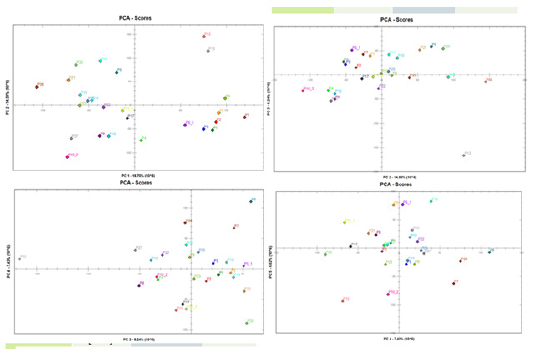
On the PC4XPC5 graph also can be seen that P6 and P7 (Faber Castell) and P26 (Stabilo M Bille 508) are related, having the most positive score on PC4, with the main loadings acid yellow 3 (m/z 352,0763); Victoria blue 4R (m/z485,2827); basic violet 4 (m/z 301,2384); basic blue 9 (m/z 284,9608) and murexide.
In relation to the blue sample A1 (Bic ecolutions), that was very divergent from the others, the main loading for the PC1 positive scores was the dye 1,3-dimethyl-1,3-ditolylguanidine (exact mass 268,1805 [M+H]+. For the black samples P16 (Paper Mate) and P18 (Faber Castell 035), that were excluded, they presented too high concentration of cristal violet, metil violet, cromal brown and Victoria blue 4R.
In the blue pens PC1xPC2 plot graph, it was observed that onto PC1 positive and PC2 negative foursquare, the samples of "Bic" and "Faber Castell" ballpoint pens were related, indicating that they have similar composition.
About the black pens P13(Ita) and P15 (Pentel) located on PC1 and PC2 positive four-square, the loadings on PC2 responsible for the similarity were mainly murexide (exact mass 265,1479 [M-H]-), acid yellow 1 (312,1720 [M-H]- ), BHT (199,8043 [M-H]- ), and acid orange (326,1877 [M-H]- ).
Sun et al. [25] analyzed dyes and blue ballpoint pen inks, using Liquid Chromatography-Diode Array Detection and Orbitrap Mass Spectrometer. The results of these authors didn't find acid dyes in ballpoint pens, but instead of these, the samples analyzed in the present study presented acid dyes in blue and specially in black ballpoint pens. One of the acid dyes that influenced in PC2 negative score for blue pens were the acid yellow 1 (exact mass 312,1720 [M-H]- ).
Gallidabino et al. [17] found in many ballpoint pen analysed, the pigment copper phtalocyanine (CuPc), with exact mass m/z 575.1), in both ionization modes (negative and positive) with intense signals, and a variety of signals related to this pigment over m/z 580 (m/z 655.0; 735.0; 815.0 and 894.9). The method of ionization was MALDI, and the detector was TOF. In the present work, the ionization method of ESI associated with Orbitrap, did not find any similar peak, associated with pigment copper phtalocyanine. Maybe associating Orbitrap with another ionization interface like MALDI could increase the sensitivity of this analytical method.
Besides ballpoint pen ink, Sun et al. [25] analyzed nine dye standards in the LC-DAD-Orbitrap MS system (acid blue 1; acid blue 9; acid red 52, crystal violet, methyl violet 2B, ethyl violet, basic blue 7, Victoria blue B and Victoria blue R) to do the quantification, by LC-DAD, of the same dyes on ballpoint pens samples, and to confirm the Orbitrap exact mass obtained for these samples. The exact mass of dyes obtained by Orbitrap direct insertion of the samples of the present study were compatible with the exact mass obtained by Sun et al. [25] for the same substances. This finding assures that Orbitrap is a reproducible method even with different ballpoint pens in different laboratories.
Even other methods of detection like those with LDI-MS15, 21, MALDI-TOF17, that are able to include the molecular information of all ionized chemicals of the inks, with different exact mass, the mass resolution of these methods is low (1,000), compared with the mass resolution of parts per million (1,0000) of Orbitrap.
Association of positive and negative mode masses in the multivariate analysis increase the discrimination power of the method, like already concluded by Gallidabino et al. [17]. In their study, they used the relative area peaks values combined with qualitative information, and using an specific equation, they reached 96.0% of Dicriminating Power. Despite of this, two groups of pens remained undiscriminated (same brand but different size of ballpoint, and same brand but different batch of manufacturing).
Using Orbitrap and Multivariate analysis, our study reached to discriminate all pens, even when the size of ballpoint were different. The PCA analysis provides information on the main dyes and/or ink additives responsible for the similarity and dissimilarity of the groups of pens. Multivarite analysis has the advantage to use all information provided from the Orbitrap, even the mass peaks of unidentified substances, and this increases the individuality of each pen ink formula.
Conclusion
The analysis of ballpoint pen samples in a Q-Exactive® Orbitrap mass analyser in positive and negative mode was able to differentiate the samples, even for inks of very similar color, and the method proved to be very sensitive. The exact mass spectra were submitted to multivariate statistical analysis and the Principal Component Analysis (PCA) and Hierarchical Cluster Analysis (HCA) was able to characterize the variables that were responsible for the variation and/or similarity of the samples. The HCA and PCA was able to group pens from the same brand, and also to approximate pens of different brands but similar formulations. At the same time, multivariate analysis could identify pens that were very dissimilar from the others, and could classify pens of the same brand but with different ballpoint size (fine point or medium point).
The determination of ink composition of different ballpoint pen strokes is an important way to identify frauds in forensic documents, and the Orbitrap proved to be a useful tool to obtain the exact mass of almost all substances of the pen ink formulation.
Acknowledgement
The authors wish to thank the Scientific Section of Brazilian Federal Police-Rio Grande do Sul Bureau and the Institute of Chemistry, Mass Spectrometry and Chromatography Laboratory, Federal University of Goias.
References
- Andrasko J (2001) HPLC analysis of ballpoint pen inks stored at different light conditions. J Forensic Sci 46(1): 21-30.
- Kher A, Green EV, Mulholland MI (2006) Forensic classification of ballpoint pen inks using high performance liquid chromatography and infrared spectroscopy with principal components analysis and linear discriminant analysis. Vibrational Spectroscopy 40(2): 207-277.
- Denman JA, Skinner WM, Kirkbride KP, Kempson IM (2010) Organic and inorganic discrimination of ballpoint pen inks by ToF-SIMS and multivariate statistics. Applied Surface Science 256: 2155-2163.
- Andrasko J (2001) Changes in composition of ballpoint pen inks on aging in darkness. J Forensic Sci 47(2): 324-327.
- Liu YZ, Yu J, Xie MX, Liu Y, Han J (2006) Classification and dating of black gel pen ink by ion-pairing high-performance liquid chromatography. J Chromatogr A 1135: 57-64.
- Liu YZ, Yu J, Xie MX, Chen Y, Jiang GY, et al. (2006) Studies on the degradation of blue gel pen dyes by ion-pairing high performance liquid chromatography and electrospray tandem mass spectrometry. J Chromatogr A 1125(1): 95-103.
- Wang J, Luo G, Sun S, Wang Z, Wang Y (2001) Systematic analysis of bulk blue ballpoint pen ink by FTIR spectrometry. J Forensic Sci 46(5): 10931097.
- Lee LC, Shandu KTS, Razi NSM, Ishak AA, Osman K (2015) Forensic analysis of blue ballpoint pen inks using ultraviolet-visible spectrometer and ultra-performance liquid chromatograph. Malaysian Journal of Analytical Sciences 19(2): 397-401.
- Confortin D, Neevel H, Brustolon M, Francoa L, Kettelarij AJ, et al. (2010) Crystal violet: study of the photo-fading of an early synthetic dye in aqueous solution and on paper with HPLC-PDA, LCMS and FORS. Journal of Physics: Conference Series 231: 012011
- Freidenfelds V, Mekss P (2012) The possibilities of determination of the relative age of ballpoint pen ink entries by high performance liquid chromatography. Latvian Journal of Chemistry 3: 242-248.
- Williams MR, Moody C, Arceneaux LA, Rinke C, White K, et al. (2009) Analysis of black writing ink by electrospray ionization mass spectrometry. Forensic Sci Int 191 :97-103.
- Ifa DR, Gumaelius LS, Eberlin LS, Manicke NE, Cooks RG (2002) Forensic analysis of inks by imaging desorption electrospray ionization (DESI) mass spectrometry. Analyst 132: 461-467.
- Siegel J, Allison J, Mohr D, Dunn J (2005) The use of laser desorption/ ionization mass spectrometry in the analysis of inks in questioned documents. Talanta 67(2): 425-429.
- Grim DM, Siegel J, Allison J (2002) Evaluation of laser desorption mass spectrometry and UV accelerated aging of dyes on paper as tools for the evaluation of a questioned document. Journal of Forensic Sciences 47(6): 1-9.
- Weyermann C, Kirsch D, Vera CC, Spengler B (2006) Photofading of ballpoint dyes studied on paper by LDI and MALDI MS. Journal of American Society for Mass Spectrometry 17(3): 297-306.
- Jones RW, Cody RB, Mcclelland JF (2006) Differentiating writing inks using Direct Analysis in Real Time mass spectrometry. J Forensic Sci 51(4): 915-918.
- Gallidabino M, Weyermann C, Marquis R (2011) Differentiation of blue ballpoint pen inks by positive and negative mode LDI-MS. Forensic Sci Int 204 (1-3): 169-178.
- Soltzberg LJ, Hagar A, Kridaratikorn S, Masttson A, Newman R (2007) MALDI-TOF Mass spectrometric identification of dyes and pigments. Journal of American Society for Mass Spectrometry 18(11): 2001-2006.
- Lalli PM, Sanvido GB, Garcia JS, Haddad R, Cosso RG (2010) Fingerprinting and aging of ink by easy ambient sonic-spray ionization mass spectrometry. Analyst 135: 745-750.
- Coumbaros J, Kirkbride KP, Klass G, Skinner W (2009) Application of time of flight secondary ion mass spectrometry to the in situ analysis of ballpoint pen inks. Forensic Science International 193(1-3): 42-46.
- Ng LK Lafontaine P, Brazeau L (2002) Ballpoint pen inks: Characterization by positive and negative ion-electrospray ionization mass spectrometry for the forensic examination of writing inks. J Forensic Sci 47(6): 12381247
- Moody CM (2018) Black writing ink analysis by direct infusion electrospray mass spectroscopy. Electronic Theses and Dissertations.
- Mass Spectrometry (2016) Fundamental LC-MS, Orbitrap MassAnalyzers. Chromacademy.
- Hoffman E, Stroobant V (2007) Mass spectrometry: principles and applications, (3rd edn), John Wiley and sons p. 502.
- Sun Q, Luo Y, Yang X, Xiang P, Shen M (2016) Detection and identification of dyes in blue writing inks by LC-DAD-orbitrap MS. Forensic Sci Int 261: 71-81.
- Carvalho CMB (2014) Analise da concentrafao basal dos solvents de tintas de canetas esferograficas. Brazilian Journal of Police Science 5(1): 65-96.
- Helfer GA, Bock F, Marder L, Furtado JC, da Costa AB, Ferrao MFG, et al. (2015) Chemostat, um software gratuito para analise exploratoria de dados multivariados. Quimica Nova 38(4): 575-579.
- Grim DM, Siegel J, Allison J (2002) Does ink age inside of a pen cartridge? Journal of Forensic Sciences 47(6): 1294-1297.
- Andrasko J, Kunicki M (2005) Inhomogeneity and aging of ballpoint pen inks inside of pen cartridges. Journal of Forensic Sciences 50 (3): 542547.
© 2018 Bello de Carvalho Carina Mariaa, et al. This is an open access article distributed under the terms of the Creative Commons Attribution License , which permits unrestricted use, distribution, and build upon your work non-commercially.
 a Creative Commons Attribution 4.0 International License. Based on a work at www.crimsonpublishers.com.
Best viewed in


.jpg)


 Editorial Board Registrations
 Submit your Article
 Refer a Friend
 Advertise With Us
.jpg)


.jpg)


.bmp)
.jpg)
.png)
.jpg)


.jpg)


.png)

.png)


.png)


