
- About Us
- Information
-

The Author ensures that the research has been conducted responsibly and ethically with adherence to all relevant regulations. read more..
- For Authors
- For Reviewer
- Manuscript Guidelines
- Membership
- Publication Ethics
-
- Journals
- Reprints
- e-Books
- Videos
- Policies
- Contact Us
 COVID-19
- Submissions


Full Text
Examines in Physical Medicine and Rehabilitation: Open Access
Application of Machine Learning Methods in the Blood Glucose Prediction
Artur Wodołażski*
Department of Energy Saving and Air Protection, Poland
*Corresponding author: Artur Wodołażski, Department of Energy Saving and Air Protection Plac Gwarków 1, 40-166 Katowice, Poland
Submission: November 10, 2021; Published: November 30, 2021

ISSN 2637-7934 Volume3 Issue4
Abstract
Type 1 diabetes (T1D) is a chronic disease that requires patients to know the blood glucose values to ensure their normal levels. The methods for predicting blood glucose are one of the areas of interest for clinical researchers. The literature describes many methods of predicting blood glucose, which require the determination of many activities, such as the time of insulin injection or emotional factors that may be susceptible to errors. To reduce the impact of individual activities, continuous glucose monitoring (CGM) is proposed to predict the level of glucose in the blood regardless of other factors. The paper presents the comparison of machine learning methods such as: linear regression, vector (SVR) and selected evolutionary algorithms (AE) to predict glucose concentration. The proposed methods based on SVR, and AE algorithms have achieved high accuracy and quality of predicted results..
Keywords:Machine learning; Evolutionary algorithms; Glucose concentration
Introduction
In the human body, the regulation of blood glucose levels is controlled by the action of two hormones: glucagon and insulin. The loss or destruction of β cells in the pancreas causes type 1 diabetes (T1D). Therefore, a reduction in insulin production leads to an increase in blood glucose and hyperglycemia [1]. Insulin plays a significant role in the ability of cells to metabolize glucose [2]. Hyperglycemia is usually associated with complications such as long-term microvascular complications (diabetes, neuropathy, retinopathy, and nephropathy) that cause cardiovascular problems (stroke, peripheral arterial disease, and coronary artery disease). In addition, a decrease in blood glucose levels hypoglycemia can quickly turn into a critical situation for the patient, such as nervousness, sweating, rapid heartbeat, headaches and even coma. In line with the latest technological advances in diabetes.
Patients have the ability to monitor their blood glucose levels continuously (every few minutes). The devices used (CGM - Continuous Glucose Monitoring) represent a continuous method of monitoring blood glucose levels [3]. These sensors are placed subcutaneously in the patient’s interstitial fluid. In fact, the lag time between blood glucose and interstitial fluid can be as long as 5 minutes. This time is needed for the diffusion of the sensor and the computation of the time delay due to the filtering operation used to measure the CGM. In order to shorten the response and response times of the sensor, new efficient algorithms are needed that are able to predict the concentration of glucose over a given time horizon.
Machine learning techniques are often used in biology, image analysis or path morphology [4]. They are divided into supervised and unsupervised learning. Machine learning algorithms with the teacher include the support vector method, regression methods and neural networks. For tutorless learning methods, for example, k-means algorithms, auto-coders. Mathematical modeling includes methods that can be applied and implemented in electronic devices. However, in practice, they did not meet performance expectations due to limited precision and dependence on patient activity measurements [5]. Bremer et al. [6] tested blood glucose levels, recording data every 10 minutes. The experimental results obtained from the modeling of blood glucose data showed a time horizon of 10 minutes. Studies have shown that blood glucose levels can be predicted by using past blood glucose values. Sparacino et al. [7] compared the predictive accuracy of the autoregressive model (ARM) with the first-order polynomial model. The results showed that the ARM model was the most consistent for obtaining significant performance at 30-45 minutes ph. Palerm et al. [8] used the Kalman filter to predict blood glucose levels based on a derivative reconstruction of glucose levels.
Pappada et al. [9,10] proposed an artificial neural network (ANN) written on the basis of the “NeuroSolutions” software package, which allowed to predict blood glucose levels for a time horizon of 50-180 minutes. The experimental results showed that the predicted blood glucose levels were more accurate in the hyperglycemic and normoglycemic stages than in the hypoglycemic stages. Consequently, it can be concluded that the ANN prediction results largely depend on the quality and set of training data for these networks. The article presents the possibilities of using selected machine learning techniques in predicting the patient’s blood glucose. The goal is to accurately predict the blood glucose level of T1D patients using only CGM data as input to the learning phase. The practical implementation of the proposed method shows a reduction in computational complexity.
Methods
Selected machine learning algorithms, including linear regression, support vector regression (SVR) with and without nonlinear nuclear function, and evolutionary algorithms were used and compared in the modeling of glucose prediction. A description of each method is provided below.
Linear regression
When defining a linear model, the equation takes the general form:

where:
predicted value of the dependent variable,
constant component of the equation,
regression coefficient
measured value of the independent variable
The regression coefficient is given by the formula (2)
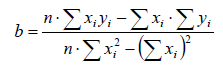
where:
n-observation numbers
Σ xi -sum of all measurement values
Σ yi -sum of all measurement values
Support vector regression
For the regression analysis of the support vectors, which maps a non-linear set of multivariate data, the SVR methodology determines the prediction function, which is given by the formula (3):
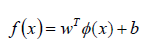
where:
trait space transformation,
weights of spatial matrices
random error
According to the Karush-Kuhn-Tucker theory [11], the regression function with the kernel function takes the form (4):
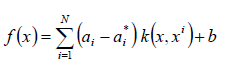
where:
Lagrange multipliers
kernel function used to compute the similarity between two input vectors in the transformed space
Modified evolutionary algorithm
Evolutionary algorithms are a global search strategy based on sample population analysis, where it is typically used as a global optimizer. Uses techniques in the analysis of differences in given samples (subjected to mutation, selection) on a multidimensional plane When minimizing a one-dimensional object, the objective function given by the formula (5) can be used:
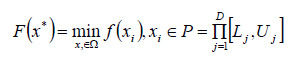
where: F-objective function xi=(xi,1....xi,d)-D-dimensional vector x* - global optimal solution to the optimization problem Lj,Uj - limits of j-tej varible P -search space,
The fitting function based on the evolutionary algorithm is given by the formula:
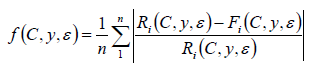
where:
control parameter,
kernel parameter,
current value,
predicted value,
training set size
The optimal values of the parameters ()are found after the iterative operation of the algorithm is completed. For simulation studies, publicly available experimental data [12] were used as input data as the training set. These measurements were based on realtime sensor sampling (CGM) for continuous glucose monitoring. Forecasting was performed using machine learning algorithms. For each new sample taken, the model parameters are re-estimated. The mu factor represents the weight of the blood glucose sample in relation to the current sampling time.
Discussion of the results
The studies compared machine learning algorithms to predict blood glucose values to generate early warnings of hypoglycemia. An example of a blood glucose forecast is shown in Figure 1. The figure shows that, depending on the algorithms used, the predicted signal exceeds the hypoglycemic threshold in the range of 1-2. For linear regression, in the first case t ≈730 minutes it is a falsepositive result. In the second case, at t ≈ 830 minutes, the model correctly predicts the event approximately 15 minutes in advance. The modified evolution algorithm and the SVR with nonlinear nuclear function are most effective in predicting glucose levels with an RMSE error below 8%. When using linear regression, the RMSE error varies between 32-11% depending on the dynamic change curves.
Figure 1: Results of blood glucose forecasting using various machine learning algorithms (ph=30 and mu = 0.9).

The proposed SVR technique similarly estimates non-linear changes in blood glucose while avoiding overfitting. Despite the rapid development of CGM systems as hardware devices, the evolution in the development of algorithms in blood glucose forecasting has been significantly less. The main problems of implementing devices for blood glucose monitoring systems are increasing the accuracy of predicting results, minimizing errors, as well as measuring accuracy of blood glucose concentration.
Summary
The paper presents selected machine learning algorithms for predicting blood glucose concentration. The support vector regression (SVR) algorithm and the evolutionary algorithm show the best prediction results. The evolutionary algorithm optimizes the SVR parameters and is most efficient. The proposed method has numerous advantages, such as: accuracy, adaptability, robustness, as well as efficiency in modeling nonlinear and complex data series. In the future, the clinical validation of the algorithm will continue for a potentially real application. Risk assessment is an adequate tool to predict the vulnerability of the system in terms of corrosion in order to manage a maintenance strategy for optimizing safety of human health.
References
- Han J (2006) Accuracy and error measures concepts and techniques. Data mining, United States of America, p. 770.
- Klonoff DC (2005) Continuous glucose monitoring-roadmap for 21st century diabetes therapy. Diabetes Care 28(5): 1231-1239.
- Tan G, Yan J, Gao C, Suhua Y (2012) Prediction of water quality time series data based on least squares support vector machine. Procedia Engineering 31: 1194-1199.
- Gertych A, Ing N, Ma Z, Fuchs TJ, Salman S, et al. (2015) Machine learning approaches to analyze histological images of tissues from radical prostatectomies. Comput Med Imaging Graph 46: 197-208.
- Koutny T (2013) Glucose predictability, blood capillary permeability and glucose utilization rate in subcutaneous, skeletal muscle, and visceral fat tissues. Comput Biol Med 43: 1680-1686.
- Bremer T, Gough D (1999) Is blood glucose predictable from previous values? A solicitation for data. Diabetes 48(3): 445-451.
- Sparacino G, Zanderigo S, Aran A, Cobelli C (2006) Continuous glucose monitoring and hypo/hyperglycemia. Diabetes Res Clin Pract 74(2): 160-163.
- Palerm C, Willis J, Desemone J, Bequette B (2005) Hypoglycemia prediction and detection using optimal estimation. Diabetes Technol Ther 7(1): 3-14.
- Pappada SM, Cameron BD, Rosman PM (2008) Development of a neural network for prediction of glucose concentration in type 1 diabetes patients. J Diabetes Sci Technol 2(5): 792-801.
- Pappada S, Cameron B, Rosman P, Bourey R, Papadimos T, et al. (2011) Neural network-based real-time prediction of glucose in patients with insulin dependent diabetes. Diabetes Technol Ther 13(2): 135-141.
- Edgar TF, Himmelblau DM, Lasdon LS (2001) Optimization of chemical process. McGrawHill, New York, USA.
- http://www.dei.unipd.it/~gianni/gsref-en.html
© 2021 Artur Wodołażski. This is an open access article distributed under the terms of the Creative Commons Attribution License , which permits unrestricted use, distribution, and build upon your work non-commercially.
Editor In Chief


.jpg)


Signup for Newsletter

Quick Links
 Editorial Board Registrations
 Submit your Article
 Refer a Friend
 Advertise With Us
Our Recent Edition

.jpg)


Top Editors


.jpg)


.bmp)
.jpg)
.png)
.jpg)


.jpg)


.png)

.png)


.png)


Financial Support

Sponsors

Latest e-Books

Latest Video

 a Creative Commons Attribution 4.0 International License. Based on a work at www.crimsonpublishers.com.
Best viewed in
a Creative Commons Attribution 4.0 International License. Based on a work at www.crimsonpublishers.com.
Best viewed in