- Submissions

Full Text
Examines in Physical Medicine and Rehabilitation: Open Access
Severity of Pain, and Sensory Changes in Patients with Rheumatoid Arthritis: A New SH-Pain Scale
Handan Ankarali1*, Safinaz Ataoglu2, Seyit Ankarali3 and Ozge Pasin1
1 Medical Faculty, Biostatistics Department, Turkey
2 Medical Faculty Physical Medicine and Rehabilitation, Turkey
3 Medical Faculty, Physiology Department, Turkey
*Corresponding author: Handan Ankarali, Department of Biostatistics, Faculty of Medicine, Turkey
Submission: January 18, 2019;Published: March 18, 2019

ISSN 2637-7934 Volume2 Issue3
Abstract
Objective: The aim of the study was to develop a new scale to evaluate pain threshold, severity of chronic pain, and the sensory effects of pain on patients with rheumatoid arthritis.
Methods: This study is a scale survey designed in cross-sectional type. A new scale with totally 8 questions were used to data collection. Sixty-one patients were included in this study who were diagnosed with rheumatoid arthritis in Duzce University-Turkey. The patients were selected voluntarily and matched into the criteria for inclusion into the study. Statistical analyses used were reliability analysis and factor analysis.
Results: There were a total of 6 questions, 3 for very severe pain and 3 for mild pain. The patients were divided into two groups having low and high pain thresholds according to answers to these questions. The other two questions on the scale were used to measure the severity and the sensory effect of pain respectively. The internal consistency between the eight questions of the scale was found high (Alpha coefficient=0.729). There were found a total 3 factors, after factor analysis, one for severe pains, one for mild pains and the last one for severity of pain. In addition, there was no significant difference between two groups having low and high pain thresholds in terms of severity of pain and sensory change due to rheumatoid arthritis. The severity of pain was found to be like headache, toothache and abdominal pain.
Conclusion: The advantages of the new scale include; assessing pain severity more thoroughly and more easily, determining pain threshold, associating pain threshold with pain severity, and comparing the severity of pain caused by the disease with the experienced pain.
Perspective: SH pain scale gives more information to clinicians about the severity of pain, pain effects, and pain threshold. In the literature there is no other scale that evaluates these 3 outcomes together and is easy to implement, easy to understand, and give fast results.
Keywords: Pain threshold; Pain severity; Rheumatoid arthritis; Sensory effects; VAS
Introduction
Pain is sensory response resulting from tissue or organ damage. It is affected by different factors and is generally divided into two types in the clinical setting as acute and chronic pain. The treatment of acute pain is easier, and its effects on the patient are transient, resolving within a short time. However, as chronic pain becomes integrated into the patient’s body, it is important to identify the pain with its different aspects as well as diagnose the disease [1,2]. Acute pain is a warning and a signal that indicates the presence of extraordinary conditions in the body, whereas chronic pain ceases to be a signal and becomes a symptom, or a disease, that should be treated [3]. Rheumatoid arthritis (RA) is the most common systemic, autoimmune, chronic, inflammatory disease that causes arthritis in joints. If untreated, it causes damage, deformities, and disability in joints. RA is diagnosed when a patient has polyarticular inflammatory arthritis that persists for more than six weeks, particularly if hands and feet have been affected. This is the main problem in a RA patient and the first complaint that causes them to consult a physician. Even though the main and ultimate point in measuring the effectiveness of the treatment is pain relief, determining the severity of the pain is very difficult [4]. This disease’s prevalence ranges from 0.5% to 1%, and is encountered throughout the world, in patients of all ages [5]. In a clinical setting, scales that usually yield rapid results that are easy to understand are widely used. These scales are called unidimensional scales as they measure the pain severity. Among these, the most commonly used and known scales are verbal rating scales (VRS), numerical rating scales (NRS), and visual analogue scales (VAS). However, these scales usually assess the patient with a 5, 10- or 100-point rating, and produce misleading results in inarticulate patients, or illiterate elderly patients. VAS and similar scales used in practice were mostly suitable for evaluation of acute pain. However, it is also used for evaluating chronic pain. These commonly used scales measure pain severity only. In addition to the pain severity, it is essential to grade the sensory effects it causes. Furthermore, determining the pain threshold should be a part of the treatment. Thus, the biopsychosocial effects of pain can be addressed in more detail based on the pain threshold [6-12]. In the present study, we aimed to develop a new scale to determine the pain threshold of patients diagnosed with RA and assess the severity and sensory effects of chronic pain, and the relations between them. The proposed scale in this study combined the best features of VAS and similar scales and examined the pain severity, and sensory effects and pain threshold in patients. There is not a scale used in practice evaluate with together these 3 properties which are important for chronic pain.
Method
Sample and data
The study is a cross-sectional scale study. Sixty-one volunteering patients previously or newly diagnosed with RA according to 1990 American College of Rheumatology (ACR) criteria who met inclusion and exclusion criteria. It included patients who presented to Düzce University-Turkey, Faculty of Medicine, Department of Physical Medicine and Rehabilitation from February - June 2017 and were recruited into the study. Approval was received from the Non-Invasive Clinical Trials Ethics Committee of Düzce University for the study before data collection was initiated. A nurse who previously received training about the scale was assigned for data collection. The data was collected by face to face interview between the nurse and the patient.
Subject inclusion and exclusion criteria
Adult patients (aged 19-79) previously or newly diagnosed with RA who volunteered to participate in the study, whose level of cognition is enough to answer the questions and who provided consent on the informed consent form were included in the study. Patients who presented to the hospital for a reason other than RA, who did not provide consent on the informed consent form, pediatric patients, or elderly patients with a low level of cognition were excluded from the study.
Measurement Tool (SH - pain severity and pain threshold scale)
a) The scale used in the study was created by the authors of the study to determine pain severity and threshold, and it was named “SH-pain severity and pain threshold scale”. The pain assessment form contains eight questions. The answers to the questions were marked on the 100mm ruler created. The ruler is like the VAS scale, which is a numerical and verbal assessment scale for pain; however, it is superior in some respects.
b) The 100mm ruler was marked with a bracket every 2mm. Thus, the patient could give more detailed answers.
c) Since the patients who participated in the study were middle-aged or older, and that most of them were females, facial expressions indicating pain status were put at six suitable points on the ruler so that people with a low level of education could understand the assessment scale better.
d) The expressions “No pain”, “Moderate pain”, and “Unbearable violence” were put at the suitable points on the ruler.
e) In addition, the degree of the sensory effects such as uncomfortable/anxious/restless resulting from RA was assessed by this scale. Thus, not only the severity, but also the sensory effects of pain were studied.
Hence, the good features of the current different scales (VAS, VRS and NRS) were combined, which enabled the patients to give the most precise answers. The scale form developed is presented in the Appendix. Furthermore, misunderstandings were minimized through the face to face interview method, and the errors that could result from different persons applying the scale were eliminated. The first six questions on the scale were used to determine the pain threshold. The seventh question was used to measure the severity of the pain caused by RA, and the last question was used to measure the severity of the sensory changes caused by RA pain. The first three questions (1. Level of worst headache you experienced before; 2. Level of worst stomach ache you experienced before; 3. Level of worst tooth ache you experienced before) query severe pain status. These 3 questions were taken from the Mc Gill Melzack Pain Questionnaire, which is commonly used in the assessment of chronic pain and contains the most comprehensive information [13]. It was considered that the patients who rated all of these three questions as 50 or more had either severe pain, or a low pain threshold. The patients who gave a low rating to two questions, or a high rating to one and low rating to others are considered to have a normal pain threshold and did not experience the severe form of pain type which they rated low. The patients who gave a low rating to all the three questions were considered to either have a high pain threshold or were not experiencing the severe forms of these pain types. Questions 4-6 in section two of the scale (4. Level of pain I experienced when I jabbed my finger with a needle; 5. Level of pain I experienced when I cut my finger with small pieces of glass or a knife; 6. Level of pain you experience when blood is drawn from your arm vein) query pain status of low severity. As in severe pains determination in the McGill Pain Questionnaire, questions were constructed about mild pain and used for the first time in this study. The list of the most commonly mentioned mild pains in the community was created by a pilot study. Then people were chosen from this list the 3 mildest forms of pain. The patients who rated all these three questions as 50 or less were considered to have a normal pain threshold. The patients who gave a low rating to one or two questions feared the procedures mentioned in the question to which they gave a high rating. The patients who gave a high rating to all the three questions were considered to possibly have a low pain threshold or fear needle sticks/knife cuts/glass cuts. In conclusion, the people who generally gave a high rating to the questions about severe pain (minimum two), and a low rating to questions about mild pain (minimum two) were considered to have a high pain threshold. In these classifications, the cut-off value of the scale score was taken as 50, scores higher than 50 were considered “high”, and scores lower than 50 were considered “low”.
In the two sets that were used to query pain of high and low severity with each containing three questions, the patients who gave a low rating (under 50) to a minimum of two questions were considered to have a high pain threshold, or the patients were not considered to experience the three types of pain in the question as severe. The patients who gave a high rating both to a minimum of two out of the three questions that queried severe pain, and to a minimum of two out of the three questions that queried mild pain were considered to have a low pain threshold. There were no patients who gave a low rating to the three questions about very severe pain or a high rating to the three questions about mild pain in the data set. The procedure followed to determine pain threshold is summarized in Table 1.
Table 1:Determination of pain threshold.
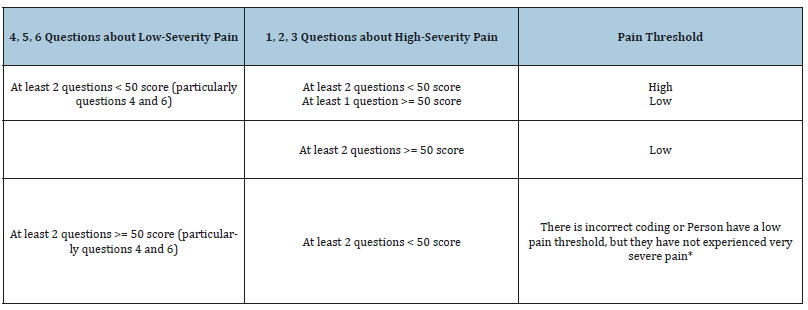
*There is no person entering this group in the data set
Statistical analysis
The descriptive statistics (mean, standard deviation, minimum and maximum values, count and percent frequencies) of the data were calculated and given in the tables. The exploratory factor analysis was used to show the underlying structure of the new scale. Assessment of whether the factor analysis was appropriate for the data structure was determined by the Kaiser-Meyer Olkin test, and the suitability of the correlations between the questions on the scale was determined by the Bartlett’s Sphericity test. In determining the number of suitable factors, whether the eigenvalues of the factors were greater than 1 (Kaiser Criterion) was taken into consideration. The Principal Components Method was used to obtain factor loads, and Varimax Rotation Method was used for significant factor loads. Internal consistency between questions was investigated using the Cronbach alpha coefficient, while the Intraclass Correlation Coefficient (ICC) was used to measure of the reliability of measurements. The differences between pain severity due to RA and pain severity due to other diseases were compared by using paired samples t-test. The pain severity scores due to RA of the patients with low and high pain threshold were compared by independent samples t-test. The statistical significance level was setup as p< 0.05 and SPSS (ver. 18) was used in all calculations.
Result
The mean age of the total 61 patients who participated in the study, 49 of whom were females (80.3%), and 12 of whom were males (19.7%), was 53.7±13.2 (19-79). The mean disease duration was 10.8±9.2 years. 22% of patients were illiterate, 49.2% were elementary school graduates, 22% were high school graduates, and 6.8% had a bachelor’s or postgraduate degree. For the SH pain threshold and pain severity scale containing eight questions, construct validity was investigated by explanatory factor analysis in the first step. The result of the Kaiser-Meyer test was calculated to be 0.718. In addition, it was determined that the correlation matrix was not spherical (p< 0.0001). These results indicated that a factor analysis could be conducted for the newly developed scale. As the diagonal elements in the anti-image correlation matrix were greater than 0.50, it was concluded that there were no items that should be removed from the scale. Three significant factors with a factor analysis eigenvalue greater than 1 were found, and it was observed that it explained 70% of the total variation of the factors. Raw factor loads were rotated by Varimax Rotation Method, yielding the coefficients given in Table 2. These coefficients show the contribution of the items in the scale to the factor. In addition, which item has a weighed effect in the factor is determined based on these coefficients. When Table 2 was reviewed, it was observed that the first three questions on the scale were included in the second factor, questions 4, 5, and 6 were included in the first factor, and the last two questions, 7 and 8, were included in the third factor. It was concluded that these questions were fit for the preparation purpose of the scale, in that the questions in the second factor were about very severe pain, the questions in the first factor were about mild pain, and the questions in the third factor were about the severity of pain and the sensory effects caused by the disease with which they were diagnosed.
Table 2:Rotated factor loading.
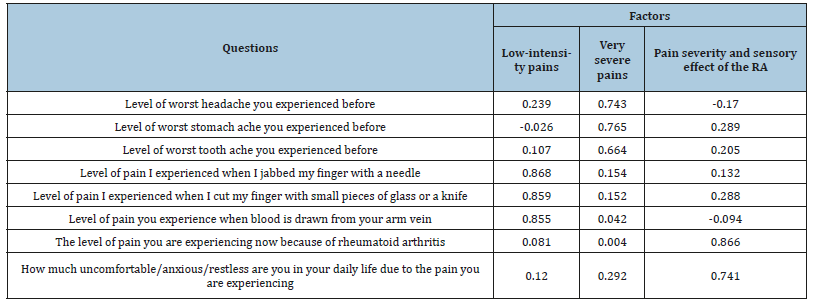
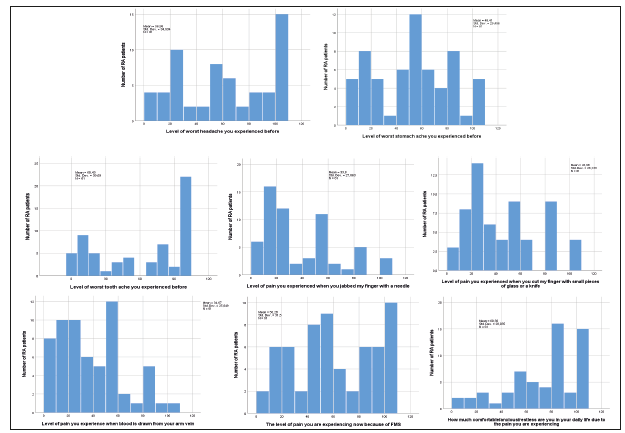
The coefficient of agreement between questions 1 and 2, 1 and 3, and 2 and 3, which were about very severe pain was 0.501, 0.406, and 0.504, respectively. In addition, the coefficient of agreement between questions 4 and 5, 4 and 6, and 5 and 6, which were about mild pain was 0.851, 0.741, and 0.732, respectively. The coefficient of agreement between the severity of pain caused by RA and the severity of the sensory effect of the disease was found to be 0.550 (p< 0.001). This result demonstrates that, overall, the higher the severity of pain, the higher and the severity of the sensory effect. The internal consistency level between the eight questions of the scale was calculated to be 0.729. This result demonstrates that the consistency among the answers to the questions is high. The distribution of the ratings given by the patients to the questions in the scale is presented in Figure 1. When Figure 1 was reviewed, it was observed that all questions were given a low or a high rating; however, the ratings given to the questions about very severe pain and the ratings given to RA pain severity and sensory effect severity had a comparable distribution, and patients mostly gave a moderate rating to “glass/knife cut on the finger” out of the three questions about mild pain, and they mostly gave a low rating to the other two questions. According to the evaluation summarized in Table 1, after the patients were grouped into low and high pain threshold patients, the two groups were compared with respect to the ratings they gave to the questions, and it was seen that the severity of pain caused by RA was significantly lower than that of the worst headache, while it was not significantly different from the worst abdominal pain and the worst toothache. The ratings given to mild pain were significantly high in the group with low pain threshold. Furthermore, RA pain severity and the sensory response caused by the disease was significantly higher in the group with low pain threshold. This result suggests that the pain RA patients feel varies depending on pain threshold (Table 3). No significant difference was found between the severity of pain caused by RA and the severity of the other three worst types of pain. This result suggests that the severity of the pain caused by RA is comparable to the worst abdominal pain, the worst toothache, and the worst headache that the patients had suffered. In addition, the severity of the pain caused by RA was found to be significantly lower than the severity of the sensory change which is also caused by RA (Table 4). This result suggests that the severity of the sensory change caused by RA is higher than that of the pain threshold. No significant difference was found between gender with respect to the severity of pain caused by the said pain types and the severity of the sensory response caused by RA. In addition, no significant relation was found between the age range evaluated in the study and RA pain severity and the degree of sensory response caused by RA.
Table 3:Comparison of patients with low and high pain thresholds in terms of scale scores.
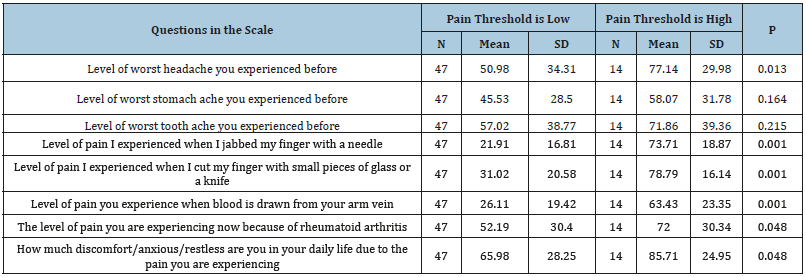
Table 4:Comparison of RA pain severity with RA sensory effect and others pain severities.
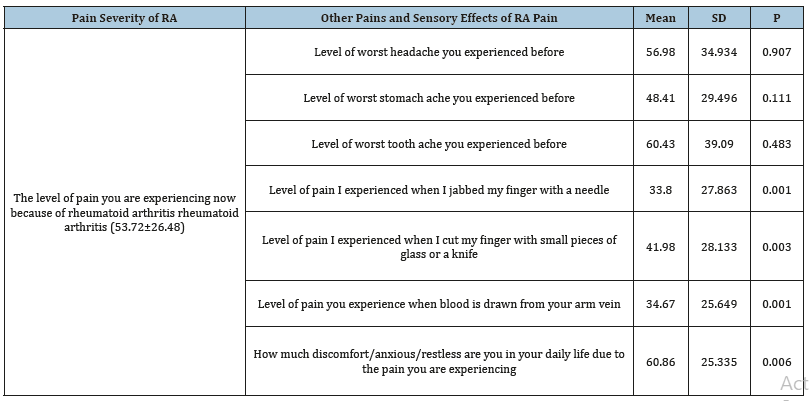
Figure 1:FT-IR spectrum of Gymnema sylvestre leaf extract mediated synthesized zinc nanoparticles.
Discussion
As chronic pain has become a syndrome or a disease on its own, it is crucial that the degree and effects of pain are fully identified. However, full identification requires a good measurement tool accompanied by a healthcare professional [7-9]. Furthermore, the fact that differences in pain threshold may have an effect in identifying the severity of pain between patients should be kept in mind. Therefore, the measurement tool should put emphasis on visual assessment, describe pain threshold in more detail, contain concepts of pain severity, and take pain threshold into consideration. Many investigations have been conducted on this subject, and VAS scale has been widely used in the assessment of pain severity in clinical settings [7-14]. This scale is easier to understand, and it yields results more rapidly according to other multidimensional scales as Mc Gill Melzack Pain Questionnaire. There are a variety of VAS scales. One of these scales, which comprises of facial expressions, was created specifically for pediatric or inarticulate patients. Another version comprises of expressions describing pain severity, while another VAS scale uses a 10cm ruler. Another VAS scale was prepared as a five-point Likert scale [9]. However, all of these have both advantages and disadvantages. Combining these properties and increasing the emphasizing sections on the ruler indicating pain severity will allow the patient to be assessed with a scale that is more detailed and clearer, as well as more rapid and more correct. In addition, it will be in a format that can be better understood by patients with a low education level or poor cognition. Knowing the pain threshold will allow more correct decisions about the disease to be made, as well as pain severity to be determined. In addition, for the purpose of explaining the level of pain severity associated with the diseases and empathizing with the patient, simultaneously measuring, associating and evaluating the severity of pain caused by the disease in question and the severity of pain experienced by almost everyone would provide great convenience in helping to understand the patient.
In the present study, a new scale that can reveal the pain threshold and pain severity of RA patients was defined. In most of the studies conducted up until now, the pain severity of RA has usually been assessed using the 10cm VAS scale or the five-point Likert scale [5]. There is a total of eight questions in the scale, and the consistency of the 3 items on very severe pain was moderate. The fact that the consistency was not very high suggested that all patients may not have had pain of high severity. On the other hand, there was a high consistency between the answers given to the 3 questions questioning mild pain. This result suggests that the reason why the three types of pain were of low severity is that they had been experienced by almost everyone and generally perceived as mild pain. Various methods and devices such as algometer or Pain Matchers that produce numeric results are used for determining pain threshold [15,16]. Algometer results are not the gold standard. In addition, this device is not available in many centres. However, a scale is not found for evaluation of pain treshhold.in the clinical setting. The scale suggested in this study can be used as a guide for the studies to be conducted on this subject. Both very severe and mild pain types that most people are likely to have experienced at some point should be used for determining pain threshold [14]. The pain types presented in this study may be increased or changed. Both very severe and mild pains should be taken into consideration in determining the pain threshold. This is because there may be differences between patients with respect to experiencing very severe pain, and this result may lead to a low rating as the patient has not experienced very severe pain to a great extent. Persons who gave a high rating to both very severe and mild pain types are expected to have a low pain threshold, while others are expected to have a high pain threshold. In our study, the level of pain caused by RA was found to be comparable to severe toothache, severe abdominal pain, and severe headache experienced by patients. In addition, the severity of the sensory change caused by RA was found to be significantly higher than the severity of RA pain. It was considered that these effects may also be relieved through the treatment of pain; otherwise, sensory effects that can become chronic may occur.
In conclusion, the new scale suggested in the study can be improved. Its advantages are that it assesses pain severity in a more detailed visual way, it determines pain threshold, it provides the opportunity for evaluation by associating pain threshold and pain severity, and it allows comparison of the severity of pain caused by the disease in question with the pain previously experienced. This scale was to assess pain more rapidly according to measuring tools that describe the complex pain model include the Mc Gill Melzack Pain Questionnaire, the Dartmount Pain Questionnaire, the West Haven-Yale Multidimensional Pain Scale, the Reminder Pain Assessment Card, the Wisconsin Short Pain Schedule, and the Pain Detection Profile and Behavioral Patterns, and also this scale was to assess pain more accurately according to commonly used VAS. This scale results were not compared the others such as VRS, NRS and VAS because this new scale cannot evaluate only severity of pain, it is also evaluated pain threshold and sensory effect. But, VRS, NRS and VAS are only evaluated severity of pain. In addition, pain severity measuring part (last question) in the new scale have constructed by using combined good features of the VRS, NRS and VAS. i.e., these scales are simple form of our scale. For this reason, this new scale is expected to be as good as other scales such as VRS, NRS, and VAS for measuring pain severity. According to this explanation, we can say that the new scale is produced valid results for measuring of severity of pain. However, in order to evaluate the validity of the first 6 questions that measure pain threshold, devices such as algometer are needed. The validity of this part of the scale has not been examined since this device is not found in our department. It is aimed to make this assessment in the next studies.
References
- Günvar T (2009) Basic principles of chronic pain management in primary care. Turkish Journal of Family Medicine and Primary Care 3(3): 14-17.
- Lamont LA, Tranquilli WJ, Grimm KA (2000) Physiology of pain. Vet Clin North Am Small Anim Pract 30(4): 703-728.
- Karaman HÖ (2010) An annual case analysis of our pain clinic. Pamukkale Medical Journal 3(1): 17-22.
- Callahan LF, Brooks RH, Summey JA, Pincus T (1987) Quantitative pain assessment for routine care of rheumatoid arthritis patients, using a pain scale based on activities of daily living and a visual analog pain scale. Arthritis and Rheumatism 30(6): 630-636.
- Rudan I, Sidhu S, Papana A, Meng SJ, Wei YX, et al. (2015) Prevalence of rheumatoid arthritis in low-and middle-income countries: a systematic review and analysis. J Glob Health 5(1): 1-10.
- Dedhia JD, Bone ME (2009) Pain and fibromyalgia. CEACCP 9(5): 162- 166.
- Aslan FE (2002) Pain assessment methods. CÜ Journal of Nursing School 6(1): 9-16.
- Garra G, Singer AJ, Taira BR, Chohan J, Cardoz H, et al. (2010) Validation of the Wong-baker faces pain rating scale in pediatric emergency department patients. Acad Emerg Med 17(1): 50-54.
- Hjermstad MJ, Fayers PM, Haugen DF, Caraceni A, Hanks GW, et al. (2011) Studies comparing numerical rating scales, verbal rating scales, and visual analogue scales for assessment of pain intensity in adults: a systematic literature review. J Pain Symptom Manage 41(6): 1073-1093
- Bayram K, Erol A (2014) Childhood traumatic experiences, anxiety and depression levels in fibromyalgia and rheumatoid arthritis. Archives of Neuropsychiatry 51(4): 344-349.
- Kerns RD, Turk DC, Rudy TE (1985) The west haven-yale multidimensional pain inventory (WHYMPI). Pain 23(4): 345-356.
- Gracely RH, Kwilosz DM (1988) The descriptor differential scale: applying psychophysical principles to clinical pain assessment 35(3): 279-288.
- Melzack R (1975) The mcgill pain questionnaire: major properties and scoring methods. Pain 1(3): 277-299.
- Aslan EF, Badır A (2005) Reality about pain control: The knowledge and beliefs of nurses on the nature, assessment and management of pain. The Journal of the Turkish Society of Algology 17(2): 44-51.
- Güldoğuş F, Kelsaka E, Öztürk B (2013) The effect of gender and working conditions on pain threshold in healthy volunteers. The Journal of the Turkish Society of Algology 25(2): 64-68.
- Tsao JCI, Myers CD, Craske MG, Bursch B, Kim SC, et al. (2004) Role of anticipatory anxiety and anxiety sensitivity in children’s and adolescents’ laboratory pain responses. J Pediatr Psychol 29(5): 379-388.
© 2019 Handan Ankarali. This is an open access article distributed under the terms of the Creative Commons Attribution License , which permits unrestricted use, distribution, and build upon your work non-commercially.
 a Creative Commons Attribution 4.0 International License. Based on a work at www.crimsonpublishers.com.
Best viewed in


.jpg)


 Editorial Board Registrations
 Submit your Article
 Refer a Friend
 Advertise With Us
.jpg)


.jpg)


.bmp)
.jpg)
.png)
.jpg)


.png)

.png)


.png)


