- Submissions

Full Text
Examines in Physical Medicine and Rehabilitation: Open Access
Design of Photosynthetically Active Radiation Sensor
Dilip Yadav M*, Sumesh MA, Beno Thomas T, Karanth SP and Sadashivappa G
Laboratory of Electro Optic Systems, ISRO Peenya 1st Stage, India
*Corresponding author: Laboratory of Electro Optic Systems, ISRO Peenya 1st Stage, Bangalore, India, 560058
Submission: March 14, 2018;Published: May 04, 2018

ISSN: 2637-7934Volume1 Issue5
Abstract
Photo synthetically Active Radiation (PAR) is an important factor that directly influence the Terrestrial net primary productivity. Accurate measurement of PAR provides critical input to analyze the spatial and temporal variability’s of net primary productivity. This paper describes design development and characterization of a Photo synthetically Active Radiation (PAR) Sensor. Cosine correction of the sensor, Calibration of the sensor, Processing Electronics, field trials and comparison against a NIST calibrated quantum sensor. This sensor is a cost effective solution for measurement of PAR in terrestrial, underwater and space environments.
Keywords: Cosine correction; Calibration; Quantum sensor; PAR sensor
Introduction
Humans tend to regard plants as passive organisms because of their immobility. But plants are very active and they respond to environment very well. The process called photosynthesis plays a vital role in growth of a plant. In photosynthesis process one of the major requirements would be Sunlight. The whole spectrum of sunlight is not used by plants it is just a part of a band which is in visible region (400nm-700nm). In the other words it is called as Photo synthetically Active Radiation (PAR).
Plants very particularly respond to red and blue light and reflects green light [1]. The amount of PAR utilized, varies from plant to plant. Due to variations in spectral and temporal distribution of radiation which is having strong influence on plants, it is quite necessary to measure the quantity of radiation. The response to light conditions is reflected as variation in the rate of evaporation, transpiration and water uptake, their intermodal length, leaf size, orientation and chloroplast density and in turn decides the their flowering time and productivity time [2]. PAR can also be used to study light attenuation in atmosphere, Photo-inhibition, submerged aquatic vegetation, Plant productivity under test environment like green house and Photosynthetic Photon Flux Density (PPFD) under canopies and under water [3].
Measuring PAR involves measure of photon flux density. It is either measured in terms of Energy or by using Photo biological unit in terms of mole. When it comes to unit of measurement, it is sometime relative such as Lux, LUMEN and sometimes radiometric measurement such as watts, joules etc. Yet there is one more form of measurement depending on the number of photons incident, and is called as photo biological unit, μmols-1m-2. This paper deals with design and optimizing of a PAR sensor. Construction of PAR Sensor, mechanical design and various diffusers used for cosine correction is studied to optimize the performance of the sensor. Various performance parameters such as sensitivity, stability of the sensor also is detailed [4].
Construction of PAR Sensor
Figure 1:Construction of PAR sensor.

During terrestrial conditions, PAR value ranges from 0 to 3000μmols-1m-2. PAR at night is zero and during sunny days in summer the value of PAR would reach 2000 to 3000μmols-1m-2. Heart of PAR sensor is a high sensitivity silicon photo detector which is integrated with specially designed pass band optical filter whose pass band is 400nm to 700nm, which provides uniform sensitivity in that band of wavelengths. Aluminium housing is designed for packaging of the sensor. Figure 1 shows construction of PAR sensor. The characteristics of each element used with PAR Sensor are explained below
Silicon photo detector
Silicon Photo diodes are used in photovoltaic mode, wherein, the incoming radiation is converted to the form of photo current proportional to the number of input photon. Silicon photo diode used in PAR sensor has high current responsively in the solar spectrum, very low dark current, better linearity and minimal change in photo-response characteristics within the operating temperature range [5].
The salient features of Silicon Photo Diode is given below.
- Detector dimension: 5mmx5mm
- Active area: Not less than 4: 5mmx4:5mm±10μm.
- Absorption Junction type: n+/p.
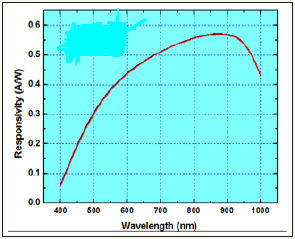
- Spectral response: 0.38A/w at 550nm; 0.87A/W at 870nm.
- Shunt resistance ≥10MΩ
- Capacitance =8nF.
- Dark noise at -2VR<10nA.
- Operating temperature =-100° to 100°C.
- Gonza´ lez JL, Calbo´ J (2002) Modelled and measured ratio of PAR to global radiation under cloudless skies. Agric For Me- teor 110(4): 319- 325.
- Grant RH, Gao W (2003) Diffuse fraction of UV radiation under partly cloudy skies as defined by the Automated Surface Observation System (ASOS). J Geophys Res 108(D2): 4046.
- Ross J, Sulev M (1999) Sources of error in measurements of PAR. Agriculture and Forest Meterology 100(2-3): 103-125.
- Blackburn WJ, Proctor JTA (1983) Estimating Photosynthetically active radiation from measured solar irradiance. Solar Energy 31(2): 233-234.
- Britton CM, Dodd JD (1976) Relationships of photo synthetically active radiation and shortwave irradiance. Agric Meteorol 17(1): 1-7.
- Czarnowski M (1994) Spectral composition of solar irradiation incident upon plant ecosystems. Zeszyty Problemove Postepów Nauk Rolniczych 405: 21-31.
- Czarnowski M (1994) Spectral properties of tree leaves. Zeszyty Problemove Postepów Nauk Rolniczych 405: 43-54.
- Czarnowski M, Cebula St (1996) Effect of leaf area index on spectral transmittance of solar radiation in greenhouse cultivation of sweet pepper plants. Folia Hortic 8(1): 53-72.
- Deering DW, Leone A (1986) A sphere-scanning radiometer for rapid directional measurements of sky and ground radiance. Remote Sens Environ 19(1): 1-24.
- Endler JA (1993) The color of light in forests and its implications. Ecol Monographs 63(1): 1-27.
- Slusser JR, Gibson JH, Bigelow DS, Kolinski D, Disterhoft P, et al. (2000) Langley method of calibrating UV filter radiometers. J Geophys Res 105(D4): 4841-4849.
- Spitters CJT, Toussaint HAJM, Goudriaan J (1986) Separating the diffuse and direct component of global radiation and its implications for modeling canopy photosynthesis. Part I. Components of incoming radiation. Agric For Meteor 38(1-3): 217-229.
The responsivity of the Silicon Photon Diode used in the sensor is shown in Figure 2
Figure 2: Responsivity of silicon Photo diode used.
Optical pass band filter
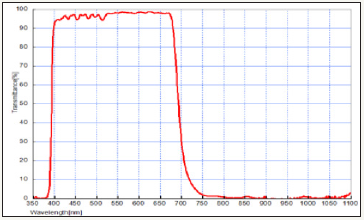
Optical filter used in PAR sensor is a special designed pass band glass filter. The pass band wavelength is 400nm-700nm. Dichroic type of optical filter is used. The response of the optical filter is given Figure 3 having maximum transmission of 95% from 400nm to 680nm and with band edge rejection of 2%.
Figure 3: Response of a filter used.
Active cosine correction: The sensor is made to align normal to the incident radiation each and every time before doing measurement which is highly time consuming and laborious.
Passive cosine correction: An optical diffuser of specific shaped geometry is used to achieve cosine correction. Selection of material and geometry are crucial in the design of the optical diffuser. Generally, there are two types of diffusers transmissive and reflective. The important properties of the diffuser that decide the ultimate performance are: Light transmission, Diffusion, and Efficiency. To get the greatest possible light transmission and greatest possible diffusion the efficiency should be high [6]. Diffuser Efficiency is obtained by the product of transmission with the diffusion parameters. Similarly 100% true response depends on the height of diffuser. Experimentally it is observed that, when the diffuser vertical edge is raised by 0.75mm it shows 100% true response. So we use acrylic diffuser with thickness 6mm which is raised by 0.75mm vertically. In the present construction an acrylic diffuser with thickness 6mm±10μm, diameter 12mm and an efficiency value of () is adopted.
Diffuser and cosine correction
The sensor should be cosine corrected in order to ensure accurate measurement from the sensor over FOV ±83° to obtain a true response. Lambert’s cosine law states that radiant intensity observed at a surface is directly proportional to the cosine of the angle of the incident radiation. Errors occur when the incident radiation is not normal to the surface of the sensor. To avoid these errors cosine corrected heads is used in the sensor. The output of the sensor is strongly dependent on the angle of incident radiation. So, cosine correction is quite necessary.
There are two types of cosine correction
1. Active cosine correction
2. Passive cosine correction
Housing
Housing of PAR sensor is of utmost element due to the facts that it should provide herm city of 5×10⁻⁷, moisture resistance, corrosion resistance and light weight. With priority better herm city was chosen, which is made of aerospace grade Aluminium alloy (Al Mg Si) 3036.
Processing Electronics
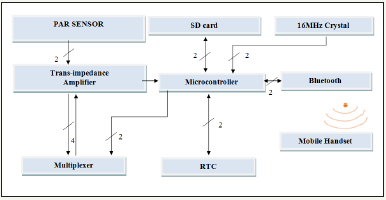
Processing electronics plays an important role in reading output from the sensor. Since Photo biological unit measuring number of photons in the 400nm-700nm range received by plant surface for Photosynthesis at a specified time is μmol/m2/s. The novel approach/design has been carried out, right from converting photodiode current into voltage and converting it into digital value to arrive at higher dynamic range under cloud and clear sky condition. Versatile field test friendly wireless system is incorporated to read the value from sensor via Bluetooth module [7]. The salient block diagram of the processing electronics and its realization is shown in Figure 4. The function of each component is discussed below.
Figure 4: General block diagram of the processing electronics involved.
Trans-impedance amplifier
Trans-impedance amplifier (I-V converter) is basically used to convert current into voltage. Since we are using op-amp in inverting mode the gain is just the feedback resistance used. Deciding what should be the gain of the amplifier completely depends on the ranges required for the user. We use four different ranges (20,200,2000,20000) in the device so there will be four different gains in the amplifier stage. Since the ranges are one order higher consecutively the gain will also be of one order difference consecutively. The gain selected would be (1M,100k,10k,1k). A zero offset drift and rail to rail opamp is required for transimpedance amplifier stage. AD8630 is the opamp used in the present design.
Multiplexer
Multiplexer is used for making gain selection in transimpedance amplifier. It is used in feedback for selection of four different gains, so 4:1 multiplexer is used. Multiplexer has two select lines for selecting four different gains, which is controlled by a microcontroller. Two digital pins of microcontroller is used as select lines to the multiplexer [8]. HC4052 is the multiplexer used. A two 4:1 Mix with same select lines is preferred hence HC4052 is used.
Microcontroller
Microcontroller is a heart of processing electronics. Microcontroller is necessary to make majority of the operations like selecting the gain of the trans-impedance amplifier by providing signal to the select lines of the multiplexer, retrieving date and time from the RTC, Data logging into SD card, communicating to the mobile handset via Bluetooth and converting analog data output of trans-impedance to digital value. Microcontroller used here is ATmega328p which is easy to be programmed using Adriano software. The main specifications of AT mega 328p is it has 6 analog pins, compatible with many integrated circuits, ease of programming [9].
RTC
RTC (Real Time Clock) is used get date and time and it used for data logging purpose. RTC communicates to the micro controller serially. DS3231 is the RTC module which is used here. Microcontroller communicates to RTC using I2C protocol.
SD card
SD card is used for data logging purpose and it communicates to the Microcontroller serially. 4 GB Micro SD card can be used and it is the maximum expandable memory limit. Microcontroller communicates to SD card module using SPI interface protocol [10].
16MHz crystal
16 MHz crystal is used as a secondary clock for Microcontroller. ATmega328p is only compatible with 16MHz crystal hence 16MHZ crystal is used.
Bluetooth module
HC-05 Bluetooth module is used communicate to a Mobile handset to a microcontroller. To make system low powered and wireless we use Bluetooth module and communicate wirelessly when necessary. It serially communicates with microcontroller and in return communicates with the mobile handset.
Mobile handset
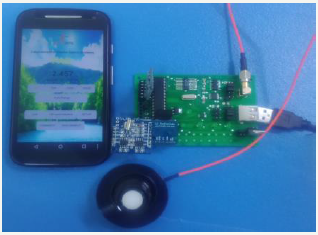
Mobile handset place a very crucial role, because it is the external controller used for Microcontroller. It is also used to display PAR output, which makes the system simple and compact. An Android application is build and used to communicate to the microcontroller using Bluetooth. MIT app inventor 2 is the innovative tool to build an android application and the flow chart of the logic used in the app is given below. There are two phase in Android app developing, one is designing the page of the android application, and the other one is designing the logic to be used in android application. Figure 5 shows the complete PAR sensor system which consists of Processing electronics, Mobile handset and sensor.
PAR Sensor Evaluation and Results
PAR sensor evaluation is carried out with various diffusers, by measuring spectral response and spatial response in front of illuminated white LED source with constant input of 40mA is shown in the test setup
The PAR sensor is mounted to a Thor labs rotary stage using Thor labs jig. LED light source is kept in axis with PAR sensor at a distance of 35 cm. The Thor labs rotary stage is mounted to a Huber table. The current from the sensor is measured and compared with NIST calibrated Licor sensor. Cosine Corrected PAR sensor developed was comparable with the standard Licor sensor Figure 6. The results of studies in each sensor evaluation is given below.
Figure 5: Flow chart of the android application.
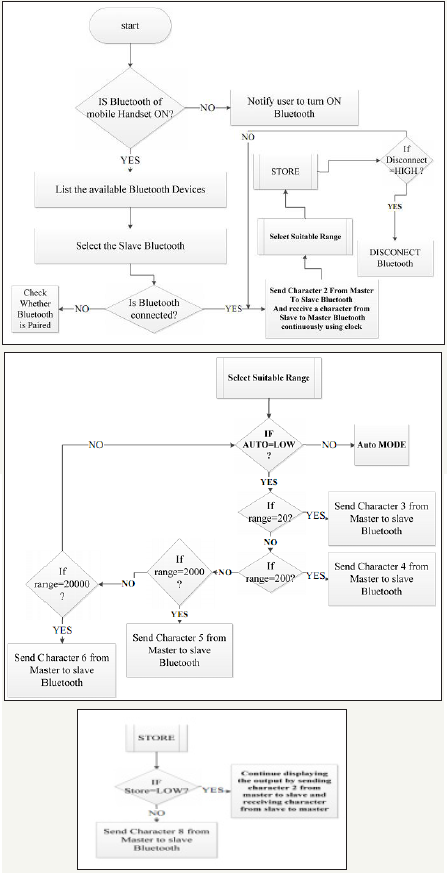
Figure 6: PAR Sensor Evaluation and Results.
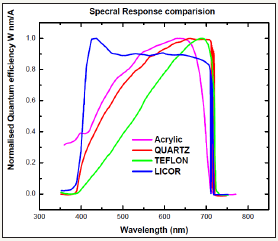
Spectral response comparison of PAR sensors with various diffusers
Figure above shows the spectral response comparison of PAR sensors with various diffusers and is compared with standard Licor Quantum Sensor Figure 7. The spectral response mainly depends on optical filter [11].
Figure 7: Test bench setup to measure spatial response of PAR sensor.

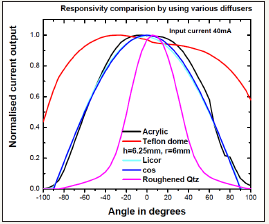
Responsivity comparison of PAR sensors with various diffusers
Figure 8: Spectral response comparison of PAR sensors with various diffusers.
The above figure shows Responsivity of PAR sensors with various diffusers. PAR Sensor with acrylic diffuser is close to the cosine curve which means cosine correction need to be done correctly by raising little more the vertical height of the diffuser Figure 8.
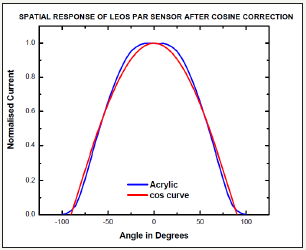
Cosine corrected acrylic diffused PAR sensor
The above figure shows the cosine corrected PAR sensor’s spatial response which almost co-insides with the cosine curve Figure 9.
Figure 9: Responsivity comparison of PAR sensors with various diffusers.
Transmittance evaluation of diffusers
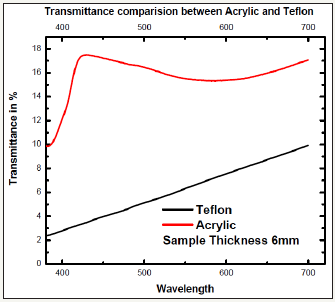
Transmittance evaluation is carried out using Spectrometer Perkinenseiver L950. The above figure shows the transmittance comparison between acrylic and Teflon diffuser. The figure depicts that Acrylic has high transmittance than Teflon and most important thing as discussed is transmittance in acrylic is most uniform, so use of acrylic diffuser in PAR sensor is more reliable to obtain true response Figure 10.
Figure 10: Spatial response of PAR sensor after cosine correction.
Calibration of PAR sensor
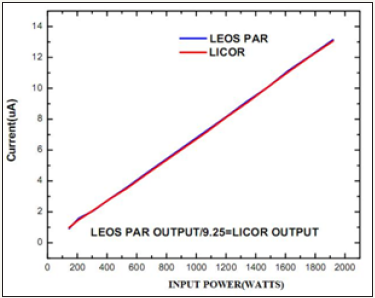
Calibration of PAR sensor is done against a standard Licor Quantum sensor which has a calibration multiplier as -142.6. Finding a calibration of PAR sensor built is done by comparing the PAR sensor developed with the NIST calibrated Licor Quantum sensor [12]. The below figure shows that the PAR sensor output is 9.25 times the standard Licor Quantum Sensor Figure 11. The calibration multiplier for the sensor built would be equal to (-142.6/9.25=-15.41) -15.41.
Figure 11: Transmittance comparison between Acrylic and Teflon.
Field trail comparison
Figure 12: Perfomance comparison between Licor Quantum sensor and the PAR sensor.
The field test comparison shows that the PAR sensor output has just a +/-4% error when compared with standard Licor Quantum sensor which is acceptable limit because the standard Licor Quantum sensor has a acceptable deviation in output of +/-5% which is higher than the PAR sensor developed. Field test is carried out to compare developed PAR sensor with NIST calibrated licor sensor over measurement of 7 hours 40mins which is shown in Figure 12&13.
Figure 13: Field Trial comparison between Licor Quantum sensor and PAR sensor.

Specification of the sensor developed
1. Sensitivity: 86nA per 1000umol
2. Response time: 100us.
3. Cosine correction: Acrylic Diffuser, cosine corrected upto 85°
4. Detector: High stability photo voltaic detector.
5. Sensor housing: weather proof ionized Aluminium housing.
6. Calibration Multiplier: -15.41
7. Dynamic range: 20-20000
Conclusion
The Novel PAR sensor is developed and validated against NIST calibrated Licor sensor. Field test is carried out and is comparable with NIST calibrated Licor sensor. The processing electronics designed can be customized by the user by adding more peripherals like GPS and GSM for knowing the exact location of the measurement made. There is still a future scope in increasing the dynamic range of a data logger. Making the system wireless has made it a low power and compact and the advantage is it becomes a standalone display unit which is basically a mobile handset, thus this makes the system first of it kind and it would greatly help in taking necessary measures for increasing the agricultural productivity.
References
© 2018 Dilip Yadav M. This is an open access article distributed under the terms of the Creative Commons Attribution License , which permits unrestricted use, distribution, and build upon your work non-commercially.
 a Creative Commons Attribution 4.0 International License. Based on a work at www.crimsonpublishers.com.
Best viewed in


.jpg)


 Editorial Board Registrations
 Submit your Article
 Refer a Friend
 Advertise With Us
.jpg)


.jpg)


.bmp)
.jpg)
.png)
.jpg)


.jpg)


.png)

.png)


.png)


