
- About Us
- Information
-

The Author ensures that the research has been conducted responsibly and ethically with adherence to all relevant regulations. read more..
- For Authors
- For Reviewer
- Manuscript Guidelines
- Membership
- Publication Ethics
-
- Journals
- Reprints
- e-Books
- Videos
- Policies
- Contact Us
 COVID-19
- Submissions


Full Text
Evolutions in Mechanical Engineering
Deformation Mechanisms in a Niobium-Added Zirconium Alloy via Load Relaxation Tests
Murty KL1*, Webber KA2 and Charit I3
1North Carolina State University, USA
2Presently at the Nuclear Regulatory Commission, Washington DC, USA
3University of Idaho, Idaho Falls, USA
*Corresponding author:Murty KL, North Carolina State University, Raleigh, NC 27695, USA
Submission: June 06, 2022;Published: July 28, 2022

ISSN 2640-9690 Volume4 Issue3
Abstract
Load relaxation tests have been performed on a recrystallized Nb-bearing Zr alloy sheet in the rolling direction at various temperatures. The strain rate - stress data thus obtained were used to identify the transitional deformation mechanisms in various modulus-compensated stress regimes. Crystallographic texture of the alloys that controls the extent of mechanical anisotropy was determined. Load relaxation tests are also performed in the direction at 45o to the transverse direction in order to characterize the deformation anisotropy. The degree of anisotropy (in terms of the strain rate ratio) is found to increase with the increase in stress exponent values.
Introduction
For over a few decades now, zirconium alloys (Zircaloy-2 and -4, composition being Zr-Sn-Fe-Cr-O alloys with minor variation) have remained the main cladding materials for light water reactors. However, it has been realized that the Nb-bearing zirconium alloys may offer good long term corrosion resistance and other improved mechanical properties. In fact, a few versions of the alloys have been used in the nuclear reactors of Canada (pressurized heavy water reactor or CANDU) and the erstwhile USSR. Recently, a significant progress has been made in the development of advanced niobium-added zirconium alloys in the US and Europe. ZirloTM and M5TM are set to become the main choice of cladding materials for the advanced reactor systems [1]. Higher temperatures under moderate stresses for long service duration necessitate the creep characterization of these cladding materials. Furthermore, the identification of creep mechanisms is of great importance not only from the viewpoint of the creep performance of current alloys but also to the development of newer alloys with improved properties. Unfortunately, the creep data available for the new alloys are at best scattered, and most creep data have been obtained from conventional creep tests. Here we report load relaxation test data of an Nb-bearing Zr alloy with the mechanistic interpretation. Load relaxation mode of testing has a few advantages over conventional creep testing in that it provides extensive test data in a very limited amount of time covering a large range of strain-rates, particularly useful for testing of irradiated materials.
The matrix phase of the zirconium alloys is basically -Zr that has a hexagonal close-packed crystal structure under reactor conditions. Because of very limited number of slip systems, it shows strong crystallographic textures following thermomechanical processing [2]. An earlier study on an Nb-modified Zr alloy (Zr-1Sn-1Nb-0.2Fe, wt.%) exhibited clear transitions in deformation mechanisms as evaluated from conventional tensile creep tests [3,4]. Tests were performed in both rolling and transverse directions. However, planar isotropy was noted. Because of these observations, in this study load relaxation tests were performed in the Rolling Direction (RD), and in the direction at an angle of 45o to RD in the plane of the sheet in order to identify the deformation anisotropy consistent with the textural characteristics.
Experimental
An Nb-modified Zr alloy, Zr-1.5Sn-0.1Fe-0.05Cr-0.06Ni-0.2Nb- 0.11O (in mass %, henceforth denoted as Zry-0.2Nb) sheet of 0.64mm thickness was used in the present study. Recrystallization annealing of Zry-0.2Nb at 973K for about 4 hours yielded an average grain size of ~8m. Tensile specimens were machined from the recrystallized sheets both in the RD and along an angle of 45o to the RD in the sheet plane.
Crystallographic texture was determined using X-ray diffraction by carrying out experiments on three samples in ND, RD and TD orientations. Texture coefficients (TC) were evaluated, and the corresponding inverse pole figures were constructed. Kearns’ f-factors were determined following procedures described elsewhere [5,6]. Basal (00.2), Prism (10.0) and Pyramidal (10.2) direct pole figures were evaluated using appropriate techniques on various specimens with normals along RD, TD and ND to get a complete description of the pole density [2,6].
Load relaxation tests were performed at a constant cross-head speed which corresponded to a strain rate of 1.9510-5s-1 at various temperatures starting from 298 to 876K by first loading to a given strain at which the cross-head was stopped while monitoring the load decrease with time. After the rate of load decrease got reduced, the specimen was reloaded close to the maximum load (tensile strength) at which relaxation behavior was again monitored. True strain rates and true stresses are calculated using Lee-Hart method [7] as outlined by Murty & McDonald [8].
Results and Discussion
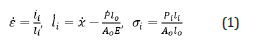
Figure 1:A typical load relaxation curve.

where the subscript ‘i’ represents the instantaneous values and o stands for initial values of length (l) and area (A), x is the cross-head displacement, E the effective elastic modulus and the dots represent the rate (as a function of time) of the corresponding variables. The load vs. time data from load relaxation tests were collected on a computer and appropriate algorithms were developed to evaluate the applicable data from the tensile and relaxation portion of the test. The effective modulus was calculated from the loading portions of the tensile tests. A typical load relaxation curve is shown in Figure 1. The stress variation of rate of stress-decrease during load relaxation can be used to evaluate the stress dependence of the strain-rate at essentially constant structure [7,8].
Figure 2:Inverse pole figures for Zry-0.2Nb alloy in three specimen directions (ND, TD and RD).

The TC values and Kearns’ f-factors determined from the inverse pole figure data are summarized in Table 1. Higher the TC value, higher is the concentration of planes aligned along the sheet orientation of interest. Generally, f-factors are used to represent the effective fraction of basal poles oriented in particular orientation. An f-factor of 0.333 is obtained in all three reference directions for a perfectly random sample. It clearly shows that the alloy sheets used in this study possess strong texture that may influence deformation anisotropy. Texture coefficients were used to construct inverse pole figures shown in Figure 2.
Table 1:Texture coefficients and f-factors.

The direct pole figures for basal (00.2), prismatic (10.0) and pyramidal planes (10.2) are shown in Figure 3. The textural characteristics observed in Zry-0.2Nb are typical of Zircaloys. For example, basal pole density is concentrated around the ND at an angle of ~25-30o towards TD. The prismatic poles are mostly aligned toward the RD. The pyramidal pole figure for Zry-0.2Nb also shows a bi-modal pole distribution in the ND-TD plane with the peak pole intensity appearing at about 57o. This type of behavior is different from those of Zircaloys [2], which may be a result of the Nb addition.
Figure 3: Direct pole figures of basal, prismatic and pyramidal planes for Zry-0.2Nb alloy.

The general form of the constitutive equation used for describing high temperature deformation behavior is expressed by
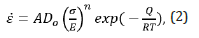
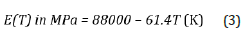
where σ is the applied stress, n the stress exponent, E the elastic modulus, Do the appropriate pre-exponential factor of diffusivity, Q the activation energy for creep, T the temperature in K, R the universal gas constant and A a constant which does depend on the mechanism and material parameters. Here the following equation was used to account for the temperature-dependence of elastic modulus [9,10]:
In Figure 4a, the variation of strain rates is shown as a function of modulus-compensated stress for Zry-0.2Nb alloy in RD for three temperatures, whereas in Figure 4b, a similar plot is shown in the direction 45o to RD. The slopes of the curves give the stress exponent values. In both figures, there appear three distinct regimes: n = 1 at the lower σ/E, n = 5 at the intermediate σ/E regime, and n = 7 at higher σ/E range.
Figure 4: Strain rate versus modulus-compensated stress plots for Zry-0.2Nb alloy along RD (a, left) and 45o to RD (b, right).

The region with n=1 coupled with the fine grain size of the Zry- 0.2Nb alloy appears to imply a deformation mechanism involving Coble diffusional creep, which follows the equation [1],
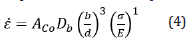
where ACo is the Coble constant, Db the boundary diffusivity, d the grain size, b the Burgers vector and all other terms have previously been defined. The data obtained in the n=1 region is compared with the standard model and found to correlate well with the model. However, the strain rate ratio between RD and RD-45o
The deformation regime with n = 3 is due to the viscous dislocation glide-controlled mechanism [11]. This regime generally appears due to the solute locking of dislocations in class A alloys. It has been noted elsewhere that Nb solute atoms are responsible for the appearance of such a deformation regime since Zircaloy-4 (with no Nb) has not been found to exhibit it [1,4]. The creep-rate in this regime controlled by dislocation glide is given by [11],
samples remained close to 2.7.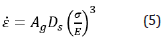
where Ag is a constant and Ds is the solute diffusivity (subscripts g and s stand for glide and solutes, respectively).
At the highest normalized stress region, n=7 was obtained. Generally, n=5 represents the regime of high temperature dislocation climb-controlled creep with an activation energy close to lattice diffusion activation energy [1,11]. At lower temperatures dislocation core diffusion dominates volume diffusion and low temperature dislocation climb mechanism becomes more relevant in which case a value of 7 (=5+2) is expected [11]. Indeed, the activation energy calculated in this n=7 high stress regime is ~160kJ/mol (as shown in Figure 5 for Zry-0.2Nb in RD), which is ~0.6 times the activation energy for lattice self-diffusion in Zr (272kJ/mol) [10].
Figure 5: Activation energy measurement.

Thus, the relevant constitutive equation is given by
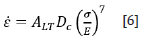
where ALT is a constant and Dc is dislocation core diffusivity.
For direct evaluation of the deformation anisotropy, stress relaxation tests at similar temperatures were carried out for the alloy in two orientations. The results are depicted in Figure 6. The strain rate ratio, are shown in Figure 7 and we note values for n to be 2.7, 3.7 and 20.0 in the n=1, n=3 and n=7 regimes respectively. Therefore, we note that the anisotropy is largest in n=7 regime than in n=1 and n=3 regimes. It is well known that dislocations glide on prismatic planes in zirconium. In the current alloy, Nb addition appears to strengthen texture more. Therefore, low temperature dislocation climb controlled process involves material flow along those planes. It may explain the reason for higher anisotropy in the n = 7 regime.
Figure 6: Double logarithmic plot of strain rate vs. stress for Zry-0.2Nb sheet along RD and 45o from RD.

Figure 7: The strain rate ratio as a function of normalized stresses.

It is generally expected that in the diffusional creep regime textures may not have a strong influence since the slip is presumably absent. Hence, at lower n values, the deformation tends to be essentially isotropic. Interestingly, the viscous glide regime (n=3) shows moderate anisotropy even though it involves dislocation slip. It may be related to a more homogenizing deformation effect during the operation of this kind of deformation mechanism which is generally characterized by the presence of a homogeneous distribution of dislocations in the crept matrix [12]. It is interesting to note that creep models incorporated with Crystallite Orientation Distribution Functions (CODFs) do predict close to isotropy for viscous deformation with n=1 [13]. Current relaxation results do depict the fact that degree of anisotropy decreases as the stress exponent, n, decreases (Figure 7).
Summary and Conclusions
Deformation mechanisms were investigated in a Nb added Zralloy plate along the Rolling Direction (RD) and 45o from RD using load relaxation at temperatures from 298 to 876K. Three regions were identified with Coble creep at low stresses, dislocation glide as in alloy class at intermediate stresses and low temperature dislocation climb at high stresses. Deformation anisotropy characterized in terms of strain rate ratio along 45o and RD was found to decrease with decrease in n value. These results have significant implications for radiation creep which is expected to be viscous [14].
Acknowledgement
We acknowledge the financial support of the National Science Foundation grant CMMI1727237.
References
- Adamson RB, Rudling P (2013) Properties of Zirconium alloys and their applications in Light Water Reactors (LWRs). In: ‘Materials’ ageing and degradation in light water reactors: Mechanisms and management, Murty KL (Ed.), Wiley, pp. 151-245.
- Murty KL and Charit I (2006) Texture development and anisotropic deformation of zircaloys. Progress in Nuclear Energy 48(4): 325-359.
- Murty KL and Ravi J (1995) Transitions in creep mechanisms and creep anisotropy in Zr-1Nb-1Sn-0.2Fe. Nuc Eng Des 156(3): 359-371.
- Murty KL, Dentel G, Britt J (2005) Effects of temperature on transitional mechanisms in Class-A alloys. Mater Sci Eng A 410-411: 28-31.
- Kearns JJ (1965) Thermal expansion and preferred orientation in zircaloy, Bettis atomic power laboratory. Report WAPD-TM-472.
- Mahmood ST Anisotropic plastic deformation, formability, and crystallographic texture of Zircaloy-4 Sheet, Ph.D. Dissertation, North Carolina State University, Raleigh, NC, USA.
- Lee D, Hart EW (1970) Metallurgical Transactions. 1: 2323.
- Murty KL, McDonald SG (1981) Tensile, creep and relaxation characteristics of zircaloy cladding at 385o SMiRT-6 Transactions, Paper # C3/2.
- Murty KL, Clevinger GS, Papazoglou TP (1977) Thermal creep of Zircaloy-4 cladding. Proceedings of the 4th International Conference on structural mechanics in reactor technology paper C3/4.
- Lyashenko VS, Bykov VN, Pavlinov LV (1959) Study of self-diffusion in zirconium and its alloys with tin. Physics of Metals and Metallography 8: 40.
- Murty KL, Mohamed FA, Dorn JE (1972) Viscous glide, dislocation climb and newtonian viscous deformation mechanisms of high temperature creep in Al-3Mg. Acta Met 20(8): 1009-1018.
- Langdon TG (1985) Dislocations and creep. Proceedings of Dislocations and Real Properties of Materials, Inst of Materials, London, UK, p. 221.
- Murty KL (2000) Deformation mechanisms and transients in creep of zircaloys: applications to nuclear technology. Trans IIM 53(3): 107-120.
- Murty KL (1989) Applications of crystallographic textures of zirconium alloys in nuclear industry. Zirconium in the Nuclear Industry: Eighth Symposium, ASTM STP 1023: 570-595.
© 2022 Murty KL. This is an open access article distributed under the terms of the Creative Commons Attribution License , which permits unrestricted use, distribution, and build upon your work non-commercially.
Editor In Chief


.jpg)


Signup for Newsletter

Quick Links
 Editorial Board Registrations
 Submit your Article
 Refer a Friend
 Advertise With Us
Our Recent Edition

.jpg)


Top Editors


.jpg)


.bmp)
.jpg)
.png)
.jpg)


.jpg)


.png)

.png)


.png)


Financial Support

Sponsors

Latest e-Books

Latest Video

 a Creative Commons Attribution 4.0 International License. Based on a work at www.crimsonpublishers.com.
Best viewed in
a Creative Commons Attribution 4.0 International License. Based on a work at www.crimsonpublishers.com.
Best viewed in