- Submissions

Full Text
Evolutions in Mechanical Engineering
Examination of Tensile Test Specimens Produced in Three-Dimensional Printer
Fuat Kartal*
Department of Mechanical Engineering, University of Kastamonu, Turkey
*Corresponding author:Fuat Kartal, Department of Mechanical Engineering, University of Kastamonu, Turkey
Submission: August 29, 2018;Published: October 24, 2018

ISSN 2640-9690 Volume1 Issue5
Abstract
In this study, the effect of different parameters on tensile test specimens produced by joint manufacturing with open source code and equipment using PLA type filament was investigated experimentally. Tensile specimens were designed and manufactured according to ASTM IV type tensile test standards. The test design was based on the L9 orthogonal array of the Taguchi Method and experiments was designed according to this plan. According to the results, Parameters of layer thickness and filling scan range parameters were found to provide significant improvement in the tensile strength increase.
Keywords:Fused deposition modeling; Additive manufacturing; Layered manufacturing; Parametric optimization; Tensile test
Introduction
Fused Deposition Modeling (FDM) is a popular prototyping technology that is a widely used for creating complex geometric functional parts in industry [1,2]. The FDM process involves applications ranging from prototypes to functional parts. There are five simple steps used in FDM. These steps are the creation of the CAD model, the conversion of the CAD model into the STL format, the thin layer division of the STL format, the creation of the layer structure on the layer and cleaning and finishing [3,4]. In most of the functional application processes of parts, the FDM dimension accuracy, surface roughness and the strength of the parts are considered important parameters. In addition, manufacturing settings play a key economic role [1-3]. Nevertheless, it is very difficult to obtain the best properties in molded parts without regard to the effects of process variables. Therefore, it is essential to optimize the process parameters to achieve the desired quality characteristics in the parts developed with the FDM process [3,4]. The process parameters examined the effect on the dimensional accuracy of the parts manufactured using the modeling process and reported that the placement angle directly affects repeatability and strength of the FDM parts [5-7]. There are studies examining the effect of layer thickness, piece creation orientation angle, raster angle, the raster and the raster spacing and the raster width each affect the three levels and the interaction of all other factors with the direction of parting orientation [8,9]. In another study, experimental design technique has been investigated to find the optimum surface finishing and dimensional accuracy of a part constructed by fused deposition modeling. The effects of layer thickness, road width, raster angle and surface finishing of the air gap and the dimensional accuracy of FDM parts have been investigated [8-10]. The purpose of this work is to investigate the effect of layer thickness, filling range and filling rate parameters on tensile strength of tensile specimens produced by joint fabrication of open source code and equipment using a Polylactic Acid (PLA) type filament.
Material and Method
Table 1:Process parameters and levels.
Table 2:Taguchi L9 Orthogonal experimental setup.
The Taguchi method is a widely accepted technique that provides an efficient method for design optimization. It is widely used worldwide for product design and process optimization. This makes it possible to simplify the test plan and examine the interaction between the various process parameters. This method is crucial for rapid prototyping where the cost of first production is high. Taguchi proposes an orthogonal array test scheme that gives combinations and levels of different parameters for each experiment. In this study, the Taguchi method was used to investigate the effects of three important parameters such as layer height, part placement position, filling ratio on the process (Figure 1). For this purpose, in Table 1 & 2, layer height, part placement position and inner filling ratio are given as 3 levels.
Figure 1:Process input and output parameters
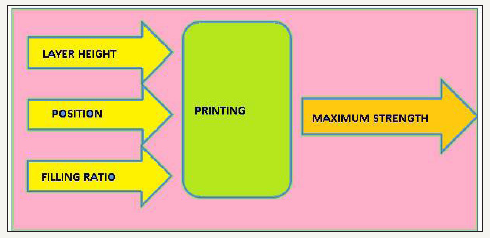
Figure 2:Display of layer height
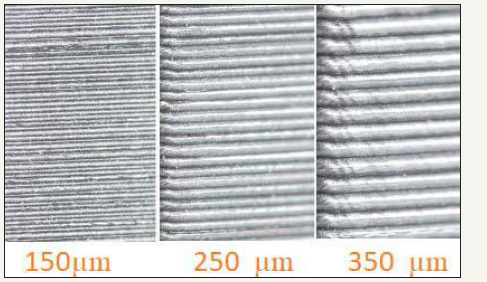
Figure 3:Printing positions of tensile test specimens.
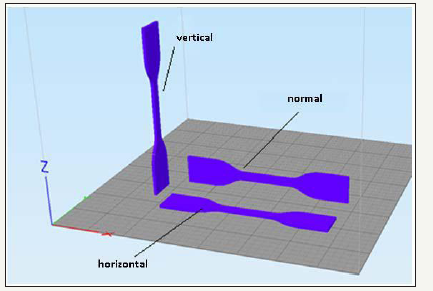
The height of the layer considered as the height of the melt layer emerging from the nozzle is shown in Figure 2. How to position the part in the heating tray of the three-dimensional printer is defined as shown in Figure 3.
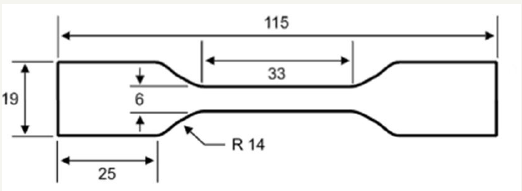
Figure 4 the parts to be manufactured were modeled using SolidWorks modeling software and exported as STL files. The STL file was transferred to the FDM Repiter-host software and the parts were manufactured using PLA filament in a 3D printer named Dream Maker with an open-source 0.4-micron nozzle diameter. The tensile test as shown in Figure 5 was performed using a tensile tester of 20 tons of rectangular sheet bar specimen according to ASTM.
Figure 4:Display of internal filling ratio in parts.
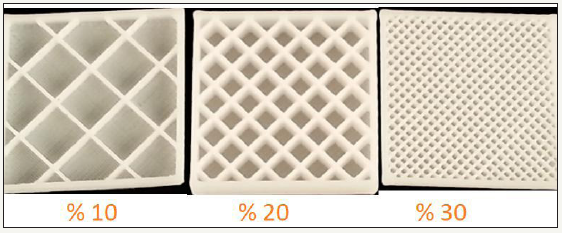
Figure 5:ASTM IV tensile test sample readings.
Findings and Discussions
Figure 6 shows an image of the samples at the end of the tensile test. The graph showing the maximum draw values of the samples prepared according to the Taguchi L9 test scheme is shown in Figure 7. The highest tensile strength values obtained according to tensile values are shown in Table 3. The maximum tensile stress value according to Figure 7 and Table 3 is obtained by printing in the horizontal and normal positions. It can be said that the spreading of the layers over a wider surface and the formation of a wider connection surface of the plastic melt layers have caused this situation. It was also found that the orientation between the polylactic acid molecules during the sample placement phase and during the sample preparation phase and during the drawing process increased and interactions between the molecules increased in the course of this orientation. As a result, it can be said that intermolecular interactions increase and an increase in tensile strain occurs.
Figure 6:Appearance of test pieces after tensile test.
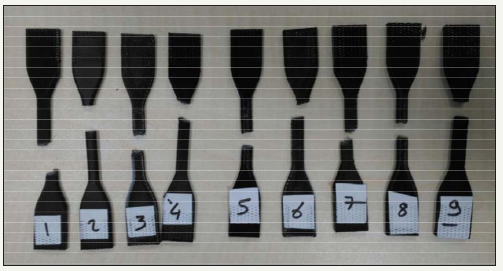
Table 3:Parameter values and corresponding maximum tensile stress values.
Figure 7:Tensile strain graph of tensile test specimens.

S/N ratio and verification experiment
Figure 8:Main effects graph of parameters.

The Taguchi technique uses a loss function to calculate the deviation between the experimental value and the desired value. Then the function is converted to the signal-noise ratio. Taguchi’s philosophy includes three general ways of assessing the relationship between quality and variability. They are; nominal-thebest, larger-the-better, and smaller the better. In the present work, larger-the-better is selected for the maximum tensile stress. Figure 8 shows the main effects for maximum tensile strength. Based on the analysis of the S/N ratio, the most suitable process parameters to achieve greater tensile strength were obtained as 350μm layer thickness, normal print position and 10% fill ratio.
Verification experiments have been performed to confirm the performance of the optimal process parameters. The response characteristics obtained for each optimum condition are shown in Table 4. After setting the initial parameters of the process parameters and adjusting the parameters to the optimized values, the ultimate tensile strength determined was 61.55 MPa.
Table 4:Verification experiment result and comparison.

Conclusion
The process parameters are optimized for fused deposition modeling Taguchi’s L9 orthogonal array. After setting the initial parameters of the process parameters and adjusting the parameters to the optimized values, the ultimate tensile strength determined was 61.55MPa. According to the verification experiments, the system could be modeled with a deviation of 2% and the system was found to be highly reliable.
Acknowledgment
The author would like to thank Kastamonu University Faculty of Engineering Dean for their material and spiritual support for their laboratory activities.
References
- Omar MA, Masood SH, Bhowmik JL (2015) Optimization of fused deposition modeling process parameters: a review of current research and prospects. Advances in Manufacturing 3(1): 42-53.
- Ahn SH, Montero M, Odell D, Roundy S, Wright PK (2002) Anisotropic material properties of fused deposition modeling ABS. Rapid prototyping journal 8(4): 248-257.
- Hutmacher DW, Schantz T, Zein I, Kee WN, Teoh SH, et al. (2001) Mechanical properties and cell cultural response of polycaprolactone scaffolds designed and fabricated via fused deposition modeling. Journal of Biomedical Materials Research Part A55, 55(2): 203-216.
- Bellini A, Selçuk G (2003) Mechanical characterization of parts fabricated using fused deposition modeling. Rapid Prototyping Journal 9(4): 252-264.
- Sood AK, Raj KO, Siba SM (2010) Parametric appraisal of mechanical property of fused deposition modelling processed parts. Materials & Design 31(1): 287-295.
- Lee CS, Kim SG, Kim HJ, Ahn SH (2007) Measurement of anisotropic compressive strength of rapid prototyping parts. Journal of materials processing technology 187: 627-630.
- Sood AK, Ohdar RK, Siba SM (2009) Improving dimensional accuracy of fused deposition modelling processed part using grey Taguchi method. Materials & Design 30(10): 4243-4252.
- Nikzad M, Masood SH, Sbarski I (2011) Thermo-mechanical properties of highly filled polymeric composites for fused deposition modeling. Materials & Design 32(6): 3448-3456.
- Constance Z, Sharma M, Ziemian S (2012) Anisotropic mechanical properties of ABS parts fabricated by fused deposition modelling. In Mechanical engineering. In Tech.
- Michael M, Roundy S, Odell D, Sung-Hoon A, Wright PK (2001) Material characterization of fused deposition modeling (FDM) ABS by designed experiments. Society of Manufacturing Engineers 10: 13552540210441166.
© 2018 Fuat Kartal. This is an open access article distributed under the terms of the Creative Commons Attribution License , which permits unrestricted use, distribution, and build upon your work non-commercially.
 a Creative Commons Attribution 4.0 International License. Based on a work at www.crimsonpublishers.com.
Best viewed in


.jpg)


 Editorial Board Registrations
 Submit your Article
 Refer a Friend
 Advertise With Us
.jpg)


.jpg)


.bmp)
.jpg)
.png)
.jpg)


.jpg)


.png)

.png)


.png)


