- Submissions

Full Text
Examines in Marine Biology & Oceanography
Seasonal Migration Characteristics of Pollutants in Daya Bay: A Case Study in 2015 Based on Observations
Liru Lin1,2* and Changjian Liu3
1Xiamen Ocean Vocational College, China
2Xiamen Key Laboratory of Intelligent Fishery, China
3South China Sea Survey Center, Ministry of Natural Resources, China
*Corresponding author: Liru Lin, Xiamen Ocean Vocational College, 4566 Hongzhong Avenue, Xiang’an District, Xiamen, 361100, Fujian Province, China
Submission: January 3, 2024;Published: January 31, 2024

ISSN 2578-031X Volume6 Issue4
Abstract
The coastal area of Daya Bay (DYB) is home to important petrochemical industry bases and nuclear power plants in South China. Understanding the water transport and pollutant migration paths in DYB is crucial for ensuring the marine environment and ecological safety of this region. With the synergy of several water quality surveys and ocean current observations, this study investigates the seasonal migration characteristics of pollutants in DYB in 2015. The results show good consistency between the spreading paths of pollutants indicated by the Chemical Oxygen Demand (COD) concentrations and the spatial patterns of residual currents in August and November 2015. Specifically, the residual currents in August 2015 exhibit a cyclonic circulation pattern, corresponding to the counterclockwise expansion of three high COD centers within the DYB. By November 2015, the residual currents weaken significantly and exhibit a slightly anticyclonic pattern, and the simultaneous COD concentration tends to extend clockwise. The anticyclonic residual circulation strengthens in January and may remain until the spring season, resulting in a clockwise expansion of high COD waters in May. The pollutant migration characteristics in winter and spring still require further clarification due to the lack of synchronous observations during these seasons. These observations provide valuable references for numerical simulations and predictions of pollutant migrations in DYB.
Keywords:Daya Bay; Pollutant migration paths; Residual current; Chemical oxygen demand
Introduction
Daya Bay (DYB) is the largest semi-enclosed bay extending inland along the coast of southern China (Figure 1), surrounded by mountains on three sides and connecting with the South China Sea (SCS) to the south. It is a large mountainous submarine valley bay embedded in the land from south to north, resembling a trumpet shape, with a length of approximately 30km from south to north and a width of about 15km at the bay mouth. DYB hosts several minor coves, such as Fanhe Cove, Yalin Cove, and Dapeng’ao Cove, along with a chain of islands distributed in a north-south direction. Twelve seasonal rivers flow into the bay, but the river discharges into the sea are mostly small. The main runoff input comes from the Dan’ao River in the northwest of the bay, which accounts for about 50% of the total runoff in both dry and wet seasons.
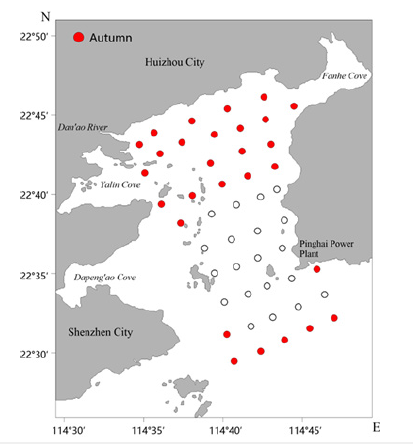
Figure 1:Observation stations of water quality in DYB. All stations were observed during spring and summer surveys, and red dots represent the stations observed during autumn survey.
Since 1983, DYB has been designated as a provincial-level nature reserve for aquatic resources, serving as a habitat for various marine species, including endangered ones like sea turtles [1]. In recent decades, however, coastal human activities, especially the increase in coastal population and industrial development, have led to an escalation in pollutant discharge into DYB. Studies have shown significant changes in nutrient levels and phytoplankton communities, with occurrences of algal blooms [2-4]. Additionally, DYB is an area requiring marine disaster risk assessment, with two nuclear power stations on its west coast and a petrochemical industrial park on its north coast. Given the lessons learned from the 2010 Gulf of Mexico oil spill and the 2011 Fukushima nuclear power plant accident, understanding the migration paths of marine pollutants is of great significance for protecting the marine ecosystem and mitigating social and economic losses [5,6].
Some previous studies have investigated the movement characteristics of marine pollutants in DYB. Zhang et al. [7] carried out tracer field experiments in DYB, and the observation-based estimations showed that the diffusion coefficient of pollutants was much larger in the meridional direction than in the zonal direction. Through model experiments, Ge et al. [8] investigated the potential distributions of oil films in the DYB after different oil spill amounts. But the simulation time only lasted for 24 hours, which was probably not able to reflect the long-term dispersion trend of pollutants. Liu et al. [9] and Wang et al. [10] used numerical simulations to compare the water exchange capacities in different areas of DYB, and both reached similar conclusions: the south is better than the north, the east is better than the west, and small coves are inferior to larger ones. However, these studies did not elucidate the paths of pollutant migration and dispersion.
Gan et al. [11] simulated the seasonal distributions of Chemical Oxygen Demand (COD) in DYB based on generalized simulation of pollution source investigation data but lacked extensive field data to validate the simulation results. Furthermore, most of these numerical models only used sea level as the open boundary condition and did not consider important influencing factors such as coastal currents and shelf upwelling that are crucial for water exchange within DYB. A recent study by Zhang et al. [12] used a nested model to comprehensively investigate the possible influencing factors of water exchanges between DYB and SCS, and emphasized the essential roles of offshore shelf circulation and local wind fields. Moreover, different from the above-mentioned earlier simulation results, the water exchange rate simulated by this model is roughly the same in the eastern and western DYB, which appears to be more consistent with the estimations based on in-situ observational data in the 1980s [13].
Overall, there are significant differences in numerical simulation results regarding the pollutant migration in DYB, emphasizing the need for more observational data to validate its characteristics in this region. In fact, there have been some observation-based research works on the water quality of DYB [2,14-18]. However, the data used in most of these studies are a collection of observations at different locations and times in the bay, lacking the synchronous observations in the whole DYB. Besides, there are also some observations on the characteristics of ocean currents in DYB [19-22], but the correlation between ocean currents and pollutant migration paths in different seasons has not been well explored. This paper addresses the aforementioned gaps by analyzing the migration characteristics of pollutants in DYB based on comprehensive observational data, including water quality and ocean currents, with a focus on different seasons. The results can provide valuable information for improving the accuracy of numerical simulations and predictions of pollutant dispersion in DYB.
Data Sources
The water quality data used in this study came from three surveys executed in DYB by the South China Sea Fisheries Research Institute of the Chinese Academy of Fishery Sciences. The observation times were spring (May 2015), summer (August 2015), and autumn (November 2015), respectively. The spring and summer surveys included 48 water quality stations (Figure 1), covering the main area of DYB but excluding some adjacent minor coves. The autumn survey included 24 stations, covering only the northern and southern parts of DYB. In all these surveys, water samples were collected using 5L organic glass water samplers at surface (0.25- 0.5m below the sea surface) and bottom (1m above the sea bottom) layers. Some water quality parameters (such as COD, Inorganic nitrogen, phosphate) were obtained in the laboratory by analyzing these water samples. In addition, temperature, salinity, pH, and dissolved oxygen at sea surface and bottom layers were measured on-site using a YSI 556 MPS multiparameter water quality meter. This study focuses on the spatial distributions of COD, which is a conventional pollutant in DYB, with a relatively stable source and emission pattern. The COD distribution characteristics after entering the sea is primarily influenced by the physical migration and diffusion, and thus it has been widely used as a typical water quality indicator to study the migration features of pollutants in rivers and oceans [11,23,24]. In this study, the COD concentration in the DYB water sample is determined based on the oxidizable compound’s stoichiometric reaction with oxygen to produce CO2, H2O, and NH3.
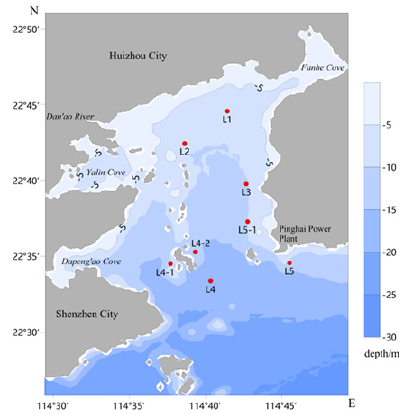
The ocean current data used in this study were obtained from four surveys conducted by the South China Sea Survey Center of the Chinese Ministry of Natural Resources. Ocean current measurements were conducted synchronously at 5 stations (see Figure 2) using the Aanderaa SeaGuard Recording Current Meter, a type of single-point Doppler current meter with high accuracy in both flow speed (0.5cm/s) and direction (±5 °). The observation periods were in June 2015, August 2015, November 2015, and January 2016. Observations were carried out hourly for 26 consecutive hours during the spring tide of each month. In June and August 2015, the specific locations of observational stations were L1 (114°41.43′E, 22°44.56′N), L2 (114°38.63′E, 22°42.43′N), L3 (114°42.67′E, 22°39.77′N), L4 (114°40.33′E, 22°33.36′N), and L5 (114°45.51′E, 22°34.57′N). In November 2015, L4 and L5 stations were relocated to L4-1 (114°37.69′E, 22°34.50′N) and L5-1 (114°42.77′E, 22°37.28′N), respectively; in January 2016, L4 station was relocated to L4-2 (114°39.32′E, 22°35.28′N). At each station, flow velocity was sequentially observed at bottom, 0.6H, and surface layers (H represents the local water depth), the sampling duration for each layer was 3 minutes.
Figure 2:Bathymetry and observational stations of ocean current in DYB. Note that in the survey in November 2015, the locations of L4 and L5 stations were adjusted to L4-1 and L5-1, respectively; in the survey in January 2016, the location of L4 station was adjusted to L4-2..
Results
Characteristics of COD distribution
Figure 3 shows the spatial distributions of COD concentration within DYB in May, August, and November 2015. There are three relatively obvious high COD centers in the observational region, located to the east of Dan’ao River and Yalin Cove, to the southwest of Fanhe Cove, and to the west of Pinghai Power Plant located on the east coast of the bay mouth, respectively. During spring (May 2015), the overall COD concentration in DYB is relatively low, with a maximum value of 1.41mg/L and an average value of 0.69±0.25mg/L. At this time, the spreading of pollutants generally shows a clockwise pattern (Figure 3a). Specifically, the high COD water east of Yalin Cove shows an eastward spreading tendency. At the same time, the high COD water on the west side of Pinghai Power Plant shows a trend of spreading southwestward toward the open ocean. In addition, seawater with relatively high COD concentration on the southwest part of the bay mouth also show a northward invasion along the west coast toward the bay interior.
Figure 3:Spatial distributions of COD concentration (unit: mg/L): (a) May 2015, (b) August 2015, (c) November 2015.
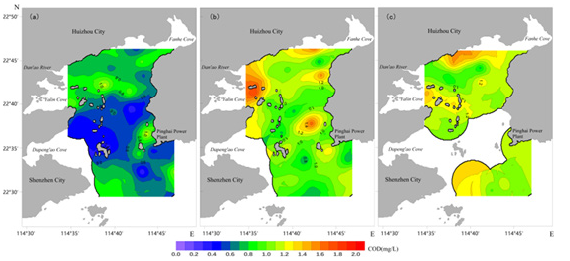
During summer (August 2015), the increase in river runoff during the wet season enhances the input of land-sourced pollutants, resulting in the overall increase in COD concentration within DYB, with a maximum value of 1.9mg/L and an average value of 1.09±0.31mg/L. At this time, the pollutants in DYB generally show a counterclockwise spreading tendency (Figure 3b). The high-concentration COD east of Yalin Cove shifts from eastward spreading in spring to southward migration in summer. Correspondingly, the high COD value originating from Fanhe Cove expands westward along the north coast, while the center of high COD concentration near Pinghai Power Plant moves northward. During autumn (November 2015), due to the accumulation of land-sourced pollutants in summer and the weakening of photosynthesis, the overall COD in the DYB remains at a relatively high level, with a maximum value of 1.54mg/L and an average value of 1.14±0.24mg/L. In spite of the lack of observational COD data in the central DYB, it can be seen from Figure 3(c) that the southward extension of high COD east of Yalin Cove during summer has weakened in autumn and turned to expand eastward to the bay interior. At the same time, the high COD concentration near the northern coast of DYB extends eastward to the vicinity of the outlet of Fanhe Cove. In addition, similar to spring, high COD water in the southwest of the bay mouth seems to advected northward by the coastal current. Generally speaking, COD in November tends to transport in a clockwise direction, but the tendency is much weaker than that in August.
Spatial patterns of residual current
It has been noted that the tidal current in DYB contains significant semidiurnal, quarter-diurnal and sexta-diurnal constituents [25]. Therefore, the harmonic analysis is applied in this study to extract the diurnal and semidiurnal tides, as well as their higher-frequency overtides, from the 26-hour time series of observed ocean currents. Then the residual current information at each station can be obtained by subtracting these main components of tidal current from the original ocean current time series. Its distribution characteristics are shown in Figure 4. Since the surrounding river discharge into the DYB is generally weak, the distribution of residual flow is mainly driven by other factors such as sea surface wind field, open ocean circulation, and tidal residual flow. Considering that the observation times of ocean current and COD are very close during their respective August and November surveys, we will focus on comparing the results in these two months. During June 2015, the residual currents at the surface, middle and bottom layers exhibit significantly different flow directions at all stations, but the overall flow pattern in the DYB is cyclonic (Figure 4a). Given that the spring COD distribution is observed in May 2015, the difference in sampling time substantially weakens the comparability between Figure 4a and Figure 3a. In fact, the residual current in June 2015 matches better the COD distribution in summertime (Figure 3b) rather than that in springtime (Figure 3a).
Figure 4:Residual currents observed in four surveys: (a) June 2015, (b) August 2015, (c) November 2015, (d) January 2016.
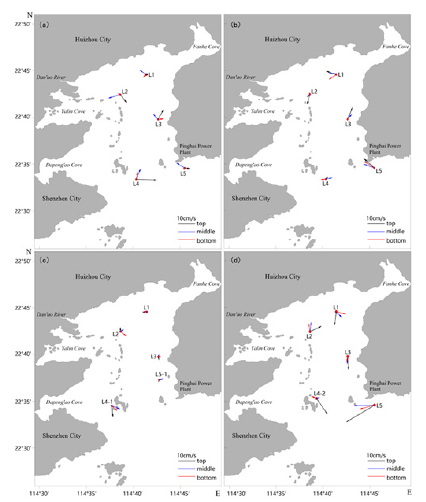
During the summer survey in August 2015, the flow directions at surface, middle and bottom layers show higher consistency than those in June 2015. The depth-averaged residual current velocities at five stations are 4.4cm/s on average, with the minimum residual current observed at L2 station (2.9cm/s) and the maximum at L5 station (7.1cm/s). The residual currents at the five stations generally exhibit a distinct cyclonic circulation pattern (Figure 4b), in good agreement with the counterclockwise COD expansion pattern (Figure 3b). For instance, the residual currents at L1 station are predominantly westward at all levels, and the nearby high COD water show consistent westward expansion (Figure 3b). These observational evidences suggest that cyclonic residual currents likely dominated the water and material transport in DYB in August 2015.
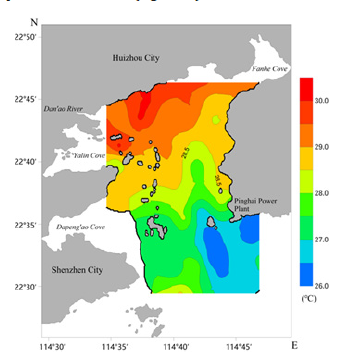
Sun et al. [22], in their observations of six stations in DYB in July 2018 (locations similar to the present study), reported lower residual flow speeds compared to this study and the absence of apparent flow patterns. This discrepancy may be attributed to the influence of Typhoon “Maria” during their observation period, which, as pointed out by Sun et al. [22], temporarily alters the direction of local prevailing southwest monsoon and weakens the coastal current in the northern SCS. In contrast, during the survey in August 2015, the prevailing southwest monsoon drives strong coastal upwelling over the northern SCS shelf, resulting in a sea surface cold center around the east side of the DYB mouth (Figure 5). This cold water mass show a tendency of northward intrusion into the eastern part of DYB, in consistency with the cyclonic residual flow pattern (Figure 4b) and the counterclockwise transport direction of COD (Figure 3b).
Figure 5:Spatial distribution of the sea surface temperature observed in August 2015.
During the autumn survey in November 2015, the residual currents exhibit overall weak velocities and do not display significant spatial configurations (Figure 4c). According to the residual current observations at stations L1 to L3, the prominent cyclonic circulation pattern in August appears to transform into a weaker and relatively ambiguous anticyclonic pattern during the November survey. Consequently, the high COD water east of Yalin Cove shifts from the southward expansion in summer (Figure 3b) to the eastward spreading in autumn (Figure 3c), consistent with the changes of residual flow at L2 station (Figure 4b-c).
During the winter survey in January 2016, the residual currents within the bay noticeably strengthen, exhibiting a more pronounced anticyclonic circulation pattern compared to the autumn. This pattern aligns well with the observations in the January 2018 survey reported by Sun et al. [22]. They attribute the flow enhancement to the strengthening of the northeast monsoon, which drives a strong southwestward coastal current to the south of DYB. Regulated by local topography and the Coriolis force, the coastal current enters the DYB from the southwest portion of the bay mouth, thereby inducing an anticyclonic residual flow field inside the DYB.
Discussion
Although no water quality observations are conducted in winter, it is inferred based on the residual flow pattern in January 2016 (Figure 4d) that COD near station L2 is likely to continue to spread northeastward during winter. After entering the winter dry season, the decrease of river runoff leads to the reduction of the land-sourced pollutants input into the DYB. The COD concentration in the DYB may continuously decrease in winter and thus reach a low value in spring (Figure 3a). At the same time, considering that before the onset of summer monsoon, the residual current in DYB may not have transformed to a summer cyclonic style, COD still shows a clockwise diffusion tendency in May under the cumulative influence of anticyclonic circulation in winter and spring (Figure 3a). Due to the lack of simultaneous observations on flow velocity and COD in winter and spring seasons, the above discussion on physical processes needs to be further confirmed.
In addition, it is worth mentioning that there are certain differences between the COD and residual flow patterns shown in this study and in the results of previous numerical simulations (such as Gan et al. [11]). First of all, Gan et al. [11] cannot reproduce the high COD concentration centers and their significant seasonal variability near the Fanhe Cove and Pinghai Power Plant. This is probably because the COD emission data used as the external forcing of the numerical model are not sufficient or accurate enough. Secondly, in their simulation, the pollutants are transported out of the bay during spring and summer, and transported into the bay during autumn and winter, which is inconsistent with the observational facts shown in this study and can probably be attributed to the model’s simulation bias in the SCS shelf circulation adjacent to DYB.
In general, the observational evidences shown in this study manifest the importance of residual flow for material transport in the DYB and confirms the conclusion of recent numerical simulation work, which suggests the dominant role of local wind and shelf circulation in modulating the water exchange between the DYB and the northern SCS shelf [12]. Due to limited observational data, the analysis of pollutant migration in this study is mainly a qualitative description on the phenomenon, lacking quantitative estimations on the detailed processes and mechanisms. Therefore, it is necessary to carry out more systematic in-situ observations in DYB to further refine the dynamic framework and improve the accuracy of model simulation on the DYB pollutant migrations.
Conclusion
This paper presents some cases on the seasonal migration characteristics of pollutants in DYB based on water quality surveys and ocean current observations. The results indicate the influence of residual currents on the spatial distributions of COD in August and November 2015, emphasizing the importance of considering dynamic oceanographic processes in understanding pollutant migrations. Specifically, during August 2015, the residual currents in DYB mainly show the characteristics of cyclonic circulation. Under the influence of oceanic advection, the cold surface water in the upwelling region southeast of the bay mouth intrudes northward into the bay interior, and the land-sourced pollutants inside the bay migrate counterclockwise. By November 2015, the overall residual flow in DYB decreases significantly, forming a weak anticyclonic flow field in the central bay; correspondingly, the COD concentration in the bay also shows a weak tendency of clockwise transport. It should be pointed out that due to the lack of simultaneous observations of COD and flow fields in winter and spring seasons, the characteristics and mechanisms of pollutant transports in these two seasons still need to be supported by more observational evidence. Overall, the large-scale, simultaneous in-situ observations in DYB are still far from sufficient, and there are certain discrepancies between observational and simulated results. Continuous monitoring of pollutant levels and ocean currents, coupled with numerical simulations, can enhance our understanding of the factors influencing pollutant migrations and thus contribute to the development of effective environmental management strategies in DYB.
Acknowledgments
We would like to express our gratitude to the South China Sea Fisheries Research Institute of the Chinese Academy of Fishery Sciences and the South China Sea Survey Center of the Chinese Ministry of Natural Resources for providing the data used in this study. We also thank the anonymous reviewers for their valuable comments. This study is funded by the National Natural Science Foundation of China (42006177).
References
- Chen ZZ, Xu SN, Qiu YS (2015) Using a food-web model to assess the trophic structure and energy flows in Daya Bay, China. Continental Shelf Research 111: 316-326.
- Wang YS, Lou ZP, Sun CC, Sun S (2008) Ecological environment changes in Daya Bay, China, from 1982 to 2004. Marine Pollution Bulletin 56(11): 1871-1879.
- Song XY, Huang LM, Zhang JL, Huang HH, Li T, et al. (2009) Harmful algal blooms (HABs) in Daya Bay, China: An in situ study of primary production and environmental impacts. Marine Pollution Bulletin 58(9): 1310-1318.
- Wu ML, Wang YS, Yin JP, Dong JD, Jiang ZY, et al. (2017) Scenarios of nutrient alterations and responses of phytoplankton in a changing Daya Bay, South China. Journal of Marine Systems 165: 1-12.
- Olascoaga MJ, Beron-Vera FJ, Haller G, Triñanes J, Iskandarani M, et al. (2013) Drifter motion in the Gulf of Mexico constrained by altimetric Lagrangian coherent structures. Geophysical Research Letters 40(23): 6171-6175.
- Kamidaira, Y, Uchiyama Y, Kawamura H, Kobayashi T, Furuno A (2018) Submesoscale mixing on initial dilution of radionuclides released from the Fukushima Daiichi nuclear power plant. Journal of Geophysical Research: Oceans 123(4): 2808-2828.
- Zhang GX, Huang XP, Du WC, Zheng QH, He QX (1997) An experiment on pollutant diffusion of seawater in Daya bay and the calculation of its vortex diffusion coefficient. Tropic Oceanology 16(1): 89-94.
- Ge C, Chen MY, Zhu YZ, Zhang HQ, Xu P (2020) Numerical modeling of diffusion of leaked soluble hazardous chemicals in the Daya Bay, China. IOP Conference Series: Earth and Environmental Science 612: 1-15.
- Liu YX, Wen WY, Wang WJ (1999) A study on temporal-spatial diversity of marine physical self-purification in Daya Bay. Tropic Oceanology 18(4): 61-68.
- Wang C, Lin J, Chen PM, Zhang SY (2009) Numerical simulation of annual average wind’s impact on water exchange in Daya Bay. Journal of Shanghai Fisheries University 18(3): 351-358.
- Gan SD, Zhou CY, Zhang WH (2018) Numerical simulation of pollutant transportation and diffusion in Daya Bay. Pearl River 39(10): 44-52.
- Zhang H, Cheng WC, Chen YR, Shi Z, Gong WP, et al. (2019) Importance of large-scale coastal circulation on bay-shelf exchange and residence time in a subtropical embayment, the Northern South China Sea. Ocean and Coastal Management 168: 72-89.
- Han WY, Lin HY, Huang XN (1988) A study on water exchange in Daya Bay, Guangdong Province. Marine Science Bulletin 7(3): 1-6.
- Wen WY, He YQ, Zheng QH (1992) A study on the environment of Daya Bay. Tropic Oceanology 11(2): 25-30.
- Peng YH, Chen HR, Chen LD (1996) Hydrochemical features at sea areas of Dapeng’ao Bay in Daya Bay. Marine Science Bulletin 15(6): 27-34.
- Yuan GM, He GF (2012) Assessment of water environment quality and environmental capacity of Daya Bay. Journal of Oceanography in Taiwan Strait 31(4): 472-478.
- Yang WC, Huang DJ, Chen JX, Chen XY, Wang YS (2020) Spatio-temporal distribution and eutrophication assessment of nutrients in Daya Bay during 2009–2015. South China Fisheries Science 16(2): 54-61.
- Ma Y, Wang X, Xu X, Liu WY, Wang ZL, et al. (2023) Distributions characteristics of nutrients in sea water and its ecological environment effects in Daya Bay. Environmental Monitoring in China 39(6): 110-122.
- Xu JD, Zeng G (1991) Analysis of winter current fluctuation in Daya Bay. Journal of Oceanography in Taiwan Strait 10(1): 33-38.
- Yang GB (2001) Characteristics of tidal current in Daya Bay area. Pearl River 5(1): 30-32.
- Gao Y, Huang YX, Lin HY, Sun ZY, Zhu J, et al. (2020) Surface currents measured by GPS drifters in Daya Bay and along the eastern Guangdong coast. Acta Oceanologica Sinica 14(2): 376-383.
- Sun ZY, Chen ZZ, Yang LQ, Zhu J (2020) Seasonal variation of the tidal current and residual current in the Daya Bay and its surrounding area. Journal of Xiamen University 59(2): 278-286.
- Li N, Ye M (2011) COD diffusion simulation based on MIKE21 in sewage outfall of Peiling section of the Thred Gorges Reservoir Area and its impact on downstream water quality. Journal of North China Institute of Water Conservancy and Hydroelectric Power 32(1): 128-131.
- Tang JY, Shao MH, Tao P, Chen LJ, Wang T (2016) The further research on seawater exchange and diffusion ability of pollutant COD of Pulandian Bay in Dalian. Transactions of Oceanology and Limnology 1: 37-44.
- Song D, Yan Y, Wu W, Diao X, Ding Y, et al. (2016) Tidal distortion caused by the resonance of sexta-diurnal tides in a micromesotidal embayment. Journal of Geophysical Research: Oceans 121(10): 7599-7618.
© 2024 Liru Lin. This is an open access article distributed under the terms of the Creative Commons Attribution License , which permits unrestricted use, distribution, and build upon your work non-commercially.
 a Creative Commons Attribution 4.0 International License. Based on a work at www.crimsonpublishers.com.
Best viewed in


.jpg)


 Editorial Board Registrations
 Submit your Article
 Refer a Friend
 Advertise With Us
.jpg)


.jpg)


.bmp)
.jpg)
.png)
.jpg)


.jpg)


.png)

.png)


.png)


