- Submissions

Full Text
Examines in Marine Biology & Oceanography
The Seasonal Keeling Oscillation in Atmospheric pCO2 is Caused by Variation in Seawater Surface Temperature
Ivan R Kennedy*
School of Life and Environmental Sciences, University of Sydney, Australia
*Corresponding author: Ivan R Kennedy, School of Life and Environmental Sciences, University of Sydney, NSW 2006, Australia
Submission: October 25, 2023;Published: November 08, 2023

ISSN 2578-031X Volume6 Issue3
Introduction
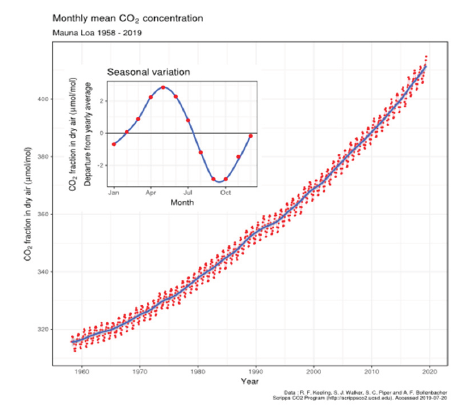
Charles Keeling surmised that the seasonal oscillation in the atmospheric CO2 observed on Mauna Loa shown in Figure 1 and at Point Barron in the arctic [1,2] resulted from seasonally unequal regional variations in photosynthesis and respiration [1]. Here, this assumption is reassessed.
Figure 1:The Keeling curve of atmospheric CO2 partial pressure at 3200m on Mauna Loa, Hawaii. Data from Dr. Pieter Tans, NOAA/ESRL and Dr. Ralph Keeling, Scripps Institution of Oceanography. CC BY-SA 4.0, https://commons.wikimedia.org/w/index.php?curid=40636957, accessed on 12 November 2022.

New data
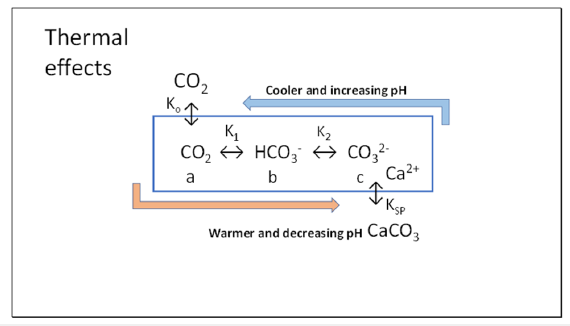
While this conclusion may be valid for Keeling’s early observations made on land in California, we have shown that variation of seasonal sea surface temperature is more likely the cause of this seasonal oscillation [3]. Equilibrium positions of the reactions of dissolved inorganic carbon of CO2, bicarbonate and carbonate leading to formation of precipitated calcite all shift towards carbonate and calcite formation (Figure 2) peaking in late summer in October and reversing in winter, with calcite being more soluble in colder seawater diminishing until May. The calcification process of calcite or aragonite formation thus favoured in warmer water in summer is usually suggested [4] to involve a chargeneutral stoichiometric reaction between Ca2+ ions and bicarbonate as follows in Equation (1).

Figure 2:Thermal model showing seasonal displacement of reactions of dissolved inorganic carbon in the mixing zone of seawater. Formation of carbonate and calcite is favoured in warmer seawater [3], with carbonate peaking in October whereas bicarbonate peaks in April at the latitude of Hawaii, where carbonate is minimal

This has the advantage of generating carbonic acid, raising [CO2] concentration and allowing photosynthesis to occur not possible directly from bicarbonate.
However, to explain the published ALOHA dataset [5], we concluded [3] that the stoichiometry of this process must occur as shown in Equation (2), emphasizing the close connection between inorganic and biological reactions involving seasonal cycling of CO2. It was also concluded that the Ψ factor [6] is a variable combining the range of the seasonal temperature variation affecting the extent of calcification as well as biological factors. An important factor is the acidification shown for summer reducing the pH value of the system in summer and therefore raising the fugacity for CO2 (fCO2). This explains the highest values of pCO2 recorded by equilibrating a large sample of seawater with an air bubble in summer when the pCO2 in air just above the surface as recorded by Chen et al. [7] in the ALOHA samples is lowest. Just when the seawater is warmest, this facilitates a rapid transfer of CO2 from seawater to air continuing until late winter as the pCO2 in air reaches its peak. While equilibrium between different forms of DIC in seawater should be rapid with changes as temperature changes, equilibrium between CO2 is highly transient.

It is the consumption of Ca2+ ions in this calcification process within organisms that causes acidification and the potential for generation of CO2 from bicarbonate preserving charge balance, thus made available for photosynthesis. Reaction (1) does not explain the increase in fugacity of CO2 in summer, which peaks as the pCO2 in air is least. The methods developed by Chen et al. [7] and Sutton et al. [8] include adjustments for variations in air humidity with temperature that vary pCO2. Standard methods for measuring CO2 involve analysis of dehydrated air, tending to overestimate its pressure particularly in summer. Their data [7] show that the fugacity of CO2 in seawater exceeds that in air in mid-summer when pCO2 in air is minimal, facilitating diffusion between the two phases at a maximum rate. Chen et al. [7] were more concerned with defining the rate of increase in seawater CO2 fugacity as the longer term trend in pCO2 in air shown in Figure 1 increases.
Key Factors
The key factors that contribute to the oscillation being caused
by emission and absorption of CO2 by the ocean surface, particularly
where there is a high range in seasonal temperature in the northern
hemisphere are several. These include:
i. Reactions in Figure 2 from CO2 to carbonate have been shown
as endothermic, absorbing heat in the conversion to calcite in
summer, in agreement with Le Chatelier’s principle tending to
reverse summer warming.
ii. Our modelling [3] based on algorithms of Emerson & Hedges [9]
showed that the magnitude of seasonal temperature variation
in seawater affects the extent of formation of carbonate and
calcite from bicarbonate in summer, or its diminution in winter
in the reverse reaction.
iii. The pH change in summer is towards acidification, raising the
fugacity of CO2 in seawater; as autumn and winter proceed,
the pH change is alkaline, as calcite and carbonate decline and
bicarbonate and [CO2] in solution increase in colder water,
consuming protons.
iv. To the extent allowed by nutrients particularly of nitrogen
and phosphate, photosynthesis is favoured by the calcification
reaction shown on the right-hand side of Reaction (2)..
We concluded [3] that explaining the extent of the oscillation requires a combination of seasonal inorganic and biological reactions and that the respective contributions of these two causes of carbon cycling probably varies locally. Even the contribution of biological factors assisting reaction rates such as extracellular carbonic anhydrase [10] needs assessment. In general, our conclusion that variation in seawater temperature is the fundamental cause of seasonal oscillation in the Keeling curve shown in Figure 1 is consistent with the global climatological distributions of pH, pCO2, total CO2, alkalinity, and CaCO3 saturation in the global surface ocean analysed by Takahashi et al. [11].
Conclusion
The ALOHA dataset between 1990 and 2009 [5] has been used to show that the pH of the ocean surface water is declining as the Keeling curve for increasing pCO2 from anthropogenic sources increases. For every change of pH of 0.01 units, pCO2 increases almost 10ppmv. In the modern era since 1750, pH values have probably declined about 0.15 units, while the pCO2 in the global atmosphere has increased about 140ppmv. Every square meter of the Earth’s surface now has about 140 moles of CO2 above it in the troposphere. We are also investigating the extent to which increases of atmospheric CO2 are caused by declining pH values on land surfaces as a result of significant acidification by export of alkaline agricultural produce [5] and the application of excess reduced nitrogen fertilisers, tending to form nitric acid. This has not been considered significant by the IPCC panels as a source compared to emission from fossil fuels. However, we claim that acidification releases stoichiometric quantities of CO2, particularly from neutral or mildly alkaline soils with high levels of bicarbonate (HCO3-) and the scale of this source must be determined if the pCO2 trend in Figure 1 is to be mitigated.
References
- Keeling CD (1970) Is carbon dioxide from fossil fuel changing man’s environment? Proc Amer Philosoph Soc 114(1): 10-17.
- Keeling CD, Wahlen TP, Wahlen M, Plicht J (1995) Interannual extremes in the rate of rise of atmospheric carbon dioxide since 1980. Nature 375: 666-670.
- Kennedy IR, Runcie JW, Zhang S, Ritchie RJ (2022) A new look at physico-chemical causes of changing climate: is the seasonal variation in seawater temperature a significant factor in establishing the partial pressure of carbon dioxide in the earth’s atmosphere? Thermo 2: 401-434.
- McConnaughey TA, Whelan JF (1997) Calcification generates protons for nutrient and bicarbonate uptake. Ear Sci Rev 42(1-2): 95-117.
- Dore JE, Lukas R, Sadler DW, Church MJ, Karl DM (2009) Physical and biogeochemical modulation of ocean acidification in the central North Pacific. PNAS USA 106(30): 12235-12240.
- Smith SV (2013) Parsing the oceanic calcium carbonate cycle: A net atmospheric carbon dioxide source, or a sink. In: Anderson RM (Ed.), Association Sciences Limnology and Oceanography (ASLO): Waco, L & O e-Books, USA, pp. 1-44.
- Chen S, Sutton AJ, Hu C (2021) Quantifying the atmospheric CO2 forcing effect on surface ocean pCO2 in the North Pacific subtropical gyre in the past two decades. Front Mar Sci 8: 636861.
- Sutton AJ, Sabine CL, Maenner-Jones S, Lawrence-Slavas N, Meinig C, et al. (2014) A high-frequency atmospheric and seawater pCO2 data set from 14 open-ocean sites using a moored autonomous system. Earth Syst Sci Data 6: 353-366.
- Emerson S, Hedges J (2008) Carbonate Chemistry. Chemical Oceanography and Marine Carbon Cycle, Cambridge University Press, UK, pp. 101-133.
- Mustaffa NIH, Latif MT, Wurl O (2021) The role of extracellular carbonic anhydrase in biogeochemical cycling: Recent advances and climate change responses. Int J Mol Sci 22(14): 7413.
- Takahashi T, Sutherland SC, Chipman DW, Goddard JG, Cheng H, et al. (2014) Climatological distributions of pH, pCO2, total CO2, alkalinity, and CaCO3 saturation in the global surface ocean, and temporal changes at selected locations. Mar Chem 164: 95-125.
© 2023 Ivan R Kennedy. This is an open access article distributed under the terms of the Creative Commons Attribution License , which permits unrestricted use, distribution, and build upon your work non-commercially.
 a Creative Commons Attribution 4.0 International License. Based on a work at www.crimsonpublishers.com.
Best viewed in


.jpg)


 Editorial Board Registrations
 Submit your Article
 Refer a Friend
 Advertise With Us
.jpg)


.jpg)


.bmp)
.jpg)
.png)
.jpg)


.jpg)


.png)

.png)


.png)


