
- About Us
- Information
-

The Author ensures that the research has been conducted responsibly and ethically with adherence to all relevant regulations. read more..
- For Authors
- For Reviewer
- Manuscript Guidelines
- Membership
- Publication Ethics
-
- Journals
- Reprints
- e-Books
- Videos
- Policies
- Contact Us
 COVID-19
- Submissions


Full Text
Examines in Marine Biology & Oceanography
Despoilation of Mangrove Wetland through Illegal Sand Mining Activity and its Effect on Phytoplankton Abundance in the Niger Delta, Nigeria
Uwana Fombo1, Emoyoma O Udi2 and Aroloye O Numbere3
1Institute of Natural Resources, Environment and Sustainable Development, Nigeria
2African Centre of Excellence for Public Health and Toxicological Research (ACE-PUTOR), Nigeria
3Department of Animal and Environmental Biology, Nigeria
*Corresponding author: Aroloye O Numbere, Institute of Natural Resources, Environment and Sustainable Development, Choba, Nigeria
Submission: October 14, 2022;Published: November 08, 2022

ISSN 2578-031X Volume5 Issue1
Abstract
Wetland areas in Abuloma, Ogbogoro and Eagle Island with evidence of sand mining operations were investigated for impacts of in-stream sand mining on the surface water quality, abundance, composition, and the diversity of phytoplankton. We thus, hypothesized that sand mining will impact phytoplankton abundance. The study lasted six, i.e., October 2020-March 2021. Physico-chemical parameters were assessed using standard procedures while plankton were sampled, identified, and classified employing appropriate techniques and identification keys. The results of water quality assessment shows temperature and pH to be within acceptable limit for tropical waters as recommended by WHO, while Dissolved Oxygen (DO), Biochemical Oxygen Demand (BOD), Total Dissolved Solids (TDS), and Electrical Conductivity (EC) (μS/cm) were not within acceptable limit as stipulated by WHO. Phytoplankton results shows that a total of 2,610 individuals from 4 taxa and 43 species were encountered. The family Bacilliarophyceae with 2,466 individuals, dominated while Charophyta with 24 individuals was the least encountered. The result implies that sand mining activities negatively impacted the water quality of the studied areas, which influenced the composition and abundance of phytoplankton populatio
Keywords:Benthic; Macro invertebrate; Sand mining; Phytoplankton; Andoni river; Mangrove forest
Abbreviations: DO: Dissolved Oxygen; BOD: Biochemical Oxygen Demand; TDS: Total Dissolved Solids; EC: Electrical Conductivity; CEMPOS: Centre for Marine Pollution and Seafood Safety; ANOVA: Analysis of Variance
Introduction
Wetland is one of the most productive coastal systems in the world because of its ecosystem services, buffering ability and filtration of waste from upland locations. It recharges the river, serve as site for aquaculture, erosion control and habitat for aquatic organisms. Seventy percent of the Niger Delta coast is surrounded by wetland and mangrove forest. But the wetland is facing threat from anthropogenic activities such as oil and gas exploration, coastal development project, dredging and sand mining etc., which renders the wetland and the adjoining rivers polluted and unproductive. In addition, increase in population growth increased the need for the provision of infrastructural development [1], which added more pressure to the already fragile ecosystem. Thus, to maintain rapid urbanization, several sand mining sites were established [2] at the detriment of environmental quality. Traditionally, sites for sand mining are rivers and beaches; though, sand is mined from river mouths, banks, and inland sand deposits. Several inland sand deposits, which are lateritic in nature, have been put under immense pressure by increased construction activities. The non-selective extraction of sand has been one of the most disastrous human activities on the stability of the coastal environment [3,4]. Sand and gravel excavation impact water resources such as fisheries, aesthetic and recreational functions, and the stability of the river channels [5].
The impact of sand mining activities on the environment is exhaustless. For instance, aquatic biota suffers and there is an increase in turbidity and TSS in habitat near downstream [6]. This variation in the water quality property directly affects benthic organisms such as crustaceans (shrimps, crabs, etc.), squids, fin fish, macro invertebrates and mollusc [7]. Mining particularly affects the eggs which are found at the bottom of river, stream, or seabed. Furthermore, aquatic organisms have the propensity to accumulate toxic or heavy metals arising from sediments in the sand dredging sites. There will be high mortality of benthic organisms which will either be dislodged or killed when the waterbed is excavated during sand mining [8]. Phytoplankton serves as natural food for various fishes and shrimps [9] inhabiting first producer level in energy flows. It is a primary producer that increases the dissolved oxygen in the aquatic environment, which is a peculiar life source for all animals [10]. In food chain, phytoplankton is eaten by herbivores (such as zooplankton) which in turn is consumed by larger carnivores (fish and others). Phytoplankton serve as an indicator of water quality [11], thus the larger the abundance the higher the water quality. Sand is a significant resource with vital roles in the global construction industry [12]. Sand mining has occurred when sand is removed from their natural settings [5]. Mining of sand in most parts of Nigeria is done at subsistence and commercial levels. According to report, due to Nigeria’s housing deficit estimated at around 16 million [13,14] and the increasing development of infrastructures, the need for sand alongside other construction materials will continue to be severe [15].
Physical disruption of the habitat caused by dredging activities
includes noise, which can interrupt nesting/breeding activities. It
can also have adverse effect on the totality of water property of the
aquatic environment as seen in the studies of [16]. Sand mining
also encourages loss of endemic species due to migration of these
species during sand excavation processes. The research aim was
to evaluate environmental impacts of sand mining on plankton
composition and diverseness in selected coastal areas around Port
Harcourt. The objectives are
i. To determine the impact of sand mining activities on
physico-chemical parameters of selected water bodies around Port
Harcourt.
ii. To estimate the effect of sand mining activities on
phytoplankton abundance and diversity in the study area.
Methodology
Study area
The study area is Port Harcourt, the administrative capital of Rivers State and the biggest city in the Niger Delta with more than 2 million inhabitants. Port Harcourt lies along the Bonny River. Port Harcourt lies between longitude 7°2’’E and latitude 4°48’N. The city is 9m above sea level and has a tropical wet climate. Rainfall is significant most month of the year with short dry season from December to February. The driest month is January with 58mm of rainfall while the heaviest precipitation occurs in September with average of 367mm of rain. The average temperature is usually between 25 °C – 28 °C. Three economically important coastal areas where there is an intensive in stream mining are Abuloma, Eagle Island and Ogbogoro. These areas are the study sites, which are described below:
Abuloma (Site 1): The first site is Abuloma lies between longitude 7°4’E and latitude 4°44’N while the study site was longitude 7°3’E and latitude 4°46’N (Figure 1). Abuloma is an economically important town in Port Harcourt surrounded by rivers linking the different communities like Ojimba-Ama, Kalio- Ama, Okujagu-Ama etc. Owing to the interconnection of these rivers and their efficient boat transportation system, it serves as a hub for multiple business ventures that are thriving. Rivers and creeks located in Abuloma are transportation medium for tugboats, barges, and houseboat. Asides water transportation of petroleum products including diesel, kerosene, and wood [17], there are a host of other household and municipal activities, but majorly sand mining does occur.
Figure 1:Map of study areas.Source: Geography Department, University of Port Harcourt, Rivers State, Nigeria.

Eagle island (Site 2): Eagle Island lies between longitude 6°58’E and latitude 4°46’N while the study location was between longitude 6°58’E and latitude 4°47’N (Figure 1). Eagle island, a town in Obio Akpor LGA of Rivers State is located behind the Rivers State University. The region has a warm and humid climate with two seasons, dry and wet season according to survey of [18]. It is around 1000m to the confluence of the Bonny and Rumoulumeni Rivers. There are diverse sources of anthropogenic activities (e.g., boat transportation) going in this region among, which is sand mining operation.
Ogbogoro (Site 3)Ogbogoro lies between longitude 6°55’E and latitude 4°50’N while the sampling station lies between longitude 6°55’E and latitude 4°50’N (Figure 2). Rumoke, widely known as Ogbogoro is a town in Obio-Akpor local government area. This area has a major river, with smaller interconnecting creeks where intensive sand mining activities is ongoing. The area is a choice sand mining zone because it has good sharp sand, which is often preferred by construction company [19].
Figure 2:Wetland areas impacted by sand mining activities in the Niger Delta: (a) Ogbogoro (b) Eagle Island and (c) Abuloma.

Assessment of physico-chemical parameters: The three different locations were sampled for six months (October 2020-March 2021). The following physico-chemical indices were determined in triplicate samples per site, namely water temperature, Electrical Conductivity (EC), Dissolved Oxygen (DO), pH, salinity, Total Dissolved Solids (TDS) and Biochemical Oxygen Demand (BOD). Water temperature was taken in-situ, while the remaining physico-chemical properties (i.e., DO, BOD, pH, TDS, EC, and salinity) were determined in the laboratory at the Centre for Marine Pollution and Seafood Safety (CEMPOS), University of Port Harcourt. The temperature was measured via a centigrade thermometer (0o to 50o) by inserting the thermometer into water for up to one minute before taking the readings. The dissolved oxygen (DO) was taken using a portable dissolved oxygen meter (JPB-607A analyzer by Xergy Inc.). This was done by dipping the sensitive point (probe) into the water after it has been calibrated and the reading was taken. The result was expressed in mg/l [20]. The pH was measured using a portable pH/EC/TDS Meter (HI-9810- 6 by Hanna instruments). The bulb end of the meter was rinsed with distilled water and then dipped into the water to determine the reading [21]. For the total dissolved solid and conductivity, a portable pH/EC/TDS Meter (HI-9810-6 by Hanna Instruments) was used to determine the measurements. The bulb end above meter was rinsed with distilled water before it was dipped into water respectively and when it stabilized, the reading was taken. TDS was expressed in mg/L while conductivity was expressed in parts per thousand (o/oo). To determine the Biochemical oxygen demand (BOD), water samples were collected in absence of air bubbles into dark bottles, which were kept in a place without light for 5 days [22]. The DO in sample was determined after the storing period and the difference between the initial and final DO was the BOD expressed in mg/L. Salinity was obtained using a portable Hanna Salinity Tester (H198318 by Hanna Instruments).
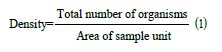
Analysis of diversity indices of study area:The number of each individual species or taxa was counted and recorded. The abundance and diversity of the benthic fauna were calculated (Equation 1)
Margalef’s Index (Equation 2) and Shannon-Wiener’s Index (Equation 3) were used to calculate diversity and Pielou’s Index of evenness (Equation 4) was also applied to compare relative density as shown below:

Where, D is the Species richness, S is the sum total of species, while N is the over-all number of organisms. The In is the normal logarithm (Log E). Furthermore, the community structure of the river was analyzed using the Shannon Weiner diversity index. The following formula was used to calculate the diversity.

Where, H is the diversity in species, Pi is the percentage of organisms found in the ith species, In is the normal logarithm. The evenness within a community, which was used as an indication of a station’s homogeneity was also calculated (Equation 4).

Where, H is the diversity of species, and InS is the overall number of species’ natural logarithm.
Plankton sampling and analysis:At Site 1 (Abuloma River), using tugboat samples were acquired by filtering the water through standard plankton net (55μm mesh size) with a base collector of 500ml for about 5 minutes. The resultant concentrated phytoplankton samples were transferred into a 350ml plastic container and fixed with 5% formalin for preservation according to the method of [26,27]. At the remaining sites (Eagle Island and Ogbogoro), samples were obtained by stepping into the water body on foot and filtering through the water using a standard plankton net (55μm mesh size) with a base collector of 500ml for about 5 minutes and the plankton concentration transferred into a 350ml plastic bottle. The bottles were taken to lab for phytoplankton identification and analysis. In the laboratory, the samples were allowed to stand for 24 hours for phytoplankton to settle before the concentrated supernatant was pipetted using a wide-mouthed pipette. One (1)ml of the phytoplankton subsample was withdrawn from field samples which was homogenized by inverting the containers for a few times. The samples were placed on a sedge-wick rafter-counting chamber and observed directly under a microscope (ZEISS Microscope Primo Star, Magnification 100×) using the drop count method by [28] for species identification and classification. Identification keys of American Public Health Association (1985) was used for identification of phytoplankton species.
Statistical analysis
Data on water quality parameters were subjected to One-Way Analysis of Variance (ANOVA) at probability level of P<0.05 to determine mean differences using IBM SPSS, version 25 (SPSS Inc., USA). Duncan multiple range test was used to separate the mean differences. Microsoft Excel 2016 was employed for graphical illustrations of plankton abundance and composition across the sites. The community structure (Margalef’s species diversity, Shannon-Wiener’s index, and species evenness) was calculated using PAST software version 3.2.
Results
Mining destroys the wetland ecosystem
Sand mining activities destroy the wetlands ecosystem and plunder its resources because of the use of heavy-duty equipment, which is used to clear the mangrove forest (Figure 2). The dumping of the sand smother living organisms and changes the chemistry of the soil thus, negatively impacting the phytoplankton population with serious implication on the fishery industry.
Physico-chemical parameters:The results of water quality across the sampling sites tested during study period are presented in Tables 1 & 2 and Figures 3 & 4.
Table 1:Range, Mean and Standard error of physicochemical parameters across study sites. Different letters indicate significant differences (P < 0.05).

Table 2:Relative abundance of phytoplankton (No. of cells per ml) in three locations from March to October in the Niger Delta, Nigeria where AB=Abuloma, OG=Ogbogoro, EI=Eagle Island.

Figure 3:Graph of physico-chemical characteristics of study sites in the Niger Delta, Nigeria.

Figure 4:Estimation of the numerical composition (a) Across months, (b) Locations and (c) Relative abundance of phytoplankton in the Niger Delta, Nigeria.

Temperature (ºC):The mean monthly surface water temperature ranged from 30.1-32.0 oC (Table 1 & Figure 3). The highest mean temperature (31.2±0.21 oC) was recorded at Abuloma, while the lowest mean temperature was observed at Eagle Island (31.1±0.24 oC) (Table 1). There was non-significance (p>0.05) across months and stations for surface water temperature.
Dissolved Oxygen (DO):The mean DO throughout the study sites ranged between 4.3 to 6.3mg/L. The smallest mean (5.13±0.23mg/L) was recorded in Abuloma and highest in Ogbogoro with 5.57±0.26 mg/L (Table 1). Results disclosed that there was no significant difference in the mean DO at (p>0.05) throughout the stations. The DO across stations and months were similar to the stipulated minimum requirement of 5mg/L by Federal Ministry of Environment (FME), Nigeria.
pH: The mean pH across study sites ranged from 7.55 to 8.41 (Table 1). The highest mean was recorded at Ogbogoro with 8.11±0.09 while the lowest mean was at Eagle Island with 7.63±0.09. The difference in mean pH between stations and months were not significant at (p>0.05).
Biochemical Oxygen Demand (BOD):The results obtained for BOD ranged from 0.3-2.5mg/L. Results revealed that the lowest level of BOD5 was recorded in Abuloma (1.7±0.32mg/L), whereas the maximum mean value of -2.93±0.22mg/L was recorded at Eagle Island (Table 1). Mean values were insignificantly different (p>0.05) in the different stations throughout the months of sampling.
Total Dissolved Solids (TDS):Total dissolved solids (TDS) concentration collected across the stations and the months discovered that there were variations throughout study period of samples as shown in Table 1. The table shows that variations in TDS values ranges from 6.35-31.41mg/L. The lowest mean value was recorded at Ogbogoro (10.96±1.29mg/L) and was highest at Abuloma (30.12±0.97mg/L). There was significance (p<0.05) in spatio-temporal variation in TDS.
Electrical Conductivity (EC):Electrical conductivity observed across the sites at each month reveal that there was only little variation throughout the period sampled as shown in Table 1. Furthermore, the results reveal the mean variation in conductivity values ranges from 26.3-79.27μS/cm. The maximum mean value of 30.7±0.84μS/cm was recorded in Abuloma while the minimum mean value of 25.88±10.76μS/cm was recorded in Ogbogoro. There was no significant difference (p>0.05) in electrical conductivity in the stations sampled during the months. The conductivity was determined to show the ability of the water to conduct electrical current based on the ions present, which is determined by the level of salinity of the water. Thus, the more the ions available, the higher the conductivity of the water and vice versa.
Salinity (‰):Salinity recorded across the stations and months showed slight variations throughout the period sampled (Table 1 & Figure 3). Result shows that variations in salinity values range from 7.3-21.2‰. The maximum value of 21.2‰ was recorded at Abuloma while minimum value of 7.3‰ was recorded at Eagle Island. The highest mean value was also recorded at Abuloma while the least mean value was recorded at Eagle Island. ANOVA results revealed that salinity in the individual stations of the month sampled were significantly different (p<0.05). Graph of the physicochemical properties of the various study areas are represented in Figure 3.
Composition, abundance, and diversity of phytoplankton:The relative abundance of the phytoplankton organisms encountered within the study area is presented in Table 2 and Figure 4. Figure 4a shows the monthly distribution of phytoplankton in the study area, while Figure 4b. shows the spatial distribution of phytoplankton across location. A total of 2610 phytoplankton in 4 taxa, 43 species were collected across the study sites. The Bacilliarophyceae (diatoms) dominated with 2466 individuals, 40 species constituting (94.48%). The Cyanophyceae were next with 95 individuals, 1 species (3.64%) followed by Dinophycaea with 25 individuals and one species (0.96%). Charophyta was the least abundant with 24 individuals, one species (0.92%). Coscinodiscus spp and Navicula spp were the most dominant being represented with 5 species each which were highly prevalent across the study sites in all months. Phytoplankton composition and abundance was highest at Eagle Island (36.67%) and least at Abuloma with 29.04% (Figure 4c). In all the months, the group bacillariophyta is the most abundant taxa (Figures 4a & b). The biodiversity indices including Margalef’s diversity index, species evenness, Shannon- Wiener index, and number of individuals caught across three sites are presented in Table 3. The number of species caught throughout the period of study ranged between 758 and 957 with the highest recorded at Eagle Island and lowest in Abuloma. The Margalef’s diversity index of phytoplankton ranged from 5.002 to 5.536, while the Shannon-Wiener index ranged from 3.246 to 3.455 whereas species evenness ranged between 0.7336 and 0.8115.
Table 3:Phytoplankton diversity indices across study sites in Port Harcourt, Nigeria.

Discussion
Impact of mining on physicochemical properties
Environmental parameters significantly influence the maintenance of a healthy aquatic environment and the output of natural food organisms [29]. The water quality indices obtained in this research such as temperature and pH, were within acceptable range for tropical waters as recommended by WHO, while others including Dissolved Oxygen (DO), Biochemical Oxygen Demand (BOD), Total Dissolved Solids (TDS) and Electrical Conductivity (EC) were not within acceptable range as stipulated by WHO. Temperature which was non-significant across all stations and sampling period has most significant physical attribute influencing the metabolic rate of aquatic life was within optimal water temperatures range of 18 ºC-38 ºC. Results from this study was similar to reports of [30] whose study showed the impact of in-stream sand dredging on water quality. The results of [31] are slightly above studies of [32,16]. Difference could be attributed to time of day in which samples were taken for each study as air temperature can influence surface water temperature. The DO concentrations throughout the stations as seen from this investigation supports the inverse relationship between BOD and COD as higher DO and lower BOD values are principally attributed to high algae production, which has effect on increasing oxygen solubility at lower temperatures [33]. The reduced level of dissolved oxygen observed across the sites could be partly due to high temperature on rivers as well as an increase in organic load during the dredging process particularly in Abuloma, with the least DO values where sand mining activities was very severe. The higher the organic load the more the aerobic biodegradation that depletes oxygen [34]. The DO result from this study was in consonance with reports of [35]; however, varied with reports of [16]. Biological Oxygen Demand (BOD) is important in pollution monitoring [36]. Water with BOD lower than 4mg/L are thought to be clean and those with levels more than 10mg/L are considered as polluted as they hold high quantity of organic material [37]. Thus, the recorded BOD values (0.3 and 2.5mg/L) in the sand mining sites show that the water is clean probably due to air circulation from the sand mining, which constantly circulate the water while dredging for the sand. The high-water pH values were not significantly different across the stations and could be associated with presence of suspended particles due to acid runoffs, discharges from industrial and domestic activities around the sites, most specifically Ogbogoro. Moreover, the pH was consistent with the report of [16]. The mean pH on river was neutral even with an ongoing sand mining project. Abandoned dredging machines and materials can lead to increase in acidity of the water and sand [38], as observed at Eagle Island, which has an abandoned dredger. Alterations in pH levels observed in aquatic ecosystem was linked to respiration or photosynthesis of algae deriving food from an industrial pollutant or contaminant. Most contaminants, specifically, metals tend to be more soluble in water as pH goes down [39].
Electrical conductivity and total dissolved solids values obtained in our study were above the permissible limits of WHO for tropical waters. However, the EC and the TDS values from this work is in line with the studies of [16,30]. TDS can be influenced by alterations in pH, and this change has potential of enhancing the precipitation of some solutes or will affect solubility of suspended matter [39]. The salinity of this research shows a highly significant brackish environment. Abuloma had the highest salinity level (21.2‰) because it is closer to the brackish belt in the region whereas Ogbogoro has the least salinity (7.3‰) because it is far away from the brackish belt and in upland area. This salinity level has the capacity of supporting the distribution, abundance, growth, and diversity of planktons and other aquatic fauna requiring stable salinity for survival. The study site at Eagle Island has low salinity because of low human activity due to the stoppage of the sand mining activity 5 years ago, thus improved water quality has led to the resurgence of phytoplankton at the site. In contrast Abuloma study site is being actively mined, which has made it to have high human activity with low water quality and reduced phytoplankton growth.
Impact of sand mining on phytoplankton abundance
In general, the high composition of phytoplankton species encountered in the present study and the dominance of diatoms compares favorably with the results of previous study [40] but at variance with some others. For instance, [39]; showed that cyanobacteria and euglenophyta are the most dominant groups in their studies. Coscinodiscus spp. and Navicula spp. were the most dominant in the study sites being represented with 5 species each. High species diversity was recorded across the study sites (Table 3) because of two main reasons, firstly, high nutrient concentration and secondly, low pollution in the sand mining environment, which has encouraged the proliferation of fishes [41] and biotic life [42]. Mining activity is a form of disturbance that causes variation in species diversity indices [42], And this may cause detrimental effect on the plankton community [26] in the long run if nothing is done to stop it. Therefore, the lower the abundance of the plankton community the more it would have negative effect on the zooplankton abundance with a resultant effect on the fishery population in the food chain [43-54]. This situation has ripple effect on the fish consuming population in the locality because it can lead to a reduced catch by the fisher folks, which will impact the livelihood opportunities of the local people [55-82].
Conclusion
Generally, the investigation discovered that there were no significant variations in some physicochemical parameters in Abuloma, Ogbogoro and Eagle Island except for TDS and salinity contents [83-102]. Some parameters analyzed such as DO, BOD, EC and TDS were found to be above the approved limits based on WHO standards, hence implying that water quality on these studied areas have been impacted negatively by continuous in-stream sand mining activities alongside other anthropogenic perturbations. In tropical regions, plankton density varies from freshwater to estuarine zones and from dry to wet seasons [103-122]. There was evident variation of phytoplankton distribution and abundance across the stations and this is related to the differences in water quality parameters that supports phytoplankton proliferation in these areas with diatoms as the most abundant species. November had highest abundance of phytoplankton, while the least abundance was observed in January [123-130]. The higher composition and abundance of phytoplankton in Eagle Island is supported by the least sand mining activities among three observed sites while the reduced phytoplankton abundance in Abuloma is attributed to the high sand mining activities in the area as shown by the high TDS value obtained at Abuloma. The highest diversity values recorded at Ogbogoro for phytoplankton is attributed to the favorable food resource and lesser pollution at the site.
References
- Abdul WO, Adekoya EO, Ademolu KO, Omoniyi IT, Olajide AE (2016) The effects of environmental parameters on zooplankton assemblages in tropical coastal estuary, South-west, Nigeria. Egyptian J of Aqua Res 42(3): 281-287.
- Abowei JFN, Ezekiel EN (2003) Aspect of some physicochemical parameters of the fresh water reaches of the lower num river, Niger Delta. Int J of Sci and Tech 1(2): 5-9.
- Abowei JFN, George ADI (2009) Some physical and chemical characteristics in Okpoka Creek, Niger Delta, Nigeria. Res J of Environ and Earth Sci 1(2): 45-53.
- Abowei JFN, Sikoki FD (2005) Water pollution management and control. Double Trust Publication Company, Port Harcourt Nigeria, pp. 1-236.
- Adedeji OH, Adebayo HO, Sotayo EI (2014) Assessing environmental impacts of inland sand mining in parts of Ogun State, Nigeria. Ethiopian J of Environ Stud & Manage 7(5): 478-487.
- Adelakun KM, Mu’azu MM, Amali RP, Omotayo OL (2016) Diversity of phytoplankton communities in a Tropical River Basin, Nigeria. Hydro Nepal 19: 52-56.
- Adekunbi FO, Elegbede IO, Akhiromen DI, Oluwa-gunke TO, Oyatola O (2018) Impact of sand dredging activities on ecosystem and community survival Ibeshe Area of Lagos Lagoon, Nigeria. J of Geosci and Environ Protect 6(2): 112-125.
- Adesina TK, Adunola OA (2017) Perceived effects of sand dredging on livelihood diversification of artisanal fisher folks in Lagos State, Nigeria. Agri Tropical Et Subtropica 50(2): 71-79.
- Akabzaa T, Darimani A (2001) Impact of mining sector investment in Ghana: A study of the Tarkwa Mining region. A Draft Report Prepared for SAPRI, pp. 1-71.
- Akankali JA, Idongesit AS, Patrick PE (2017) Effects of sand mining activities on water quality of Okoro Nsit stream, Nsit Atai local government area, Akwa Ibom state, Nigeria. Internat J of Dev and Sustain 6(7): 451-462.
- Ako TA, Onoduku US, Oke SA, Essien BI, Idris FN, et al. (2014) Environmental effects of sand and gravel mining on land and soil in Luku, Minna, Niger State, North Central Nigeria. J of Geosciences and Geomatics 2(2): 42-49.
- Alagoa KJ, Aleleye-Wokoma IP (2012) Human induced variations of selected physicochemical parameters of Taylor Creek in the Niger Delta, Bayelsa State, Nigeria. Res and Environ 2(2): 45-50.
- Ajibare AO (2014) Assessment of physico-chemical parameters of waters in local government area of Ondo State, Nigeria. Int J of fisheries and Aqua stud 1(5): 84-92.
- APHA (1998) Standard methods for the examination of water and wastewater. 20th (Edn.), American Public Health Association, American Water Works Association and Water Environmental Federation, USA.
- Anene A (2003) Techniques in hydrobiology: Research techniques in biological and chemical sciences. In: Onyeike EN, Osuji JO (Eds.), Springfield Publishers Ltd, USA, pp. 174-189.
- APHA (1985) Standard methods for examination of water and wastewater. 16th (Edn.), American Public Health Association, American Water Works Association and Water Environmental Federation, USA.
- Araujo GS, Pacheco D, Cotas J, Silva JWA, Saboya J, et al. (2022) Plankton: Environmental and economic importance for a sustainable future. Plankton Communities, pp. 1-19.
- Aromolaran AK (2012) Effects of sand mining activities on land in agrarian communities of Ogun state. Continent J of Agri Sci 6(1): 41-49.
- Asabonga M, Cecilia B, Mpundu MC, Vincent NMD (2016) The physical and environmental impacts of sand mining. Transactions of the Royal Soc of South Afri 72(1): 1-5.
- Atejioye AA, Odeyemi CA (2018) Analysing impact of sand mining in Ekiti State, Nigeria using GIS for sustainable development. World J of Res and Rev 6(2): 26-31.
- Ayeni AO, Soneye ASO, Balogun II (2009) State of water supply sources and sanitation in Nigeria: Implications for muslims in Ikare-Akoko township. The Arab World Geographer 12(1-2): 95-104.
- Bagchi P (2010) Unregulated sand mining threatens Indian rivers. The Journal India Together 21: 7-9.
- Best GA, Ross SL (1977) River pollution studies. Liverpool University Press, UK, pp. 1-92.
- Bhargava DS, Saxena BS, Dewakar RW (1998) A study of geo-pollutants in the Godavary river basin in India. Asian Environ 12: 36-59.
- Bhattacharya RB (2018) Instream sand mining impact on water quality and benthos community in an alluvial reach: A case study on river Kangsabati, West Bengal. Int J of Current Res in Life Sci 7(8): 2613-2617.
- Brown RM, McClelland NI, Deininger RA, Tozer RG (1970) Water quality index-do we dare. Water Sewage Works 117(10): 339-343.
- Cako V, Baci S, Shena M (2013) Water turbidity as one of the trophic state indices in Butrinti Lake. J of Water Res and Protect 5(12): 1144-1148.
- Cander-Lund H, Lund JWG (1995) Freshwater algae. Their microscopic world explored. Biopress Ltd. UK, pp. 1-380.
- Chimbodza P (2012) Mineral Sands Mining in the Ruckomechi and Chewore Rivers.
- Gillet C, Quetin P (2006) Effect of temperature changes on the reproductive cycle of loach in Lake Geneva from 1983 to 2001. J of Fisheries Biol 69(2): 518-534.
- Davies OA, Abowei JFN, Otene BB (2009) Seasonal abundance and distribution of plankton of Minichinda Stream, Niger Delta, Nigeria. American Journal of Scientific 2: 20-30.
- Davies OA (2009) Spatio-temperal distribution, abundance and species composition of zooplankton of Woji-Okpaka Creek, Port Harcourt, Nigeria. Rese J of Applied Sci Eng and Tech 1(2): 14-34.
- Department of Water Affairs and Forestry (DWAF) (2003) Strategic Framework for Water Services. Government Printer, South Africa.
- Dimowo BO (2013) Assessment of some physico-chemical parameters of River Ogun (Abeokuta, Ogun State, Southwestern Nigeria) in comparison with national and international standards. Int J of Aquaculture 3(15): 79-84.
- Doloksaribu DCN, Barus TA, Sebayange K (2019) The impact of sand mining on sand mining on sea water quality in Pantai Labu, Deli Serdang Regency, Indonesia. IOP Conf Series: Earth and Environmental Science 454 (2020): 1-7.
- Draggan S (2008) Encyclopedia of Earth Sand and Gravel. Encyclopaedia of Earth, USA.
- Edmore K, Humphrey M (2012) An assessment of environmental impacts of sand and gravel mining in Nzhelele Valley, Limpopo Province, South Africa. 3rd International Conference on Biology, Environment and Chemistry 46: 137-141.
- Edwin AI, Murtala AI (2013) Determination of water quality index of river Asa, Ilorin, Nigeria. Adv in Applied Sci Res 4(6):277-284.
- Ekosse G (2004) A Handbook of environmental impacts of mining on soils around the abandoned Kgwakgwe Manganese mine in Botswana Gaborone: Macmillan. Macmillan Publishers, UK.
- Ekwu AO, Sikoki FD (2006) Phytoplankton diversity in the cross-river estuary of Nigeria. J of Applied Sci and Environ Manage 10(1): 89-95.
- Ezekiel E (2010) Nigeria needs N45 trillion to tackle housing deficit-FMBN. Nigerian Business Forum.
- FAO (2000) Interactions between fish and aquatic macrophytes in inland waters. Food and Agriculture Organization, Italy, pp: 1-185.
- Gharib SM, El-Sherif ZM, Radwan AA, Abdel-Halim AM (2011) Phytoplankton and environmental variables as a water quality indicator for the beaches at Matrouh, south-eastern Mediterranean Sea, Egypt: An assessment. Oceanologia 53(3): 819-836.
- Gob F, Houbrechts G, Hiver JM, Petit F (2005) River dredging, channel dynamics and bedload transport in an incised meandering channel (The River Semois Belgium). River Res and Appl 21(7): 791-804.
- Goddard J (2007) Land degradation and rehabilitation. University of South Wales Press, Australia.
- Grant IF (2002) Aquatic invertebrates. In: Grant IF, Tingle CCD (Eds.), Ecological monitoring methods for the assessments of pesticide impact in the tropics. The University of Greenwich, UK, pp.183-193.
- Gulson BL, Sheehan A, Giblin AM, Chiaradia M, Conradt B (1997) The efficiency of removal of lead and other elements from domestic drinking waters using a bench-top water filter system. Sci of the Total Environ 196(3): 205-216.
- Hackney CR, Darby SE, Parsons DR, Leyland J, Best JL, et al. (2020) Riverbank instability from unsustainable sand mining in the lower Mekong River. Nature Sustainability 3(3): 217-225.
- Hamilton DP, Duggan IC (2010) Plankton. In: Colier KJ (Ed.), The Waters of the Waikato: Ecology of New Zealand’s longest river. New Zealand: Environment Waikato and the Centre for Biodiversity and Ecology Research, UK, pp. 109-123.
- Haque MM, Narejo NT, Salam MA, Rahmatullah SM, Islam MA (2003) Determination of optimum stocking density of Macrobrachium rosenbergii in carp polyculture in earthen pond. Pakistan J of Biol Sci 6: 898-901.
- Hemalatha AC, Chandrakanth MG, Nagaraj N (2005) Effect of sand mining on groundwater depletion in Karnataka. International R&D Conference of the central board of irrigation and power, India, pp. 15-18.
- Higler LWG (2012) Biology and biodiversity of river systems. Fresh surface water 2: 1-5.
- Hill L, Kleynrans, CJ (1999) Authorisation and licensing of sand mining/gravel extraction, in terms of impacts on in-stream and riparian habitats. J of Mining Sci 15: 17-19.
- Holden M, Reed W (1972) West African freshwater fish. Longman Publishing Group, USA, pp. 997-1033.
- Horton RK (1965) An index number system for rating water quality. J of Water Pollut Control Fed 37(3): 300-305.
- Hossain M, Akter SA, Sarker S (2022) Environmental controls of plankton community dynamics in a sub-tropical river system of Bangladesh. Aqua Ecol 56: 1271-1286
- Ideriah TJK, Adikema N (2015) Quality assessment of some surface water in Israel and Nigeria for multipurpose usage. Int J of Innovat and Applied Rese 3(10): 26-38.
- Idodo-Umeh G (2003) Freshwater fishes of Nigeria taxonomy, ecological notes, diet and utilization. Idodo-Umeh Publishers Limited, Nigeria, pp. 231.
- Igbinosa EO, Uyi OO, Odjadjare EE, Ajuzie CU, Orhue PO, et al. (2012) Assessment of physicochemical qualities, heavy metal concentrations and bacterial pathogens in Shanomi Creek in the Niger Delta, Nigeria. Afri J of Environ Sci and Tech 6(11): 419-424.
- Ighalo JO, Adeniyin AG (2020) A comprehensive review of water quality monitoring and assessment in Nigeria. Chemosphere 260: 127569.
- Ikomi RB, Anyanwu ED (2010) Zooplankton of Ogba River, Benin City Nigeria. Bioscience Research Communica 22(5): 255-258.
- Isah R (2011) Nigeria: Making housing fund contribution national agenda.
- Jakhar P (2013) Role of phytoplankton and zooplankton as health indicators of aquatic ecosystem: A review. Int J of Innovat Res and Stud 2(12): 490-500.
- Jeje CY, Fernando CH (1986) A practical guide to the identification of Nigerian zooplankton (Cladocera, copepoda and rotifera). Kainji Lake Research Institute, Nigeria.
- Jose MK, Shantanu KY, Venkatesh B (2014) A study of effect of sand mining on riverine environment. In: Tiwari HL, Suresh D, Jaiswal RK (Eds.), Hydraulics, Water Resources, Coastal and Environmental Engineering. Excellent Publishing House, India, pp. 1378-1386.
- Kazanci N, Girgin S (1998) Distribution of Oligochaeta species as bioindicators of organic pollution in Ankara stream and their use in biomonitoring. J of Zoo 22(1): 83-87.
- Keller B, Wolinska J, Manka M, Spaak P (2008) Spatial, environment and anthropogenic effects on the taxon composition of hybridizing Daphnia. Philos Transa of the Royal Soc of Biol Sci 363(1505): 2943-2952.
- Khanna DR, Bhutiani R, Matta G, Kumar D, Singh V, et al. (2009) A study of zooplankton diversity with special reference to their concentration in River Ganga at Haridwar. Environ Conserv J 10(3): 15-20.
- Koehnken L, Rintoul MS, Goichot M, Tickner D, Loftus AC, et al. (2020) Impacts of riverine sand mining on freshwater ecosystems: A review of the scientific evidence and guidance for future research. River Res and Appl 36(3): 362-370.
- Kondolf GM, Smeltzer M, Kimball L (2002) Freshwater gravel mining and dredging issues. White paper prepared for: Washington Departments of Fish and Wildlife, Ecology, Transportation, USA, pp. 122.
- Kondolf MG (2007) Geomorphic and environmental effects of instream gravel mining. Landscape and Urban Planning 28(3): 225-243.
- Kori E, Mathada H (2012) An Assessment of environmental impacts of sand and gravel mining in Nzhelele Valley, Limpopo Province, South Africa. 3rd International Conference on Biology, Environment and Chemistry held in Singapore 2012, Singapore 46(2012): 137-141.
- Krausmann F, Gingrich S, Eisenmenger N, Erb KH, Haber H, et al. (2009) Growth in global materials use, GDP, and population during the 20th Ecol Econ 68(10): 2696- 2705.
- Kuttipuran M (2006) Rivers: Physical modifications. Singapore.
- Lackey JB (1938) The manipulation and counting of river plankton and changes in some organisms due to formalin preservation. United States Public Health Reports 53: 47.
- Lair N (2006) A review of regulation mechanisms of metazoan plankton in riverine ecosystems: Aquatic habitat versus biota. River Res and Appl 22(5): 567-593.
- Langer WH (2003) A general overview of the technology of in-stream mining of sand and gravel resources, associated potential environmental impacts, and methods to control potential impacts. USGS, pp. 1-17.
- Lawal PO (2011) Effects of sand and gravel mining in minna emirate area of Nigeria on stakeholders. J of Sustain Dev 4(1): 193-199.
- Lawson EO (2011) Physical-chemical parameters and heavy metal contents of water from the mangrove swamps of Lagos lagoon, Nigeria. Adv in Biol Res 5(1): 8-21.
- Lupande F (2012) The high cost of sand. The Herald Publishers, India, pp. 34-38.
- Madyise T (2004) Case studies of environmental impacts of sand mining and gravel extraction for urban development in Gaborone. Minerals Engineering, pp. 1-134.
- Mbaiwa K (2008) A handbook of socio economic and environmental impacts of mining and development.
- Mmom PC, Chukwu-Okeh GO (2012) Sand dredging and river morphology change along parts of new calabar river in Akpor area of rivers state, Nigeria, and its implications for biological resource conservation. Res J of Environ and Earth Sci 4(1): 82-87.
- Mutiso K (2014) Impacts of instream sand harvesting on water supply, A case study of river Thwake, Makueni County. Kenyatta University, Kenya, pp. 1-47.
- Mwangi S (2007) Management of river systems in East Africa. Kenya.
- Nabegu AB (2012) In-stream sand mining in Kano River: Implications for sustainable resource utilization, paper presented at the 54th Annual Conference of the Association of Nigerian Geographers held at the Department of Geography, Kano University of Science and Technology Wudil, 19th-23rd November 2012, Nigeria.
- NBS (2012) National Bureau of Statistics. Water Supply Statistics.
- Nthambi MV, Orodho JA (2015) Effects of sand harvesting on environment and educational outcomes in public primary schools in Kathiani Sub-County, Machakos County, Kenya. J of Edu and Prac 6(24): 1-11.
- Numbere AO (2020) Diversity and chemical composition of weeds in sand-filled mangrove forest at Eagle Island, Niger Delta, Nigeria. Ame J of Plant Sci 11(7): 994-1007.
- Nwaichi EO, Uwakwe AA, George MS (2020) Water quality and hydrocarbon contaminant level in soil and fishes around Abuloma Jetty, Port Harcourt, Nigeria. J of Environ Sci and Tech 13(2): 106-117.
- Obot OI, Ekpo IF, David GS (2019) The effect of sand mining on the physico-chemical parameters of Ikot Ekpan River, Akwa Ibom State, Nigeria. J of Aqua Sci and Mar Biol 2(4): 21-24.
- Obot OI, Etim L, David GS (2016) Review of physical and chemical properties of some Nigerian creeks. Nigerian J of Agri, Food and Environ 12(4): 82-90.
- Odulate DO, Omoniyi IT, Alegbeleye WO, George FA, Dimowo O (2017) Water quality in relation to plankton abundance and diversity in river Ogun, Abeokuta , Southwestern Nigeria. a. Int J Env Health Eng 6(3): 1-8.
- Benedict O, Ayotunde, Ikpi, Fidelis BA, Stephen O (2011) Plankton-based assessment of the trophic state of three tropical lakes. J of Environ Protect 2: 304-315.
- Ogbuagu DH, Ayoade AA (2012) Spatial fluctuations in zooplankton biotypes of the imo river in a Niger Delta area of Nigeria. Inter J of Ecosys 2(4): 54-60.
- Ogbuagu DH, Ayoade AA (2012) Phytoplankton assemblage along gradients of the Imo river in Etche Local Government Area, Nigeria. Ann of Biol Res 3(4): 1852-1862.
- Ogbuagu DH, Ayoade A, Chukwuocha NBAC (2011) Spatial dynamics in physicochemistry and bacterio and myco-plankton assemblages of Imo River in a Niger Delta community in Nigeria. Afri J Micro Res 5(8): 872-887.
- Ohimain EI (2008) Environmental impacts of dredging and canalization in the Niger Delta. Paper presented at the 2008 Annual Workshop of the Nigerian Mining and Geosciences Society, Port Harcourt Nigeria.
- Okeke PN, Anyanwu JC, Edenta VI (2019) Impact of sand mining on water quality and bank morphology of Ontamiri River in Owerri Nigeria. Int J of Adv Res in Sci, Eng and Tech 6(1): 7737-7744.
- Olomukoro JO, Oronsaye C (2009) The plankton studies of the Gulf of Guinea, Nigeria. Biosci Res Communication 21(2): 71-75.
- Omole D, Ajakaiye O (1998) Environmental externalities and sustainable urban development: Who bears environmental costs. In: Adeniji K, Ogu VI (Eds.), Sustainable physical development in Nigeria, Ibadan: Nig Inst of Soc and Econ Res, pp. 115-132.
- Pereira K (2012) Illegal sand mining: The unexamined threat to water security in India.
- Pillaya S, Naidoob K, Bissessurc A, Agjeea A, Pillaya K, et al. (2014) Sand mining impacts on heavy metal concentrations in two important river systems of northern Kwazulu-Natal, South Africa. J of Human Ecol 47(2): 155-162.
- Pitchaiah PS (2017) Impacts of Sand Mining on Environment-A Review. Int J of Geo informatics and Geo Sci 4(1): 1-5.
- Ramakrishnaiah CR, Sadashivaiah C, Ranganna G (2009) Assessment of water quality index for the groundwater of Tumkur Taluk, Karnataka State, India. J of Chem 6(2): 523-530.
- Reddy VK, Prasad KL, Swamy M, Reddy R (2009) Physico-chemical parameters of Pakhal lake of Warangal District Andhra Pradesh, India. J of Aqua Biol 24: 77-80.
- Rentier EE, Cammeraat LE (2022) The environmental impacts of river sand mining. Sci of the Total Environ 838(1):
- Saviour NM (2012) Environmental impacts of soil and sand mining: A review. Int J of Sci, Environ and Technol 1(3): 125-134.
- Sayami M, Tamrakar NK (2007) Status of sand mining and quality in northern Kathmandu, Central Nepal. Bullet of the Dep of Geol 10: 89-98.
- Schaetzl R (1990) Sand and gravel mining for aggregate.
- Shymbin BW, Nongbri G (2022) Impact of sand mining on the physical health of the river and the livelihood of the people: A case study of Umtyngngar river, Meghalaya. Anthropogeomorphology, pp. 221-242.
- Sivaranjani S, Amitava R, Samrath S (2015) Water quality assessment with water quality indices. Int J of Biores Sci 2(2): 85-94.
- Smitha AD, Shivashankar P (2013) Physico-chemical analysis of the freshwater at river Kapila, Nanjangudu industrial area, Mysore, India. Int Res J of Environ Sci 2(8): 59-65.
- Sommer U (1994) Planktologie. pp. 1-274.
- Stebbins M (2006) Can gravel mining and water supply wells coexist. University of Maine, USA.
- Steinberger JK, Krausmann F, Eisenmenger N (2010) Global patterns of materials use: A socioeconomic and geophysical analysis. Ecolo Econ 69(5): 1148-1158.
- Stevenson RJ, Pan Y (1999) Assessing environmental conditions in rivers and streams using diatoms. In: Stoermer EF, Smol JP (Eds.), The diatoms. Applications for the environmental and earth sciences. Cambridge University Press, UK, pp. 11-40.
- SPSS Inc (2008) SPSS Statistics for Windows Version 25 USA.
- Tamuno PBL (2005) Eco-livelihood assessment of inland river dredging: The Kolo and Otuoke Creeks, Nigeria, a case study. Ph.D. Thesis, Loughborough University, UK, pp. 1-371.
- (2002) United Nations Conference on Environment and Development Report.
- Wachira P (2009) Sand mining in Machakos District. Poverty Eradication Network Journal 16: 29-30.
- Wasserman J, Lemley DA, Adams JB (2022) Saltpan primary producer and inorganic nutrient dynamics in response to inundation with nutrient-rich source waters. J of Experiment Mar Biol and Ecol 551:
- Welcomme RL (1985) River fisheries. FAO Fisheries. Food and Agriculture Organization, Italy, pp: 1-330.
- Welhan J (2001) Ground-water interactions near the highway pond gravel pit, Pocatello, Idaho. Idaho Geological Survey, Russia, pp. 1-37.
- World Health Organization (2012) Guidelines for Drinking-water quality, 4th (Edn.), incorporating the 1st pp. 1-631.
- WRM (2004) World Rainforest Movement, Mining: Social and Environmental Impacts.
- Yakasai IA, Salawu F, Musa H (2004) Concentrations of lead in Ahmadu Bello University dam, raw, treated (tap) and ABUCONS pure water. Chem Class Journal 1: 86-90.
- Yen TP, Rohasliney H (2013) Status of water quality subject to sand mining in the Kelantan River, Kelantan. Tropical Life Sci Res 24(1): 19-34.
- Yusuf ZH (2020) Phytoplankton as bioindicators of water quality in Nasarawa reservoir, Katsina State Nigeria. Acta Limnologica Brasiliensia 32(4): 1-11.
- Zabbey N, Sikoki FD, Edoghotu J (2008) Plankton assemblages and environmental gradients in the middle reaches of Imo River, Niger Delta, Nigeria. Afri J of Aqua Sci 33(3): 241-248.
© 2022 Aroloye O Numbere. This is an open access article distributed under the terms of the Creative Commons Attribution License , which permits unrestricted use, distribution, and build upon your work non-commercially.
Editor In Chief


.jpg)


Signup for Newsletter

Quick Links
 Editorial Board Registrations
 Submit your Article
 Refer a Friend
 Advertise With Us
Our Recent Edition

.jpg)


Top Editors


.jpg)


.bmp)
.jpg)
.png)
.jpg)


.jpg)


.png)

.png)


.png)


Financial Support

Sponsors

Latest e-Books

Latest Video

 a Creative Commons Attribution 4.0 International License. Based on a work at www.crimsonpublishers.com.
Best viewed in
a Creative Commons Attribution 4.0 International License. Based on a work at www.crimsonpublishers.com.
Best viewed in