
- About Us
- Information
-

The Author ensures that the research has been conducted responsibly and ethically with adherence to all relevant regulations. read more..
- For Authors
- For Reviewer
- Manuscript Guidelines
- Membership
- Publication Ethics
-
- Journals
- Reprints
- e-Books
- Videos
- Policies
- Contact Us
 COVID-19
- Submissions


Full Text
Examines in Marine Biology & Oceanography
Compatible First Feeding for Larval Common Sole (Solea solea): Effect of Rotifer and Artemia Scheme Manipulation on Growth Performance and Survival
Mona M Mourad1, Samira S Assem1, Tarek M Srour3, Hossam ER Sharaf1 and Abdallah Tageldein Mansour2,3*
1National Institute of Oceanography and Fisheries, NIOF, Egypt
2Animal and Fish Production Department, College of Agricultural and Food Sciences, Saudi Arabia
3Fish and Animal Production Department, Faculty of Agriculture (Saba Basha), Egypt
*Corresponding author: Abdallah Tageldein Mansour, Animal and Fish Production Department, College of Agricultural and Food Sciences, King Faisal University, P.O. Box 420, Al-Ahsa 31982, Saudi Arabia, Fish and Animal Production Department, Faculty of Agriculture (Saba Basha), Alexandria University, Alexandria 21531, Egypt
Submission: September 16, 2022;Published: October 19, 2022
ISSN 2578-031X Volume5 Issue1
Abstract
In the present study, the most appropriate feeding regimes for the prevalent sole (Solea solea) larvae during the early larval rearing staged (first month) were investigated. Two experiments were conducted to improve the growth performance [the ultimate Body Weight (FBW), Specific Growth Rate (SGR), and Weight Gain (WG)] and survival rate of S. solea larvae. For each experiment, larvae were fed with alive rotifers and Artemia from the third and fifth Day After Hatching (DAH), respectively till the 30th DAH. In the first experiment, three feeding trials (10, 20, and 30 rotifers ml−1) were conducted (in triplicate for each treatment) to set the best rotifer densities as the first feed for S. solea larvae. In the second experiment, larvae were fed with Artemia at the 5th (group Ӏ), 10th (group ӀӀ), or 15th (group ӀӀӀ) DAH (in triplicate for each treatment) to optimize the suitable timing for Artemia introduction to larval rearing tanks. The first experiment indicated that growth performance was enhanced by increasing the density of rotifers in the larval trials; larvae fed with 30 rotifers ml−1 showed the highest values for FBW (9.89±1.07mg), WG (8.89±1.07mg), and SGR% day−1 (8.44%±0.39%). Furthermore, standard length and survival rate increased significantly (p < 0.05) as rotifer density was increased to 30 rotifers ml−1, reaching 9.05 ±0.30mm and 85.99%±3.62%, respectively. The second experiment revealed that early introduction of Artemia at the 5th DAH in larval tanks led to a significant (p<0.05) rise in FBW, WG, and SGR% day−1 in S. solea larvae (10.18±0.88mg, 9.18±0.87mg, and 8.57%±0.33%, respectively). Additionally, the survival rate of larvae was improved slightly in group Ӏ compared with the survival rates in groups ӀӀ and ӀӀӀ. Findings of this work concluded that feeding a high density of rotifers to S. solea larvae significantly increased the survival rate, standard length, and width of the larvae. Additionally, introducing Artemia in the early stage after hatching rather than later significantly increased S. solea larval growth rate, survival, stander length, and width.
Keywords: Rotifer; Artemia; Solea solea; Live food; Fish larvae
Abbreviations: SGR: Specific Growth Rate; WG: Weight Gain; DAH: Day After Hatching; FBW: Final Body Weight; SL: Standard Length; NIOF: National Institute of Oceanography and Fisheries; DO: Dissolved Oxygen
Introduction
The flatfish species of Soleidae family which live preferentially on the sandy and muddy bottoms of continental shelves and slopes where they feed on ample diversity of benthic invertebrates [1]. Prevalent sole, Solea solea, is a demersal and sedentary species that lives mostly in rivers and near river mouths [2]. Jardas [2] also reported that S. solea is disseminated from coastal waters to depths of 250m, where it digs into the sea bottom. The benthic S. solea and S. senegalensis are closely related fish species characterized by highly economic value in aquaculture and fisheries [3,4]. In Egypt, the total production of Solea sp. from natural fisheries during 2015 was approximately 1,653 tons, with 764 tons from the Mediterranean Sea and 889 tons from lakes. In 2015, the production of Solea fish was not recorded from the Red Sea or Nile River. Furthermore, aquaculture production of Solea sp. was not documented [5]. Nevertheless, members of Solea sp. are among the most beneficial and important economic flatfishes in Egypt [6]. Particularly, S. solea was successfully hatched in a laboratory for the first time in 1986, where after juveniles were collected and maintained in healthy condition by Zaki [7]. Assem [8] studied the induced spawning of Solea sp. and its embryonic and larval developmental stages in Mediterranean waters. Additionally, Assem [9] reported that the average absolute fecundity of S. solea was between 34,995 and 117,501 eggs for fish with lengths of 22.2- 32.9cm. Furthermore, the absolute fecundity ranged from 42,385 to 117,501 eggs for fish weighing 90-330g.
In the period of first feeding, Fish larvae have a limited capability to search, elect, catch, ingest, and handle food. Thus, increasing live food density has been considered a practical solution by which to improve food encounters and ingestion in fish larvae [10]. Engrola [11] showed that sole larvae fed live food alone were threefold to sevenfold smaller than sole larvae fed with an inert diet at 60 days after hatching (DAH). Assem [9] studied S. solea has a long spawning season, which begins in mid-December and ends early in April with peaks in December and January. Roca [12] evaluated three different rotifer densities to determine the effects on the survival and growth of common snook (Centropomus undecimalis) larvae; rising rotifer absorption from 5 to 30 rotifers ml−1 did not significantly affect larval length and width, whereas larvae fed with 15 rotifers ml−1 had the highest mean Standard Length (SL) at 3.58mm. However, Zhenhua [13] showed that prey density had a significant effect on the growth of pompano larvae. In a study by Villalta [14], two groups of Senegal sole (S. senegalensis) larvae were civilized: one had access to rotifers for the first 10 DAH as well as enriched Artemia metanauplii at 6-30 DAH, whereas the other group went without rotifers but had access to Artemia. The quantity of Artemia was the same (group A), twofold (group A2), or threefold (group A3) the quantity of live prey in the group fed with rotifers (group R). In items of total length and individual dry weight, the growth was significantly higher in larvae from group A2, whereas rotifer-fed larvae from group R showed the poorest growth. Additionally, eye migration was delayed by approximately 2 days in group R, although significant differences in survival rates were not detected.
Ribeiro [15] reported a significantly increased dry weights and survival rates for postlarvae fed with Artemia when compared with those fed with an ICES diet. Indeed, the weight of postlarvae fed with an ICES diet was 42% lower than the weight of those fed with Artemia. In addition, Roca [12] evaluated the using of different three rotifers densities to determine the effect on growth survival and growth of common snook larvae. Larvae after 14 days, were fed 5 rotifer ml−1 diets had an average survival rate of 0.86% and only 13% of all tanks stocked had live larvae. All the tanks where larvae were fed 15 rotifers ml−1 had a mean larvae survival of 2.5%, and 20% of tank of all tanks stocked had live larvae. In the third treatment with 30 rotifers ml−1, 20% of the tanks had live larvae and a total average of 3.67% larvae survival. No significant differences were found in larval survival between tanks fed 15 and 30 rotifer ml−1 (p=0.053). Increasing rotifer concentrations from 5 to 30 rotifers ml−1 did not significantly (p>0.05) affect the larval length or my mere height. Larvae fed with 15 rotifers per ml had the highest mean Stander Length (SL) at 3.58mm, followed by the other two treatments (3.48 and 3.49mm in average, respectively). Mean my mere height results were 0.74, 0.78 and 0.69 mm, respectively. Considering these previous research, the present study aimed to evaluate the feeding techniques usually applied in S. solea hatcheries, i.e., feeding with rotifers and Artemia as live prey vs. feeding with Artemia nauplii as the only food source, in terms of their effects on larval growth and survival.
Materials and Methods
Induced spawning
Figure 1:Spawning tanks of Solea solea broodstock.

Solea solea broodstock [250-350g fish−1 in Body Weight (BW)] used in the spawning trails were obtained from Domiietta in the north of Egypt. Broodstock were maintained at National Institute of Oceanography and Fisheries (NIOF), Marine Hatchery in 2m2 fiberglass rectangular tanks with a stocking density of 5-7 fish m-3. Spawning induction was performed in two stages. The first consisted of a priming dose of carp pituitary extract at 40-70μg fish−1. The second stage, which occurred 24h later, consisted of a resolving dose of luteinizing and releasing hormone analog at 200μg kg−1. After the resolving dose, spawning occurred after 24- 36h; on average, the sex ratio was 1:2 (female: male) according to the work of Assem [8] (Figure 1).
Incubation and larval management
Fertilized eggs were collected from the broodstock tanks and placed in cones (60L), which were highly aerated to ensure the eggs had a good flipped and did not descend to the bottom of the tank. Two days later, the hatching process was observed, which depended partly on temperature. After hatching, the amount of ventilation was reduced to protect the larvae from over-aeration. By the end of the third DAH, a small amount of rotifers was added to the larval cones. The larvae were subsequently distributed in experimental glass aquaria. Water was changed at a rate of about a half a cone day−1.
Experimental design
Two experiments were conducted using the larvae. In the first experiment, the effect of rotifer density on the growth and survival rate of S. solea larvae was assessed. Three groups were fed with rotifers at 10, 20, and 30 rotifers ml−1, respectively. In the second experiment, the optimal timing at which Artemia are introduced as a feed for S. solea larvae was assessed on the basis of larval growth and survival. Artemia were introduced at three different periods: 5, 10, and 15 DAH. All experiments were performed in glass aquaria (30×40×40cm) containing 20L of sea water (36ppt). In each glass aquarium, aeration and temperature were measured using a Hanna R H19828 water quality instrument. Water temperature was 15 °C- 19 °C. Each glass aquarium was stocked with 640 larvae. In each experiment, the three treatments were replicated in three glass aquaria. The average values of water quality parameters during the 1st and experiment 2nd experiment (Mean± SD) that was Dissolved Oxygen (D.O) that was about (6.5±.46mgL−1), Temperature (T ºC) was about 17.6±1.2 ºC, pH was about 8.18±0.24, TDS was about 85.48±10gl−1, Turbidity was about 1692±413 (NTU), EC 133.5±15.9 (ms lm−1) and Salinity (36±0.00ppt).
First experiment: The effect of rotifer density on the growth and survival of S. solea larvae
The first experiment was conducted between February 10, 2017, and March 7, 2017 (27 days). Solea solea larvae with an initial BW of 0.73−1±0.28mg, average SL of 2.93±0.29mm, and width of 0.68±0.24mm were studied. Nine glass aquaria were divided into three groups: group 1 (fed 10 rotifer ml−1), group 2 (fed 20 rotifer ml−1), and group 3 (fed 30 rotifer ml−1). Three replicates were applied for each treatment. The experiment began at hatching and ended at 30 DAH.
Feeding schedule in first the experiment
In group 1 (10 rotifer ml−1), at 3-9 DAH, the larvae were fed with rotifers (10 individuals ml−1); at 9-20 DAH, the larvae were fed with rotifers plus Artemia (gradually replacing rotifers with Artemia to reach zero rotifers and 5 Artemia ml−1 at 20 DAH); at 20-30 DAH, the larvae were fed only with Artemia (5 individuals ml−1). The same feeding schedules were applied in groups 2 and 3, except that at 3-9 DAH, the larvae were fed with rotifers at 20 individuals ml−1 and 30 individuals ml−1, respectively.
Second experiment: The optimal timing of Artemia introduction as a feed for Solea solea
The second experiment was conducted over 27 days on the same dates as the first experiment. Solea solea larvae with the same initial BW, SL, and body width as those used in the first experiment were used in the second experiment. In nine glass aquaria, three groups were established: group 1 (fed with Artemia at 5 DAH), group 2 (fed with Artemia at 10 DAH), and group 3 (fed with Artemia at 15 DAH). Three replicates were applied for each treatment. The experiment began at hatching and ended at 30 DAH.
Feeding schedule in the second experiment
In group 1, the larvae were fed with rotifers at 20 individuals ml−1 at 3-5 DAH; Artemia were introduced at 5 DAH and provided until the end of the experiment (30 DAH). In group 2, at 3-9 DAH, the larvae were fed with rotifers at 20 individuals ml−1; at 9-20 DAH, the larvae were fed with Artemia and rotifers, with rotifers gradually replaced by Artemia to reach zero rotifers and 5 Artemia ml−1 at 20 DAH; at 20-30 DAH, the larvae were fed with Artemia only (5 individuals ml−1). The same feeding schedule as that in group 2 was used in group 3, except that the larvae were fed with rotifers from 3 to 15 DAH before transitioning to Artemia.
Larvae sampling and processing
Figure 2:Experimental aquaria containing larvae.

At 10−15 DAH in each experiment, samples of 60 larvae (50 for measuring weight; 10 for fixing in formalin to measure length) were randomly collected from each replicate. At the end of each experiment, samples of 20 larvae were randomly collected from each replicate and fixed in formalin to again (Figure 2).
Growth performance
Measured performance parameters included Final Body Weight (FBW), Weight Gain (WG), Specific Growth Rate (SGR%), survival rate (%), SL, and larval width. The average BW (mg) of individual larvae in each experimental treatment was measured to the nearest 0.01mg on a microbalance at the following periods: 3, 10, 15, and 30 DAH. WG was estimated from the following equation:
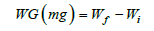
Where Wf is the FBW (mg) and Wi is the initial BW (mg).
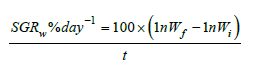
where ln is the natural logarithm, t is time in days, SGRw is the SGR by weight, Wf is the FBW (mg), and Wi is the initial BW (mg).
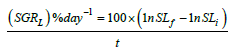
Specific growth rate in relation to standard length
where SGRL is the SGR by SL, SLf is the final SL (mm), and SLi is the initial SL (mm).
Where SGRth is the SGR by larval width, SLf is the final larval
width (mm), and SLi is the initial larval width (mm). Finally,
survival (%) was calculated as follows:
survival (%)=(number of fish at the end/ number of fish at the
start)×100.
Statistical analysis
Differences in FBW, WG, SGR, S, SL, and larval width throughout the experiments were tested using one-way analysis of variance via SPSS. Differences were considered significant at p<0.05. Data are expressed as means±standard deviation (SD).
Results
Experiment 1: The effects of rotifer density on growth and survival of Solea solea larvae
FBW of S. solea larvae fed three different rotifer densities. FBW increased with increasing rotifer density from 10 to 30 rotifers ml−1 (7.23±1.28 to 9.89±1.07mg, respectively), but the effect was not significant (p>0.05) also WG data for larvae fed three different rotifer densities. Those fed 30 rotifers ml−1 showed a nonsignificant (p>0.05) increase in WG to reach 8.89±1.07mg, whereas those fed 10 rotifers ml−1 showed a decrease in WG to 6.23±1.28mg as shown in Table 1 and Figure 3. Figure 4 and Table 1 shows the SGRw of larvae fed three different rotifer densities. When comparing larvae fed 10 and 30 rotifers ml−1, a nonsignificant (p>0.05) increase in SGRw values was observed: 7.22%±0.64% to 8.44%±0.39% day−1, respectively. Figure 5 and Table 1 shows the survival rate of larvae fed three different rotifer densities. Larvae fed 30 rotifers ml−1 showed significantly increased survival rates (p < 0.05) relative to larvae fed 10 rotifers ml−1 (85.99%±3.62% vs. 57.60%±10.74%). Figure 5 and Table 2 shows the SL of S. solea larvae at 3, 10, and 15 DAH when fed three different rotifer densities. At 30 DAH, the SL of larvae fed 30 rotifers ml−1 significantly increased to reach 9.05±0.30mm (p<0.05). However, at 30 DAH, there was no significant difference between the SL of larvae fed 10 and 20 rotifers ml−1. Over the 30-day period after hatching, increasing the density of rotifers from 10 to 30 rotifers ml−1 significantly increased (p<0.05) SL values from 6.80±0.96mm to 9.05±0.30mm. Figure 6 and Table 3 shows the width of S. solea larvae at 3, 10 and 15 DAH when fed three different rotifer densities. There was no significant (p>0.05) difference in width through the period from 10 to 15 DAH. However, at 30 DAH, larvae fed 30 rotifers ml−1 showed a significant (p<0.05) increase in width to reach 4.17± 0.11mm relative to larvae fed 10 rotifers ml−1. Larvae showed a significant increase (p<0.05) in SGRL with increasing rotifer density, with values of 3.09%±0.51% day−1, 3.57%±0.23% day−1, and 4.17%±0.13% day−1 for 10, 20, and 30 rotifers ml−1, respectively (Figure 7). Similarly, SGRth increased significantly (p<0.05) with rotifer density: 5.63%±0.64% day−1, 6.23%±0.16% day−1, and 6.73%±0.18% day−1, respectively as shown in Table 4 and Figure 7.
Table 1:Average±SD of Initial Weight, Final Body Weight (FBW), Weight Gain (WG), Specific Growth Rate (SGRW) in relation of weight and survival rate (%) of Solea solea larvae fed three different densities (10, 20 and 30 rotifer ml−1) from days 3 until 30 days after hatching.

Source: Mean in the same column having different letters are significantly different (p<0.05).
Figure 3:Mean±SD Final Body Weight (FBW) and Weight Gain (WG) of Solea solea larvae fed three different rotifer densities (10, 20, and 30 rotifers ml−1) from 3 to 30 days after hatching.

Figure 4:Mean±SD Specific Growth Rate (SGR) of Solea solea larvae fed three different rotifer densities (10, 20, and 30 rotifers ml−1) from 3 to 30 days after hatching

Figure 5:Mean±SD survival rate (%) of Solea solea larvae fed three different rotifer densities (10, 20, and 30 rotifers ml−1) from 3 to 30 days after hatching.

Table 2:Average±SD of stander length Solea solea larvae fed three different densities (10, 20 and 30 rotifer ml−1) from days 3 until 30 days after hatching.

Source: Mean in the same column having different letters are significantly different (p<0.05).
Figure 6:Average±SD of stander length Solea solea larvae fed three different densities (10, 20 and 30 rotifer ml−1) from days 3 until 30 days after hatching.

Table 3:Average±SD of larval width Solea solea larvae fed three different densities (10, 20 and 30 rotifer ml−1) from days 3 until 30 days after hatching.

Source: Mean in the same column having different letters are significantly different (p<0.05).
Figure 7:Average±SD of larval width Solea solea larvae fed three different densities (10, 20 and 30 rotifer ml−1) from days 3 until 30 days after hatching.

Table 4:Average±SD of specific growth rate in relation to stander length (SGRL %days−1) and width (SGRth% days−1) Solea solea larvae fed three different densities (10, 20 and 30 rotifer ml−1) from days 3 until 30 days after hatching.

Source: Mean in the same column having different letters are significantly different (p<0.05).
Experiment 2: Optimal timing for introducing Artemia as a feed for S. solea larvae
In experiment 2, S. solea larvae were fed with Artemia from three different periods: 5 (group 1), 10 (group 2), and 15 (group 3) DAH. At 30 DAH, the FBWs of groups 1 and 2 were 10.18±0.887mg and 8.80±0.32mg, respectively. However, the FBW of group 3 was 5.38±0.63mg, which differed significantly from the other two groups (p<0.05) as shown in Table 5 and Figure 8. At 30 DAH, the WG values in groups 1 and 2 were 9.18±0.87mg and 7.80±0.32mg, respectively, whereas WG in group 3 was 4.38±0.63mg, which was significantly lower than the WG of the other groups (p < 0.05) as shown in Table 5 and Figure 9. At the end of the experiment, i.e., 30 DAH, the specific growth rate in relation to weight (SGRW) of S. solea larvae in groups 1 and 2 was 8.57%±0.33% day−1 and 8.05%±0.13% day−1, respectively. However, the SGRW in group 3 was 6.19%±0.42% day−1, which was again significantly different from the SGRW in the other groups as shown in (Table 5) and (Figure 10). At 30 DAH, the survival rates of S. solea larvae in groups 1, 2 and 3 were 77.60%±2.13%, 75.00%±1.24%, and 69.12%±7.63%, respectively, which did not differ significantly (p>0.05; as shown in Table 5 and Figure 11.
Figure 8:Average±SD of specific growth rate in relation to stander length (SGRL %days−1) and larval width (SGRth% days−1) Solea solea larvae fed three different densities (10, 20 and 30 rotifer ml−1) from days 3 until 30 days after hatching.

Table 5:Average±SD of Initial Weight, Final Body Weight (FBW), Weight Gain (WG), Specific Growth Rate in relation to Weight (SGRw) and survival rate (%) of Solea solea larvae fed artemia for three different periods 5 (group I), 10 (group II) &15 (group III) days after hatching from 3 until 30 days of hatching.

Source: Mean in the same column having different letters are significantly different (p<0.05).
Figure 9:Average±SD of Final Body Weight (FBW) of Solea solea larvae fed artemia for three different periods 5 (group I), 10 (group II) &15 (group III) days after hatching from 3 until 30 days of hatching.

Figure 10:Average±SD of Weight Gain (WG) of Solea solea larvae fed artemia for three different periods 5 (group I), 10 (group II) &15 (group III) days after hatching from 3 until 30 days of hatching.

Figure 11:Average±SD of Specific growth Rate in relation to weight (SGRw) of Solea solea larvae fed artemia for three different periods 5 (group I), 10 (group II) &15 (group III) days after hatching from 3 until 30 days of hatching.

Figure 12:Average±SD of Survival rate (%) of Solea solea larvae fed artemia for three different periods 5 (group I), 10 (group II) &15 (group III) days after hatching from 3 until 30 days of hatching.

Figure 13:Average±SD of stander length of Solea solea larvae fed artemia for three different periods 5 (group I), 10 (group II) &15 (group III) days after hatching from 3 until 30 days of hatching.

Figure 14:Average±SD larval width of Solea solea larvae fed artemia for three different periods 5 (group I), 10 (group II) &15 (group III) days after hatching from 3 until 30 days of hatching.

Figure 15:Average±SD of Specific growth rate related to stander length (SGRL%days−1) and larval width (SGRth% days−1) of Solea solea larvae fed artemia for three different periods 5 (group I), 10 (group II) &15 (group III) days after hatching from 3 until 30 days of hatching.

Figure 12 and Table 6 shows the SL of S. solea larvae throughout the experimental period. At 10 DAH (group 1) showed a significant (p<0.05) increase in SL with a value of 3.28±0.13mm compared with the SL of groups 2 and 3 (2.99±0.18mm and 3.11±0.05mm, respectively). Through the period of 15 DAH, the SL of groups 1, 2, and 3 did not differ significantly (p>0.05): 3.96±0.26 mm, 3.85±0.06mm, and 3.50±0.43mm, respectively. Through the period of 30 DAH, the SL of group 1 was significantly (p<0.05) increased (8.83±0.28mm) relative to that in groups 2 and 3 (7.70± 0.49mm and 5.38±0.28mm, respectively). Figure 13 and Table 7 shows the width of S. solea larvae throughout the experimental period. At 10 DAH, larvae in groups 1, 2 and 3 did not differ significantly (p>0.05) in terms of width (0.78 ±0.07mm, 0.70±0.03mm, and 0.71±0.03mm, respectively). Similarly, through the period of 15 DAH, groups 1, 2, and 3 showed no significant differences in width (p>0.05): 1.23±0.22mm, 1.13± 0.06mm, and 1.03±0.15mm, respectively. However, through the period 30 DAH, larvae in group 1 were significantly (p<0.05) increased in width (4.17±0.12mm) relative to larvae in groups 2 and 3 (3.63±0.16mm and 2.36±0.24mm, respectively). At 30 DAH, the SGRL for larvae in groups 1, 2 and 3 was 4.08%±0.12%, 3.57%±0.23%, and 2.24%±0.19%, respectively; thus, SGRL significantly (p<0.05) decreased from groups 1 to 3 (Figure 14). At 30 DAH, the SGR-width relationship (SGRth) in groups 1, 2 and 3 was 6.73%±0.1%, 6.22%± 0.16%, and 4.61%±0.0.37%, respectively; therefore, SGRth also significantly (p<0.05) decreased from groups 1 to 3 as shown in Table 8 and Figure 15.
Table 6:Average±SD of Stander length of Solea solea larvae fed artemia for three different periods 5 (Group I), 10 (Group II) &15 (Group III) days after hatching from 3 until 30 days of hatching.

Source: Mean in the same column having different letters are significantly different (p<0.05).
Table 7:Average±SD larval width of Solea solea larvae fed artemia for three different periods 5 (group I), 10 (group II) &15 (group III) days after hatching from 3 until 30 days of hatching.

Source: Mean in the same column having different letters are significantly different (p<0.05).
Table 8:Average±SD of specific growth rate related to stander length (SGRL%days−1) and larval width (SGRth% days−1) of Solea solea larvae fed artemia for three different periods 5 (group I), 10 (group II) & 15 (group III) days after hatching from 3 until 30 days of hatching.

Source: Mean in the same column having different letters are significantly different (p<0.05).
Discussion
In the present study, S. solea larvae fed three different rotifer densities (10, 20 and 30 rotifers ml−1) showed no significant difference in FBW, WG and SGR, but survival rate significantly increased with increasing rotifer density. Additionally, the SL and width of larvae significantly increased with rotifer density at 30 DAH. In agreement with our findings, Zhenhua [13] reported that prey density had a significant effect on the growth of pompano larvae, whereas larvae fed 1 rotifer or 40 rotifers ml−1 showed significantly lower SGR and survival than those fed 10 or 20 rotifers ml−1. Additionally, during a period of cofeeding with copepod nauplii and rotifers, rotifer densities significantly affected prey selectivity in larvae. Additionally, Ruzicka [16] found that the survival rates of fish fed 1 rotifer ml−1 were lower than those fed 10 and 20 rotifers ml−1. Taken together, these results suggest that low prey density, e.g., 1 rotifer ml−1, has negative effects on the ontogenetic development of fish larval, which is supported by early studies showing that larvae experiencing low prey density must expend more energy searching for prey and swimming. Curnow [17] explored the survival, growth and stress tolerance of barramundi (Lates calcarifer) larvae reared from 2 to 28 DAH using different protocols that progressively excluded live feeds (rotifers and Artemia). They found that the best protocol for rearing barramundi larvae involved feeding enriched rotifers from initial exogenous feeding to 3 days after the initiation of stomach differentiation at 5 mm SL and including supplemental levels of enriched Artemia from 5 mm SL to after metamorphosis at 12mm SL.
In our second experiment, larvae in groups 1 and 2, which were fed with Artemia from 5 and 10 DAH, respectively, showed significantly increased WG, FBW, and SGR rate relative to group 3 (fed with Artemia from 15 DAH). By contrast, no significant difference in survival rates was detected among these three S. solea larval groups. In agreement with our results, Villalta [14] found that Senegal sole larvae fed with rotifers for the first 10 DAH and enriched with Artemia metanauplii from 6 to 30 DAH showed increased growth, in terms of individual dry weight and total length, particularly compared with larvae fed with rotifers alone. However, the authors reported no significant differences in survival rates among differently fed groups. In another study, Marın-Magan [18] reported that S. senegalensis selected rotifers over Artemia nauplii up to day 7 of culture as their initial feed. In other studies, Dinis [19] and Cañavete [20] stated that Artemia sp. was a better feed for S. senegalensis postlarvae than the standard weaning diet produced by the Laboratory of Aquaculture & ARC, University of Gent, Belgium (ICES®), as evidenced by the higher growth and survival values. Higher survival rates were also reported in comparison to values previously reported for senegalese sole fed with Artemia sp. Similarly, Ribeiro [15] reported significantly higher survival and dry weight in postlarvae fed with Artemia compared with those fed with an ICES diet.
Villalta [14] showed the larvae of Senegal sole were able to capture enriched metanauplii after mouth opening without any differences in survival when compared with larvae that were fed with rotifers. When enriched metanauplii were present in sufficient quantity, larval development and growth appeared faster than in larvae fed with rotifers during the first 10 DAH. Bell [21] stated that for industrial purposes, enriched Artemia metanauplii could be used as a starter feed for larvae of senegal sole to provide sufficient survival and growth. However, in nutritional studies, the problems encountered in enriching the metanauplii with adequate amounts of docosahexaenoic acid, high-unsaturated fatty acids, or phospholipids must be considered and rotifers should be provided. Rotifers, in contrast to Artemia metanauplii, accrue essential fatty acids and phospholipids at similar compositions to those of copepods, i.e., the natural larval prey in wild environments. By contrast, Imsland [3] stated that feeding S. senegalensis larvae with Artemia nauplii as a first feed did not affect survival, growth, or amino acid composition. Chang [22] stated that tongue sole Cynoglossus semilaevis, an inshore fish in China, has shown great potential in aquaculture recently. However, poor survival was recorded during the period of weaning from live Artemia to artificial diets. In experiments in which C. semilaevis larvae were fed various diets from 6 DAH, mixed diets of commercially formulated feed and live prey (Artemia and rotifers) allowed the larvae to complete metamorphosis, achieving similar survival and SGR when compared with larvae fed with live feed alone. However, in metamorphosed fish, when live feed was withdrawn at 31 DAH, a significant difference in survival and growth emerged among treatments: in general, those fish previously fed mixture diets during larval stages had higher survival and SGR than those fish previously fed with live feed after weaning. Thus, weaning C. semilaevis from early development appears to be feasible and larval cofeeding improves survival and growth. Aljilany [23] also reported that S. aegyptiaca postlarvae fed with Artemia had better growth performance and survival rates than those fed with an artificial diet.
Conclusion
In conclusion, we found that feeding a high density of rotifers (30 rotifers ml−1) to S. solea larvae rather than a low density (10 rotifers ml−1) significantly increased the survival rate, SL, and width of the larvae. Additionally, introducing Artemia in the first stage after hatching (5 DAH) rather than later (10 and 15 DAH) significantly increased S. solea larval growth rate, SL, and width [24].
References
- Quero JC, Desoutter M, Laggardere F (1986) Fishes of the North-eastern Atlantic and the Mediterranean III/. In: Whithead PJP, Bauchot ML, Hureau JC, Nielsen J, Tortonese E, (Eds.), Paris, pp. 1308-1328.
- Jardas I (1996) Adriatic Ichthyofauna?. Skolska Knjiga, Zagreb, p. 536.
- Imsland AK, Foss A, Conceicao LEC, Dinis MT, Delbare D, et al. (2003) A review of the culture potential of Solea solea and senegalensis. Rev Fish Biol Fisher 13: 379-407.
- Morais S, Aragão C, Cabrita E, Conceição LEC, Constenla M, et al. (2014) New developments and biological insights into the farming of Solea senegalensis reinforcing its aquaculture potential. Rev Aquaculture 8(3): 227-263.
- (2015) Genral Authority for fish Resources Development (GAFRD). Fish statistics year book.
- Gaber HR, Ahmed AL, Hare M (2003) Aquaculture potential of the flat fish Solea vulgaris in Egypt. J Egypt Acad Soc Environ Devel Aquaculture 4(2): 157-470.
- Zaki ML, Hamza AK (1986) Reproductive biology and induced spawning Solea solea (L.) in Egypt. Bull Nat Inst Ocean Fish (Egypt) 12: 115-125.
- Assem SS, El-Dahhar AA, El-Sayed HS, Salama M, Mourad MM (2012) Induced spawning, embryonic and larval developmental stages of Solea vulgaris in the Mediterranean water. J Arab Aquaculure Soc 7(1): 51-74.
- Assem SS, Srour TM, Mourad MM, Mansour AT, Sharaf HR (2019) Oogenesis and spermatogenesis of the common sole, Solea solea, from the Mediterranean Sea, Abu Qir Bay, Alexandria, Egypt: Biological, Histological and Ultrastructural Approaches. Mediterranean Aquaculture Journal 11: 11-33.
- Slembrouck J, Baras E, Subagja J, Hung LT, Legendre M (2009) Survival, growth and food conversion of cultured larvae of Pangasianodon hypophthalmus, depending on feeding level, prey density and fish density. Aquaculture 294(1-2): 52-59.
- Engrola S, Conceica LEC, Dias L, Pereira R, Ribeiro L, et al. (2007) Improving weaning strategies for Senegalese sole: effect of body weight and digestive capacity. Aquac Res 38(7): 696-707.
- Roca CY, Main KL (2012) Improving larval culture and rearing techniques on common snook (Centropomus undecimalis). Raising rotifers for use in aquaculture. Hydrobiologia 147: 188-216.
- Zhenhua MH, Guo DZ, Chaoqun H, Shigui J (2015) Food ingestion, consumption and selectivity of pompano,Trachinotus ovatus (Linnaeus 1758) under different rotifer densities. Aquaculture Research 46(11): 2593-2603.
- Villalta M, Alici AV (2005) Culture of Senegal sole larvae without the need for rotifers. Aquaculture Intern 13: 469-478.
- Ribeiro LJ, Zambonino-Infante L, Cahu C, Dinis MT (2002) Digestive enzymes profile of Solea senegalensis post larvae fed artemia and a compound diet. Fish Physio and Biochem 27: 61-69.
- Ruzicka JJ, Gallager SM (2006) The importance of the cost of swimming to the foraging behavior and ecology of larval cod (Gadus morhua) on Georges bank. Deep-Sea Research Part II-Topical studies in Oceano. 53(23-24): 2708-2734.
- Curnow J, King J, Bosman’s J, Kolkovski S (2006) The effect of reduced Artemia and rotifer use facilitated by a new microdiet in the rearing of barramundi Lates calcarifer (BLOCH) larvae. Aquaculture 257(1-4): 204-213.
- Marın-Magan V, Anguıs V, Canavate JP (1995) Selective feeding and prediction of food consumption in sole larvae Solea senegalensis reared on the rotifer Brachionus plicatilis and Artemianauplii. In: Lavens P, Jaspers E, Roelants Y, (Eds.), Larvi’95. Fish and Shellfish Larviculture Symposium. Eur Aquac Society, 24: 443-447.
- Dinis MT (1992) Aspects of the potential of Solea senegalensis Kaup for aquaculture: Larval rearing and weaning to an artificial diet. Aquaculture Research 23(4): 515-520.
- Cañavate JP, Fernández-Díaz C (1999) Influence of cofeeding larvae with live and inert diets on weaning the sole Solea senegalensis onto commercial dry feeds. Aquaculture 174(3-4): 255-263.
- Bell JG, McEvoy LA, Estevez A, Shields RJ, Sargent JR (2003) Optimising lipid nutrition in first-feeding flatfish larvae. Aquaculture 227(1-4): 211-220.
- Chang Q, Liang MQ, Wang JL, Chen SQ, Zhang XM, et al. (2006) Influence of larval co-feeding with live and inert diets on weaning the tongue sole Cynoglossus semilaevis. Aquaculure Nutrition 12(2): 135-139.
- Aljilany SA, Mohammed RA, Saleh HHE, Allam SM, Abou-Zied RM (2016) Effect of stocking density, photoperiod and feeding on poultry egg on growth and development of the Egyptian sole (Solea aegyptiaca chabanaud, (1927) larvae. Abbassa Int J Aquaculure 9(1): 135-170.
- Sharaf HER (2018) Biological and histological studies on Solea brood stock and improvement of larval growth performance. Alexandria University, Egypt.
© 2022 Abdallah Tageldein Mansour. This is an open access article distributed under the terms of the Creative Commons Attribution License , which permits unrestricted use, distribution, and build upon your work non-commercially.
Editor In Chief


.jpg)


Signup for Newsletter

Quick Links
 Editorial Board Registrations
 Submit your Article
 Refer a Friend
 Advertise With Us
Our Recent Edition

.jpg)


Top Editors


.jpg)


.bmp)
.jpg)
.png)
.jpg)


.jpg)


.png)

.png)


.png)


Financial Support

Sponsors

Latest e-Books

Latest Video

 a Creative Commons Attribution 4.0 International License. Based on a work at www.crimsonpublishers.com.
Best viewed in
a Creative Commons Attribution 4.0 International License. Based on a work at www.crimsonpublishers.com.
Best viewed in