- Submissions

Full Text
Examines in Marine Biology & Oceanography
Behaviors of the Tropical Pacific Barrier Layer during ENSO Events and its Mechanism
Ai-Jun PAN*, Chang-Shuo LIANG and Xiao-Fang WAN
Third Institute of Oceanography, MNR, China
*Corresponding author: Ai-Jun Pan, Ocean Dynamics Lab, Third Institute of Oceanography, Ministry of Natural Resources, China
Submission: November 10, 2021;Published: December 07, 2021

ISSN 2578-031X Volume4 Issue4
Abstract
By using gridded Argo data from 2004 to 2017, a systematic comparison study is conducted on the evolution features of the tropical Pacific Barrier Layer (BL) between El Niño and La Niña (ENSO) period. As of climatology, the BL in the tropical Pacific Ocean presents three distinctive zonal bands at about 12° N, 5° N, 10° S, separately, extending from the western Pacific warm pool eastwards to the eastern Pacific Ocean. Among them, the BL (>20m) in the warm pool occurs throughout the whole calendar year, whilst the BL at both 12° N and 10° S bands exist mostly often in Winter and Summer periods Composite analysis reveals that the ENSO-relevant BL variations are largely confined within the equatorial Pacific west of 160° W. Specifically, overwhelming thick (thin) BL occurs east of 160° E during El Niño (La Niña) year, respectively. It is deduced that the heavy rainfall, horizontal transport of low saline water and downwelling Kelvin waves are three main contributors for the unusual thick BL occurrence east of 160° E during the El Niño period. Correlation diagnosis verifies that the interannual BL changes lags the Nino 3.4 index by one month. Conversely, the BL variability leads the Nino 3.4 index by one month for the La Niña event and anomalous thickening of the Isothermal Layer (IL) triggered by water convergence and subduction is believed to be the main cause for the abnormally thick BL emergence west of 160° E.
Keywords: Barrier layer; El Niño-southern oscillation; Rainfall; Ocean advection; Kelvin wave
Abbreviations: IL: Isothermal Layer; ENSO: El Niño-Southern Oscillation; BL: Barrier Layer; NCEP: National Environmental Prediction Center; NCAR: National Atmospheric Environment Center; CPC: Climate Prediction Center; OLR: Outgoing Longwave Radiation; MLD: Mixed Layer; BLT: Barrier Layer Thickness; SPCZ: South Pacific Convergence Zone; ITCZ: Intertropical Convergence Zone
Introduction
Tropical Pacific Ocean is the main heat source of the earth-atmosphere system, which
can provide abundant latent and sensible heat for the global climate. It has not only seasonal
changes, but also obvious interannual and interdecadal changes cane [1]. The El Niño-Southern
Oscillation (ENSO), as the most significant interannual variation signal in the tropical Pacific,
can have a significant impact on global climate and human activities through large-scale
ocean-atmosphere interactions and teleconnections [2,3]. Because of vertical mixing, the
upper ocean usually forms vertically uniform isothermal layer, isohaline layer and isopycnal
layer at above surface. Beneath them lies the so-called thermocline, halocline and pycnocline,
respectively, with significant vertical gradient changes. In most cases, depth of the isothermal
layer and the isopycnal layer are approximately equal. Since 1990s, however, with the more
salinity observations, [4] found that the depth of the upper boundary of the thermocline is
obviously deeper than the upper boundary of the pycnocline, and the water layer between
the bottom of the isopycnal layer and the top of the thermocline is thereafter named as Barrier Layer (BL). Because of the uniformly vertical distribution
of temperature within the BL, the vertical transport of sea surface
heat flux downward to the ocean interior is effectively inhibited,
so that the heat inside the mixed layer and the thermocline cannot
exchange effectively [5].
Likewise, the appearance of thick BL weakens the cooling
effect of the thermocline cold water entrainment upwards into the
mixed layer and as a result, coupling between the atmosphere and
the ocean is seriously suppressed [6,7]. Moreover, with formation
of the BL, the salinity stratification not only hinders the upward
entrainment of cold water into the thermocline, but also traps
energy of external wind disturbance within the fresh surface layer
[8,9] revealed that the BL plays an important role in the storage of
heat in the western equatorial Pacific through coupling model, and
most importantly, the accumulation of heat in the western equatorial
pacific is a premise for El Niño excitation. Besides, the BL is generally
believed to play a positive role in the development of the tropical
cyclone by suppressing vertical mixing and reducing sea surface
cooling Balaguru [10]. However, Yan [11] put forward a different
point that the BL may play a totally different role in affecting the
tropical cyclone. Since previous studies on the characteristics and
variation patterns of the BL are mainly performed by short-term
data (CTD, anchors) in the tropical Pacific, relationships between
the BL and ENSO events are not well acknowledged. Therefore, this
paper attempts to launch an in-depth investigation on the evolution
characteristics of tropical Pacific BL during different types of ENSO
events.
Data and Methodology
Data
The temperature and salinity data are taken from the Global Ocean Argo (BOA_ Argo) grid dataset provided by the China Real-time Information Center [12]. It spans from January 2004 to December 2017, with 1°x1° horizontal grid and vertically 58 standard layers (0-2000dbar). Precipitation data is of CMAP provided by the National Oceanic and Atmospheric Administration of the United States [13]. The time span is from January 2004 to December 2017, with spatial resolution of 2.5°×2.5°. Outgoing Longwave Radiation (OLR) data is obtained from satellite observations by the National Oceanic and Atmospheric Administration of the United States [14]. It lasts from January 2004 to December 2017, with spatial resolution of 2.5°x2.5°. Surface wind stress and flow field data are derived from the Global Ocean Data Assessment System provided by the National Environmental Prediction Center of the United States [15]. The time span is from January 2004 to December 2017 with spatial resolution of 1°x(1/3)° (longitude latitude. Flow field data at 5m is selected as the sea surface flow field. Wind field data is from the National Environmental Prediction Center/National Atmospheric Environment Center (NCEP/NCAR) reanalysis data [16], with spatial resolution of 2.5°x 2.5° and 17 vertical layers as 1000, 925, 850, 700, 600, 500, 400, 300, 250, 200, 150, 100, 70, 50, 30, 20, 10hpa. The ENSO index selects the Nino3.4 of the Climate Prediction Center (CPC) and which, is defined as the abnormal average SST of the equatorial mid-East Pacific (5° S-5° N,170°-120° W).
Methodology
For the BL calculation, firstly, the temperature and salinity data within upper 300m are linearly interpolated to 1m intervals. Secondly, as is well known, both of depths of the Isothermal Layer (ILD) and the Mixed Layer (MLD) are needed. Usually, there are gradient method and threshold method for recommendation. Gradient method is suitable for single station observation data with high vertical resolution (such as CTD), whilst threshold method is favorable for gridded data with lower vertical resolution. Therefore, threshold methods of [17,18] are adopted in this work. With 10m taken as the reference layer, ILD temperature threshold is set as ΔT=-0.2 °C. MLD is calculated with Δσθ=σθT10+ΔT, S10, P0−σθT10, S10, P0, where T10, S10, P0, σθ denotes temperature and salinity at 10m, pressure at sea surface, potential density, respectively. As a result, the Barrier Layer Thickness (BLT) is defined as follows: BLT=ILDMLD.
Result
Seasonal distribution of the BL
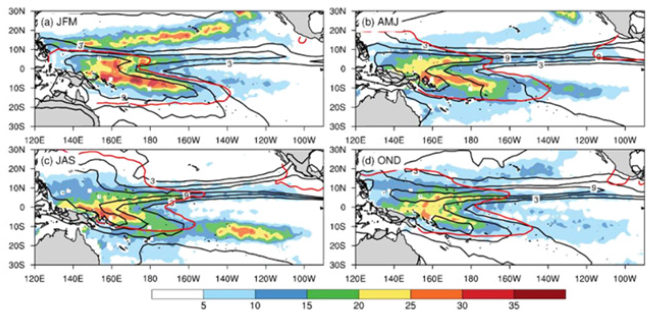
Figure 1 shows the seasonal distribution of the BL in the tropical Pacific ocean. There are permanently thick BL In the western Pacific warm pool regime throughout the calendar year. The thickness of the BL is larger than 20m, frequently accompanied by strong rainfall (greater than 6mm/d) occurrence. In winter, thick BL is mainly located within 10° S - 5° N in the western Pacific and which, is in accordance with the position of the South Pacific Convergence Zone (SPCZ). Besides, a band of thick BL between 10°-20° N stretching from western Pacific to eastern Pacific can be identified, which is over 25m and not usually witnessed in other seasons. However, this latitudinal zone is not in the Intertropical Convergence Zone (ITCZ)-induced precipitation region (Figure 1a), meaning that rainfall is not responsible for the occurrence of the thick BL. Whilst, combined Ekman advection of equatorial freshwater and subduction of subtropical subsurface high saline water were proved to be two main causes [19]. The BL near 15° N becomes thin and gradually 121 retreats westwards in spring, at the meantime, the BL at 10° S begins to extend 122 eastwards and thickens slowly. The BL at 15° N nearly vanishes in summer, whilst the 123BL adjacent to 10° S extends eastward to 100° W and reaches its maxima thickness of 124 about 30m within 140°-120° W ranges. Pioneering studies indicated that the BL in the 1253º~8º S zone is resulted from both subduction of the Southern Equatorial Current and 126 thinning of the mixed layer due to freshening of the surface water. And the freshening 127 of the surface water is deduced to be mainly caused by the heavy precipitation and the 128 eastward flowing low saline equatorial jet Vialard [8]. Overall, the 129 latitudinal zone of the two BLs (15° N & 10° S) shows obvious seasonality.
Figure 1: Seasonal distribution of the BLD in the tropical Pacific (shaded, unit: m). a. Winter (January-March), b. Spring (April-June), c. Summer (July-September), d. Autumn (October-December). Where the red line represents 28.5C isotherm and contours denote the precipitation with CI of 3mm/d (unit: mm/d).
Comparative analysis of the BL between El Niño and La Niña period
The Nino 3.4 index is adopted from the United States Climate Center (CPC) and for which, 2004, 2009, 2015 are defined as El Niño years, 2007, 2008, 2010 and 2011 are taken as La Niña years. (Figures 2&3) shows the synthetic distribution of atmospheric and oceanic variables for two different type ENSO events. During El Niño period, negative SSS anomalies occurs mostly in western equatorial Pacific, meaning SSS freshens between 160° E-180°. Whilst a positive SSS anomaly emerges in equatorial western Pacific (150° E-180°) for La Niña years.
Figure 2: Composites of the BLT anomaly (a and b, unit: m), SST anomaly (c and d, unit: C), and SSS anomaly (e and f, unit: Psu) in the tropical Pacific for the El Niño (left panel) and La Niña (right panel) events. The black line and red line indicates the contours of 34.8psu, 28.5oC, respectively.
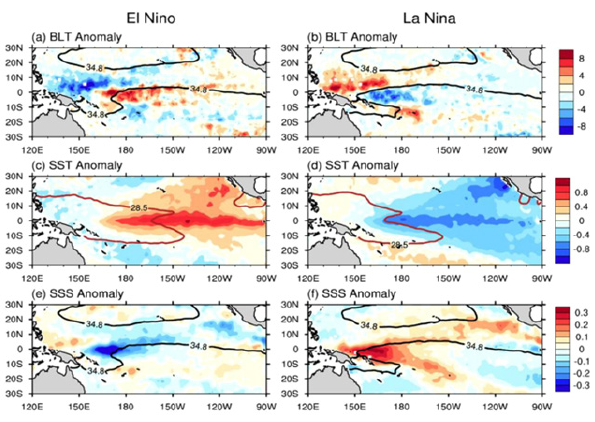
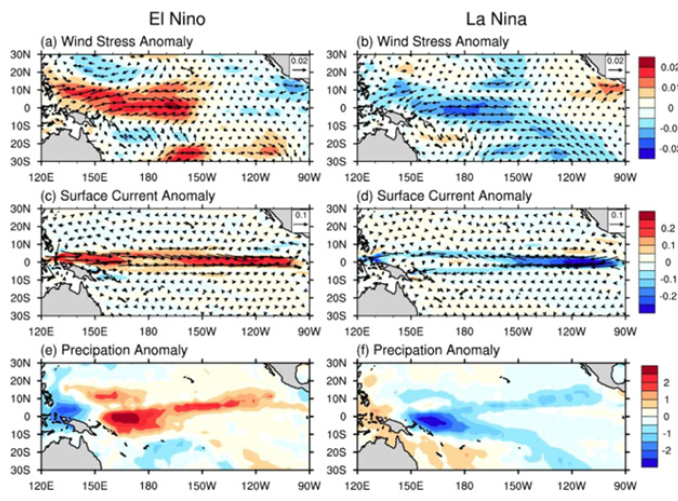
Figure 3: Composites of the wind stress anomaly (a and b, shading represents zonal wind stress anomaly, unit: N/m2), surface current anomaly (c and d, shading represents zonal surface current anomaly, unit: m/s), and precipitation anomaly (e and f, unit: mm/d) in the tropical Pacific for the El Niño (left panel) and La Niña (right panel) events.
Correspondingly, a rarely thick BL lies in equatorial regime
east of 160° E and exceptionally thin BL occurs west of 160° W for
El Niño years. As to La Niña years, abnormally thin BL happens
east of 160° E and extremely thick BL occurs west of 160° W.
Comparatively, biggest differences in the wind stress happens in
the western equatorial Pacific between El Niño and La Niña events.
The westerly stress anomaly extends from the western equatorial
Pacific eastward across the dateline to 150° Wm during El Niño
period, meanwhile, a weak easterly stress anomaly is detected
in the eastern pacific (Figure 3a). Correspondingly, the eastward
ocean current anomaly covers almost the entire equatorial Pacific,
with anomalous zonal flow reaches about 30cm/s (Figure 3c).
Conversely, the zonal easterly stress anomaly occupies the entire
equatorial west, central Pacific and most of the south Pacific
(Figure 3b) and in accordance, a westward zonal flow occurs in the
equatorial Pacific during La Niña days (Figure 3d).
The occurrence, development and vanish of the BL are directly
linked with the evolution of MLD and ILD. For a thick BL, its
formation often involves many contributors such as weak wind,
heavy rainfall, horizontal advection, vertical shear of zonal flow
and even oceanic wave processes Bosc et al. [17]. Apparently,
deeper thermocline in eastern equatorial Pacific (positive ILDA)
and shallower thermocline in western equatorial Pacific (negative
ILDA) can be found during El Niño period. It is totally reversed
for La Niña days. For El Niño event, the extremely thick BL (>8m)
appears in the equatorial Pacific east of 160° E and is mainly caused
by abnormal thinning of the MLD. Comparatively, the abnormally
thick BL (>8m) occurs west of 160° E during La Niña period and
which, is believed to be induced by the unusually thick ILD (Figure
2).
Furthermore, westerly stress anomaly is found to be strongest
adjacent to 170°W, in accordance with much shallower ILD and MLD
for El Niño event. Vialard and Delecluse [6,8] pointed out BL changes
could be modulated by oceanic Kelvin waves, that is, upwelling
Kelvin wave tends to thin the BL, whilst downwelling Kelvin wave
is apt to thicken the BL. Since strong westerly stress anomaly will
induce abnormal surface Ekman convergence to deepen the ILD,
the shallower ILD can be attributed to the upwelling cold Kelvin
wave emanating from the reflection of Rossby wave at the western
boundary [20]. Moreover, deduced from the negative feedback
theory of delayed oscillators, the westerly wind anomaly can
excite eastward warm (downwelling) Kelvin wave and westward cold [21,22]. After the Rossby wave hit west boundary, it will be
turned into eastward cold (rising) Kelvin wave and as a result, the
ENSO phase is converted. Meanwhile, the westerly wind anomaly
can trigger changes of the eastward equatorial current (Figure 3c)
and transport low saline water from far western equatorial Pacific
eastward to the dateline, in conjunction with heavy rainfall there
(Figure 3e), further freshen water within 160° E~160° W regime
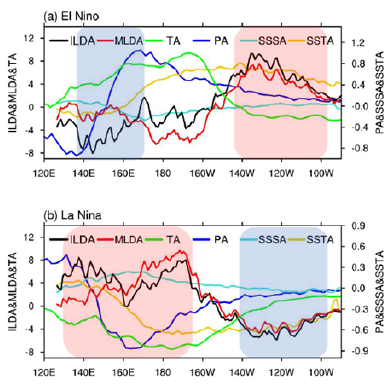
(Figures 2e&4a) and leads much shallower MLD than ILD. (Figure
4a) also demonstrates that ML is much shallower than IL east of
160°E and is favorable for thicker BL occurrence within 160°
E-160° W.
Meanwhile, the unusually thick BL is found to be adjacent to
the salinity front (34.8psu) (Figure 2a). By contrast, on one hand,
easterly stress anomaly will cause anomalous westward equatorial
zonal current during La Niña period (Figure 3d), transporting cold,
saline water from the eastern Pacific westward to the equatorial
western Pacific. On the other hand, the easterly stress anomaly
will enhance the Southern Equatorial Current (SEC), carrying
more saline, cold water westwards and converging with the warm,
fresh water in the western Pacific. The resulted water sinking,
and vertical shear significantly deepens the IL, in accordance with
the downwelling Kelvin wave. At the same time, although with
unusually low precipitation (Figure 3f), more saline sea surface
(Figure 2f) and enhanced vertical mixing, the ML does not change
much, leading to much deeper IL than ML at west of 160° E (Figure
4b).
Figure 4: Latitudinal distributions of the ILD anomaly (ILDA, unit: m), MLD anomaly (MLDA, unit: m), zonal wind stress anomaly (TA, unit: 210-3N/m2), SSS anomaly (SSSA, unit: psu), SST anomaly (SSTA, unit: °C) and precipitation anomaly (PA, unit: 2mm/d) along the equatorial Pacific (band-averaged between 5°N and 5°S ) for the El Niño (a) and La Niña (b) events, where the Red & Blue shaded zone denotes the thickened & thinned regime of the ILD, respectively.
As a result, extremely thick BL is to be formed within 130°-160°
E. It’s worth noted that the BL is a result from mutual interactions
of the ML and the IL variations, testified to be influenced by various
dynamic and thermodynamic processes. It is suggested that ML
changes play a vital role in the formation of the thick BL east of 160°
E during El Niño period, whilst IL variations are the main causes
for the thick BL occurrence west of 160° E for La Niña event. Above
studies indicates that BL distribution has prominent locality, that is,
bounded by about 160° E, exceptionally thick (thin) BL occurs seesaw
alike for El Niño (La Niña) events. It shows that Nino 3.4 index
lags about one month than the BL of western equatorial Pacific and
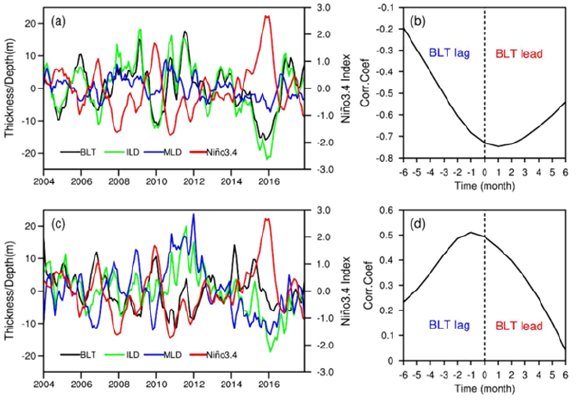
they are largely inverse phase changed (Figure 5ab). The maximum
negative correlation coefficient reaches about -0.75 and passes the
95% significance test, revealing responses to ENSO occurs firstly in
the subsurface of equatorial western Pacific.
It also confirmed importance of the BL in the western Pacific
for ENSO excitation. Furthermore, relative contributions of the
MLD and ILD to BLT are discriminated using regression analysis.
For western equatorial Pacific, the regression coefficients between
MLD and ILD to BLT are 0.11 and 1.11, respectively, suggesting that
interannual variations of the BL variability is mostly triggered by
the IL changes. As to eastern equatorial Pacific, BL changes is almost
in phase with Nino3.4 index (Figure 5c). When the BL lags Nino 3.4
index by one month, it shows the maximum positive correlation of
0.51 (Figure 5d). Moreover, regression coefficients of the MLD and
ILD to the BLT are -0.76 and 0.24, respectively, meaning that the BL
variations is largely excited by the ML disturbances.
Figure 5: Anomaly of BLT (black line), ILD (green line) and MLD (blue line) averaged in a. western (130°-160°E, 5°S-5°N) and c. eastern (160°E-170°W, 5°S-5°N) equatorial Pacific, with Nino3.4 index (red line) being superimposed. b and d denotes the lead/lag correlations between BLT anomaly and Nino 3.4 index.
Conclusion
By employing comparative study of the BL behaviors between El Niño and La Niña period, different dynamic and thermodynamic processes responsible for the BL formation are identified and diagnosed. It is revealed that interannual changes of the BL in the equatorial Pacific are tightly linked with ENSO evolution. Most ENSO-relevant BL variations are confined to the equatorial Pacific west of 160° W. Exceptionally thick (thin) BL is located east of 160° E and abnormally thin (thick) BL is found west of 160° E for El Niño (La Niña) events, respectively. During El Niño period, the MLD anomaly caused by heavy rainfall, horizontal transport of low saline water and downwelling Kelvin wave is responsible for the occurrence of the abnormally thick BL east of 160° E, whilst the ILD anomaly induced by water convergence and subduction is believed to be the main cause for the thick BL west of 160° E during La Niña days. Further diagnosis suggest that the BL distributes locally and spatially uneven in the equatorial Pacific. For the western (130°- 160°E, 5°S-5°N) equatorial Pacific, responses to ENSO are detected firstly in the subsurface equatorial western Pacific, confirming impacts of the BL on ENSO excitation. Most importantly, it is found that BL changes is mainly modulated by MLD variations in the eastern (160°E-170°W, 5°S-5°N) equatorial Pacific, whilst ILD plays a leading role in influencing the BL variability for the western (130°-160°E, 5°S-5°N) equatorial Pacific.
Acknowledgement
References
- Cane MA (1998) Climate change: A role for the tropical pacific. Science 282: 59-61.
- Trenberth KE (1976) Spatial and temporal variations of the southern oscillation. QJ Roy Meteor Soc 102(433): 639-653.
- Timmermann A, Soon-I An, Jong-Seong K, Fei-Fei J, Wenju C, et al. (2018) El Niño-Southern oscillation complexity. Nature 559: 535-545.
- Lukas R, Lindstrom E (1991) The mixed layer of the western equatorial Pacific Ocean. J Geophys Res-Oceans 96(1): 3343-3357.
- Montégut CB, Madec G, Fischer AS, Alban L, Daniele I (2004) Mixed layer depth over the global ocean: An examination of profile data and a profile-based climatology. J Geophys Res-Oceans 109(12).
- Vialard J, Delecluse P (1998) An OGCM study for the TOGA decade. Part I: Role of salinity in the physics of the western Pacific fresh pool. J Phys Oceanogr 28(6): 1071-1088.
- Maes C, Picaut J, Belamari S (2002) Salinity barrier layer and onset of El Niño in a Pacific coupled model. Geophys Res Lett 29(24): 2206.
- Vialard J, Delecluse P (1998b) An OGCM study for the TOGA decade. Part II: Barrier layer formation and variability. J Phys Oceanogr 28(6): 1089-1106.
- Maes C, Ando K, Delcroix T, Kessler WS (2006) Observed correlation of surface salinity, temperature and barrier layer at the eastern edge of the western Pacific warm pool. Geophys Res Lett 33(6).
- Balaguru K, Chang P, Saravanan R, Ruby LL, Zhao X, et al. (2012) Ocean barrier layers effect on tropical cyclone intensification. Proc Natl Acad Sci USA 109(36): 14343-14347.
- Yan Y, Li L, Wang C (2017) The effects of oceanic barrier layer on the upper ocean response to tropical cyclones. J Geophys Res-Oceans 122(6): 4829-4844.
- Lu SL, Liu ZH, Li H (2019) User manual of global ocean argo gridded datasets (BOA_Argo).
- Xie P, Arkin PA (1997) Global precipitation: A 17-year monthly analysis based on gauge observations, satellite estimates, and numerical model outputs. Bull Amer Meteor Soc 78(11): 2539-2558.
- Liebmann B, Smith CA (1996) Description of a complete (interpolated) outgoing longwave radiation dataset. Bull Amer Meteor Soc 77(6): 1275-1277.
- Behringer DW, Xue Y (2004) Evaluation of the global ocean data assimilation system at NCEP: The Pacific Ocean. American Meteorological Society 84th Annual Meeting, pp. 11-15.
- Kalnay E, Kanamitsu M, Kistler R, Collins W, Deaven D, et al. (1996) The NCEP/NCAR 40-year reanalysis project. Bull Amer Meteor Soc 77(3): 437-470.
- Bosc C, Delcroix T, Maes C (2009) Barrier layer variability in the western Pacific warm pool from 2000 to 2007. J Geophys Res-Oceans 114(6): C06023.
- Montégut CB, Mignot J, Lazar A, Cravatte S (2007) Control of salinity on the mixed layer depth in the world ocean: 1. General description. J Geophys Res 112: C06011.
- Sato K, Suga T, Hanawa K (2004) Barrier layer in the North Pacific subtropical gyre. Geophys Res Lett 31: 325-341.
- Wang X, Liu H (2016) Seasonal-to-interannual variability of the barrier layer in the western Pacific warm pool associated with ENSO. Clim Dyn 47(1-2): 375-392.
- Suarez MJ, Schopf PS (1988) A delayed action oscillator for ENSO. J Atmos Sci 45(21): 3283-3287.
- Battisti DS, Hirst AC (1989) Interannual variability in a tropical atmosphere-ocean model: Influence of the basic state, ocean geometry and nonlinearity. J Atmos Sci 46(12): 1687-1712.
© 2021 Ai-Jun P. This is an open access article distributed under the terms of the Creative Commons Attribution License , which permits unrestricted use, distribution, and build upon your work non-commercially.
 a Creative Commons Attribution 4.0 International License. Based on a work at www.crimsonpublishers.com.
Best viewed in


.jpg)


 Editorial Board Registrations
 Submit your Article
 Refer a Friend
 Advertise With Us
.jpg)


.jpg)


.bmp)
.jpg)
.png)
.jpg)


.jpg)


.png)

.png)


.png)


