- Submissions

Full Text
Examines in Marine Biology & Oceanography
Pigment-Based Chemotaxonomy of Seagrass Epiphyte Communities; Variables to Consider and uses in Ecosystem Assessment and Monitoring
J William Louda1*, Alya G Singh White1,2 and Annabelle ML Brooks3
1Department of Chemistry and Biochemistry and the Environmental Sciences Program, USA
2Currently: TMDL Section USEPA REGION-4, USA
3The Cape Eleuthera Institute of The Island School, Bahamas
*Corresponding author: J William Louda, Department of Chemistry and Biochemistry and the Environmental Sciences Program, Florida Atlantic University, Boca Raton, Florida, USA
Submission: September 1, 2021;Published: October 22, 2021

ISSN 2578-031X Volume4 Issue3
Abstract
This paper presents pigment-based chemotaxonomy as a rapid method for the analysis of seagrass
epiphyte communities and how that data may be applied to the assessment of the full seagrass ecosystem.
Pigments-based chemotaxonomy uses diagnostic pigments to determine the biomass, using chlorophyll-a
as a proxy, of microalgal taxa within phytoplankton or epiphyte communities. Seagrass samples were
taken from Florida Bay, USA and around the southern tip of Eleuthera Island in the Bahamas.
Data is presented which reveals.
A. The need for care during sampling in order to avoid losing epiphytes due to sloughing,
B. Consideration of the exact site of sampling with a given area,
C. Variations in epiphyte production and community makeup with respect to time of year,
D. Epiphyte loading variations along the length of a seagrass blade,
E. Potential effects of light (top-down) and grazing (bottom-up) on epiphyte communities,
F. The importance of diatoms on the seagrasses and macro-algae of Florida Bay,
G. The use of epiphytometers to monitor epiphyte production versus time, and
H. The strong variation in epiphyte communities around the southern tip of Eleuthera Island.
All of these results and discussion are presented in order to reveal the application of pigment-based
chemotaxonomy and epiphytometers (aka fake seagrass) in the assessment of seagrass epiphyte
communities
Keywords: Epiphytometers; Biodiversity; Atmospheric; Seagrass; Epiphyte; Cyanobacteria
Introduction
The report by Orth et al. [1] entitled “A Global Crisis for Seagrass Ecosystems” under the auspices of the Global Seagrass Trajectories Working Group of the National Center for Ecological Analysis and Synthesis, as supported by the National Science Foundation, had the following within its abstract:
“Seagrasses, marine flowering plants, have a long evolutionary history but are now challenged with rapid environmental changes as a result of coastal human population pressures. Seagrasses provide key ecological services, including organic carbon production and export, nutrient cycling, sediment stabilization, enhanced biodiversity, and trophic transfers to adjacent habitats in tropical and temperate regions. They also serve as “coastal canaries,” global biological sentinels of increasing anthropogenic influences in coastal ecosystems, with large-scale losses reported worldwide.”
“The epiphytic algae of seagrasses are important primary producers in seagrass ecosystems and make a significant contribution to food webs”[1]. Numerous studies [2-8] inter alia, including attention in lay literature [9-12] stress the importance of better understanding seagrass/epiphyte ecosystems for a variety of reasons including ecology, tourism, fisheries, sediment stabilization and others.
The 12th International Seagrass Biology Workshop had the
theme ‘securing a future for seagrass’ and stated that it was “an
important waypoint on the path to greater conservation for seagrass
habitats and seagrass-dependent species’ [13]. Seagrasses and
their epiphytes have been and are undergoing numerous stressors.
Climate change, as pertaining to seagrass ecosystems, includes both
global warming resulting from increasing in atmospheric carbon
dioxide (CO2) as well as increases in dissolved CO2 and resultant
alteration of carbonic acid speciation (i.e., lowered pH=shift to
more dissolved CO2/ H2CO3 and lowered  ). Additionally,
stronger storms and altered precipitation patterns affect seagrass
ecosystems. Climate change affects all marine plants and microalgae
[14-18]. Nutrient (N,P) pollution, most notably from septic tanks
(i.e., onsite sewerage treatment and disposal systems, OSTDS)
and agricultural runoff, is well documented to affect seagrass and
their epiphytes, as well as extending offshore to alter coral reef
ecosystems [19-23].
The importance of the epiphyte biomass within the overall seagrass community cannot be over emphasized. That is, though the seagrass itself is considered the habitat and nursery for a great many species, and obviously food for apex species such as sea turtles and manatees, it is the epiphytes which provide a large part of the base of the food chain for micro- and meso-grazers. These grazers include but are not limited to amphipods, copepods, polychaete worms, molluscs, shrimp and herbivorous fishes [24- 30]. These smaller grazers are then the next part of the food web including many larger fish species [2,6,7, 20].
Seagrass ecosystems are known ‘nurseries’ for a great many species [6,31-33] including the spiny lobster Panulirus argus [34- 36], a target of many sport divers throughout Florida, the Bahamas and the Caribbean. An extremely important economic species in the Bahamas, as it once was in the Florida Keys, is the Queen Conch (Aliger gigas; aka Strombus gigas, Lobatus gigas, Eustrombus gigas). Many studies reveal that newly settled juvenile conch (post-larval stage) prefer seagrass to bare sand [37-39] and that they feed on seagrass epiphytes and detritus [40,41]. The economic impact of the queen conch derives not only from its commercial harvesting as a food source but also from the sport diving industry wherein individuals harvest conch for personal use. Since its popularization by Millie et al. [42], the use of HPLC derived pigment-based chemotaxonomy for the rapid assessment of microalgal communities has become well documented cf [43-61,62].
Marine epiphytes are microalgae and cyanobacteria with associated microbial biomass form the full microbiome that exists on seagrasses and other structures. During the studies we report herein, we emphasized microalgae (diatoms, chlorophytes {green algae}, dinoflagellates, cyanobacteria {aka ‘blue-green algae’}) and cryptophytes, potentially including some macroalgae (i.e., chlorophyte {green algae} and rhodophytes {red algae}), that grow on turtle grass (Thalassia testudinum) in the waters of the Florida Keys, United States and around Eleuthera Island in the Bahamas. Analyses of epiphytes on other seagrasses (Caulerpa prolifera, Halophila wrightii) and macroalgae (Penicillus capitatus, Laurencia sp.) from Florida Bay are also included.
The following quotation is from a chapter by Borowitzka et al. [1] and is presented here in order to emphasize the importance of epiphyte primary production to overall seagrass ecosystem food webs. “The epiphytic algae of seagrasses are important primary producers in seagrass ecosystems and make a significant contribution to food webs. They can account for over 50% of the standing crop in seagrass meadows. In Florida, USA, epiphytic algae contributed [50,62] and 44% of primary production for Syringodium filiforme, Thalassia testudinum, and Halodule wrightii, respectively [63].”
The present paper is meant to emphasize the potential for pigment-based chemotaxonomy in studies of seagrass epiphytes and how these techniques can aid the analyses of the overall ecology of seagrass meadows and adaptive management strategies. Emphasis was placed on determining the best ways to ensure that the entire epiphytic microalgal community is collected and analyzed and how sample collection may alter resultant data. Analyses of seagrass epiphyte communities from a wide variety of sample sites were performed in order to reveal similarities/dissimilarities and potential linkages to nutrient levels, pollution and turbidity.
Materials and Methods
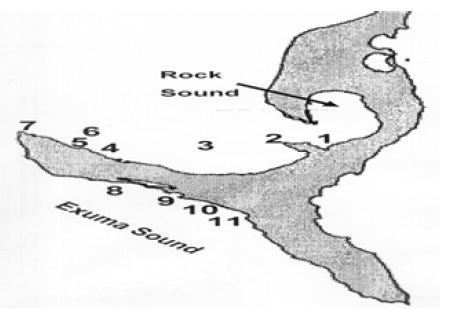
Fieldwork occurred at several sites within Florida Bay, USA (Figure 1,2) and around the southern part of Eleuthera Island, the Bahamas (Figure 1,3). Seagrass was harvested by hand while free (z<2m) diving. Seagrass blades were cut near their base with scissors and placed into pre-labelled (site, depth, date) large screwtop test tubes in order to capture any epiphytes that may slough off during handling and then are placed in a cooler for transport to the shore-based laboratory of at Florida Atlantic University or the Cape Eleuthera Institute (CEI). Under subdued yellow lighting, Thalassia testudinum or Halodule wrightii had any macroalgal epiphytes Cf [64,65] removed and the blades measured for width (w) and length (l) to determine area (A cm2={2xw}xl). The blades were then gently scraped individually into an aluminum ‘pie plate’ using a polyethylene tissue lifter. The seagrass blades and the tissue lifter were then rinsed with water containing 3.5% salt (NaCl) by weight. In the case of the red algal macrophyte Laurencia, and both the green algae Caulerpa and Penicillus, samples were placed in 3.5% salt (NaCl) water, shaken and sonicated to remove epiphytes. Scrapping the epiphytes off Laurencia, Caulerpa. or Penicillus was obviously impossible due to the shape of their thalli. The water plus non-macroalgal epiphytes was then decanted and filtered through a Whatman 47mm GF/F filter with gentle suction. The filter paper was then folded in half, blotted between paper toweling, folded in half once more (=quartered) and reblotted. The blotted quartered filter was then wrapped in aluminum foil, labelled, and immediately frozen at minus 300C.
Figure 1:Location of Florida Bay, USA and Eleuthera island, the Bahamas.
Copyright©, Pittsburg Post-Gazette, all rights reserved. Reprinted with permission.
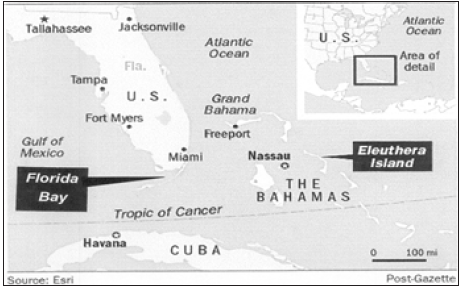
Figure 2:Map showing location of Florida Bay at southern tip of Florida and sampling sites within Florida Bay

Figure 3:Map of south Eleuthera with sampling sites indicated by number:
(1) Starve Creek; (2) Poison Point; (3) Patch; (4) Dorm Beach, Site of the Island School & Cape Eleuthera Institute); (5) Paige Creek-In (6) Paige Creek-Out; (7) Sunset Beach; (8) Deep Creek Jetty; (9) Plum Creek; (10) Davis Harbor; (11) Wemyss Bight Beach.
The samples taken at Eleuthera in the Bahamas were stored frozen until the senior author picked them up every 3 months and transported to the laboratory at Florida Atlantic University (FAU) in Boca Raton, Florida. At FAU, each filter was extracted using methanol; acetone; dimethyl-formamide; water (30:30:30:10, v/v/v/v) and analyzed for epiphyte pigments (chlorophylls and carotenoids) in accord with our standard high performance liquid chromatography (HPLC) procedures [32,47,54,66-68]. The FAU (JWL) laboratory uses two Waters 990 and three Waters 996 photodiode array spectrometers gathering HPLC data using Waters 990 or Empower-2 software with Waters Nova Pak 3.9x300 mm C18 columns and Thermo Separation Products P4000 quaternary HPLC pumps. HPLC peak area (AU*min). Data were then entered into an in-house Excel program (‘Pig Calc’) to generate the pigment-based chemotaxonomic assessment of the epiphyte community. Using the integrated peak area values for indicator pigments [Chlorophyll-b(CH Lb)= chlorophytes, fucoxanthin (FUCO)=diatoms, peridinin (PERI)=peridinin-type dinoflagellates, zeaxanthin (ZEA)=cyanobacteria (aka ‘blue-green algae’), and alloxanthin (ALLO)=cryptophytes], the taxon-specific Chlorophyll-a, as proxy for biomass, was calculated to give the Divisional makeup of each epiphyte community. Taxon-specific chlorophyll-a(CH La) concentrations were calculated from pigment data using the following simultaneous linear regression formula as based on molar relationships:
Total CH La=(1.1xZEA)+(2.5xCHLb)+(1.2xFUCO)+(1.5xPERI)+(1.5xALLO)
It must be noted here that the majority of literature reports pigment ratios that are based on weight-to-weight comparisons. It must be noted here that we use molar-to-molar comparisons, as we believe that this better reflects underlying biochemical relationships. An example of a pigment-based chemotaxonomy based on weight relationships of diagnostic pigments is the SLE from Uitz et al. [43] where in the Sum of Diagnostic Pigments

This yields diatoms+dinoflagellates+cryptophytes+chlorophytes+cyanobacteria. We left out the pigments 9-hexanoyloxy-fucoxanthin and 9-butanoyloxyfucoxanthin which were in the full Uitz et al. [43] formula as those pigments is not part of our SLE for epiphytes.
Previous studies on Everglades’ periphyton and epiphytes, between the years 1994-2009 by the senior author, examined various chemotaxonomic mathematical methods to assess these microalgal communities as well as artificial mixtures of single species cultures. These results revealed that the simultaneous linear equation (SLE) and CHEMTAX [55] methods returned quite similar data while the Bayesian Compositional Estimator BCE: [69] performed less well [54,70,71]. Therefore, herein we utilized the SLE equation shown above.
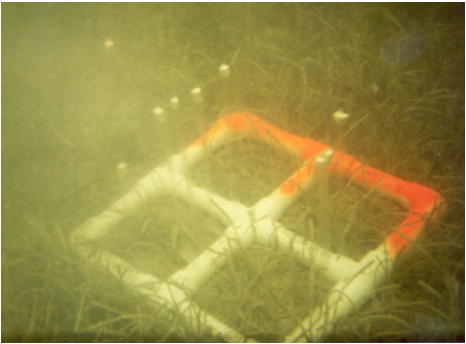
In addition to the analyses of ‘real’ seagrass described above, “epiphytometers” [72,73] aka Artificial Seagrass Units cf. [74-78] were used in our Florida Bay studies. The base is concrete, or sand filled PVC pipe into which 1x20cm deglazed Mylar® strips are inserted and held in place with Marine Goop® adhesive. A small piece of closed cell Styrofoam is glued to the apical end to keep the ‘fake seagrass blade” up in water column and able to bend with current flow, mimicking natural seagrass movement. An example of such an epiphytometer deployed in a Florida Bay seagrass meadow is given here as Figure 4. Epiphyte sampling from the epiphytometer ‘blades’ followed the protocol given above for real seagrass.
Figure 4:Epiphytometer deployed in 1.5m water near Roscoe Key, Florida Bay.
Result and Discussion
Florida bay studies
Most of the Florida Bay studies took place mainly between 2001and 2003 and many of those results formed the basis for coauthor Singh-White’s Master’s thesis [79]. Reassessment of those data form the present treatise.
Epiphytes on ‘fake’ versus real seagrass blades
It was important to address the potential variability in the chemotaxonomic estimation of epiphyte communities on epiphytometers (fake seagrass) versus that of native seagrass (Thalassia testudinum) collected adjacent to an epiphytometer. The data in Table 1 for ‘real’ seagrass represents data from the epiphytes removed from several blades, whereas the data for the ‘Fake’ (i.e., epiphytometer) samples are for single blades. In this case, the higher cyanobacteria percentage on the real seagrass blades is taken as potentially representing a longer length of time that the real seagrass was present in the field for epiphyte colonization and growth. That is, the “fake” seagrass (i.e., epiphytometer) discussed here was in the water for only 2 months. Within probable error limits, these data reveal quite even epiphyte distributions between real and fake seagrass blades. That is, we found no discrimination of epiphyte taxonomic groups on the epiphytometer ‘blades’ versus native (viz. T. testudinum) seagrass.
Table 1: Epiphytometer (aka fake seagrass) variability data.

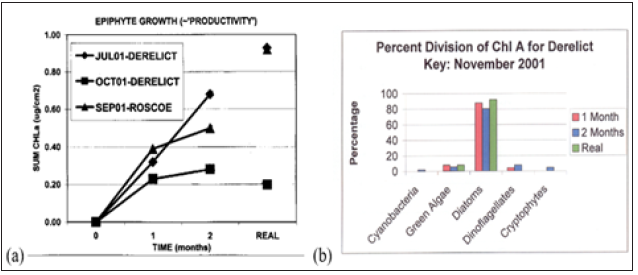
Figure 5a is a plot of Chlorophyll-a concentration, as a proxy for epiphyte biomass, versus epiphytometer residence time (0,1,2 months) and shows a comparison of epiphytometer epiphyte concentration/ productivity with that of coincident ‘real’ (i.e., native) seagrass. Figure 5b shows the pigment-based chemotaxonomic assessments of 1-and 2-month epiphytometer samples as compared to native coincident seagrass at Derelict Key. Epiphyte community growth, taken as changes in CHLa concentration, and community Division makeup were found to be easily assessed and monitored using this methodology. Diatoms (Chrysophytes) vastly dominated both epiphytometer and ‘real’ seagrass epiphyte communities (Figure 5b).
Figure 5:(a) Chlorophyll-a concentration on epiphytometer and native seagrass (Thalassia testudinum) blades. (b) Pigment-based chemotaxonomic determined epiphyte divisions on epiphytometer and coincident real seagrass blades.
Potential data variability due to sample site selection
Sample site selection can be also envisioned as potentially biasing results. We sampled around Roscoe Key in central Florida Bay (Figure 2) in order to see how exact site selection (Table 2) may alter resultant data. Table 3 has the micrograms of chlorophyll-a per square centimeter of seagrass blade data as a biomass indicator as well as the pigment-based chemotaxonomic estimation of the epiphyte community. These samples were taken at approximately the same distance (~40-50m) from the key’s shore. The North and West samples were in 0.5m of water whereas the South and East samples were at 1.25m depth. All sites around Roscoe Key were dominated by diatoms with lesser amounts of chlorophytes. The west site also had detectable signals from chlorophytes and cryptophytes as well as having a 3-4-fold higher load of epiphytes.
Given that the year-round prevailing winds in this area are easterly to south-easterly, the higher epiphyte load to the west of Roscoe Key may well reflect a bottom-up control in that primary nutrient (N,P) known to emanate from bird droppings (guano) on Florida Bay keys [80]. That is, based on epiphyte loads on Thalassia leaves and assuming strong bottom-up control, nutrient supply at Roscoe Key appears to be less to the east and higher to the west. The North and South sites are intermediate to the West and East. Future studies such as these should include full primary nutrient analyses (N as total, ammonia, nitrate and nitrate; P as soluble reactive, total and organic).
Potential data variability due to time of year and local conditions
Table 4 contains data collected at the same site within Snake Bight during seven different months. Salinity varied between 24- 4psu. The December 2001 sampling revealed phytoplankton bloom conditions with a total chlorophyll-a concentration of 13.29 mg/L. During this same period, the epiphyte biomass was also greatly enhanced. Together, these values indicate an increased nutrient supply delivered with incoming fresh water as noted by the lowest salinity recorded at this site.
Diatoms dominated during all samplings except for the June 2002 period in which chlorophytes increased significantly. These data support the proposal herein that pigment-based chemotaxonomy is an excellent way to monitor seagrass epiphyte communities. Granted, we do not have the requisite coincident nutrient data for these waters. However, the point of this paper is to reveal the potential for these methods to provide an easy method to assess epiphyte community changes.
Epiphyte load based on sections of the seagrass blade
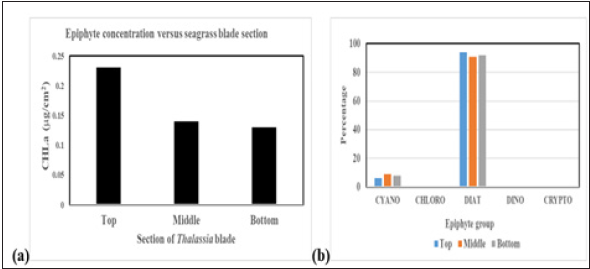
We compared epiphyte biomass, using chlorophyll-a concentration as a biomass proxy, in relation to the vertical section of Thalassia blades. Top is farthest from, and bottom is close to the seagrass/sediment interface. Middle section is in between the top and bottom sections. A section is defined here as one-third (1/3) of the length of the seagrass blade being sampled.
As can be told from these data, the top of the seagrass blades contains the highest epiphyte biomass. Near Derelict Key, the top of the blades had approximately double the epiphytic biomass compared to the mid and bottom of the blades. Near Roscoe Key, the top section of the blades had 2-3 times as much epiphyte biomass as the mid and bottom sections.
With only minor fluctuations, the taxonomic makeup of these epiphytic communities was essentially equal with diatoms dominating. Figure 5a is the histogram presentation of the epiphyte biomass on the sections of Thalassia blades near Derelict Key. Figure 5b is the graphic representation of the epiphytes on those blades.
Light as a potential bottom-up control of epiphyte biomass
Above (Table 5 and Figure 6), we demonstrated that the epiphyte biomass is highest on the upper one-third of the T. testudinum blades. AS the top of the blades are higher in the water column, the increased productivity/standing crop of epiphytes could be due to higher light levels.
Figure 7 is plot of the photosynthetic active radiation (PAR; 400-700nm) flux versus depth at the Roscoe key site. Within the first meter, PAR decreased by about one-half. Therefore, as photosynthesis requires light, less light will yield less biomass. Over the length (~15-30cm) of a Thalassia blade in Florida Bay the top of the blade will receive more light than the mid or bottom sections. However, it is likely not just the small extinction of light over these short depth changes that control the biomass production noted in the data shown in Figure 6a. Rather, we believe that it is bladeto- blade shading that decreases light levels more than the small (~5-10cm) depth changes over the length of the blade. However, the potential for top-down control of epiphyte biomass on the seagrass blades cannot be overlooked. That is, epiphyte consumers may harvest the lower portion of seagrass blades more easily than the top portion of the blade. Around the clock monitoring of grazer activities, perhaps using cameras such as the well-known GoPro® series, could aid in determining the ultimate cause(s) of lowered epiphyte biomass towards the sediment-water interface as well as aiding the assessment of the overall ecological importance of epiphytes as a primary feedstock.
Figure 6:(a) Epiphyte biomass, using chlorophyll-a concentration as a biomass proxy, in relation to the vertical section of Thalassia blades Derelict key. (b) Pigment-based assessment of epiphyte community structure in relation to the vertical section of Thalassia blades.
Diatoms as major epiphytes on seagrass and macroalgae in Florida Bay
Table 6 contains the pigment-based chemotaxonomic assessment of the epiphytes communities on various seagrass and macroalgae in Florida Bay. This is not meant to be an in-depth survey of the epiphytes on these species but rather just comparative snapshots. As seen from Table 6, diatoms are indeed the vastly major epiphytes on these seagrasses and macroalgae. Dead (brown) Thalassia blades also remain as a substrate for epiphytes.
Table 2: Intra-site variability study. Site locations and depths.

Table 3: Pigment-based chemotaxonomic assessment of epiphytes on T. testudinum from different areas around Roscoe Key in Florida Bay see Table 4.

Table 4: Salinity, Phytoplankton Chlorophyll-a (~biomass) and Thalassia testudinum epiphytes in Snake Bight Florida Bay November 2001 to August 2002.

Table 5: Epiphyte distribution based on section of seagrass (T. testudinum) blades.

Table 6: Epiphytes on various seagrass and macroalgal samples.

Eleuthera Bahamas Studies
Collection and transport of seagrass to ensure analysis of the entire epiphyte community
As given in the Materials and Methods section, seagrass blade plus epiphyte collections were performed by cutting seagrass blades underwater and gently placing them in a pre-labelled screwtop 50mL amber centrifuge tubes. The reason for this is to capture microalgae (epiphytes) that were not strongly attached yet still form part of the overall community.
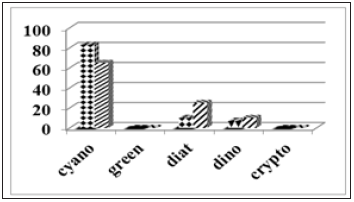
We performed a verification test on this hypothesis using seagrass collected in December of 2013 from south Savana Sound (25ᵒ02’98” Nx76ᵒ07’28’W) in Eleuthera. Figure 7 contains the divisional estimates of epiphytes scrapped from the Thalassia blades [(Figure 7) bars w. diamonds] and the same sample but including the water in the test tube [(Figure 7) cross hatched bars]. Significant amounts of diatoms and dinoflagellates were found to have been removed from their seagrass communities during the sampling process and/or storage in the test tube before processing in the lab. Pinckney [77] have also noted the sloughing of epiphytes during handling of seagrass. Thus, it is concluded that care during collection, storage and transport must be addressed in order to capture the true total epiphyte community. To ensure that only epiphyte microalgae are being analyzed, one should also analyze the plankton in the water of the seagrass bed. In the present case, the exceeding clear water had very low phytoplankton presence with barely detectable CHLa signals in the 50mL sample bottles (Figure 8).
Figure 7:Light penetration at Roscoe Key south location.
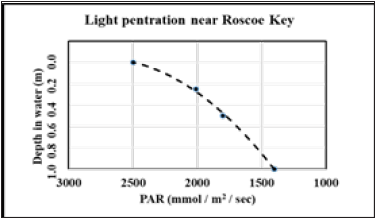
Figure 8:Chemotaxonomic assessment of epiphytes from south Savana Sound seagrass (bars with diamonds= epiphytes scrapped from seagrass blades; cross hatched bars=epiphytes scrapped from seagrass blades plus the water in the collection/transport tube).
Epiphyte community variability in sites around southern Eleuthera
Figure 9 contains two examples of High-Performance Liquid Chromatography (HPLC) separations of pigments extracted from seagrass epiphytes from Eleuthera. Figure 10 contains the derived epiphyte community structures for these two samples.
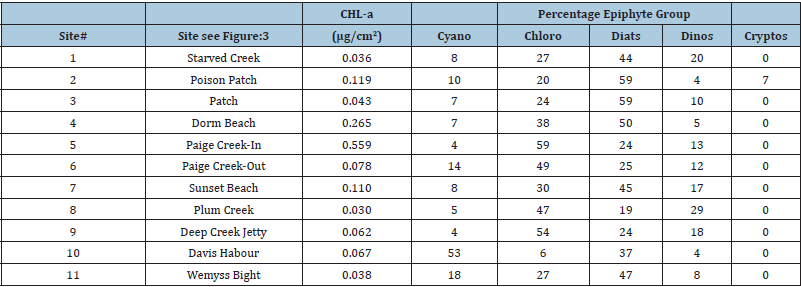
As can be told from these two cases, as well as the 11 other samples given in Table 7, variable epiphyte communities exist on T. testudinum around Eleuthera Island. One might well expect differences in the primary and secondary consumer communities. Of course, epiphyte yield needs to be examined in ways so as to discern top-down (predation) and bottom up (nutrition/light) controls. It is precisely these differences and the implications derived from such data that the use of pigment-based chemotaxonomy is being suggested herein as a rapid monitoring and adaptive management tool. For example, should a larger quantity of juvenile conch prefer a certain seagrass/epiphyte community, then that could provide background for establishing a Fishery Restricted Area (FRA) for individual cases or a full status Marine Protected Area (MPA), thus benefitting more than one or two specific species. Variations in epiphyte/ grazer communities may well occur through annual cycles and such changes, as noted earlier in text (Table 4) also need to be considered.
Figure 9:HPLC chromatograms of the pigments extracted from epiphytes on seagrass (Thalassia testudinum) recovered from outside Davis Harbor (left) and Starve Creek (right), Eleuthera. Pigment codes: c=Chlorophylls- c1/-c2; P=Peridinin, F=Fucoxanthin, L=Lutein, Z=Zeaxanthin, b=Chlorophyll-b, a=Chlorophyll-a, β=β -carotene, Sr=Scytonemin-reduced, M=Myxoxanthophyll.

Figure 10:Divisional community structure for the epiphytes from seagrass recovered outside Davis Harbor (left) and Starved Creek (right).

Table 7: Epiphytes from Thalassia testudinum sampled at various sites around south Eleuthera Island, the Bahamas.
Conclusion
The examples of pigment-based chemotaxonomically derived
seagrass epiphyte communities present herein reveal the utility
of this method for rapidly determining community structure.
Future studies in which nutrients, grazers, light levels, turbidity
and other analyses are included should allow rapid monitoring
(weekly, monthly, yearly) of various seagrass epiphyte ecosystems.
The use of epiphytometers (aka fake seagrass) also allows a rapid
easily monitored method to follow epiphyte productivity. That
is, time zero, placement of the epiphytometer, is well known and
growth can be assessed on any time scale (day, week, month) the
investigator desires.
In Florida Bay, diatoms were most dominant epiphyte group.
Around the southern tip of Eleuthera, epiphyte was more variable
with diatoms, chlorophytes, cyanobacteria and diatoms forming
the community in various percentages. In both Florida Bay and
South Eleuthera, epiphyte biomass was observed to be higher near
sources of nutrients, mainly in terrestrial runoff. Future studies
should obviously include nutrient analyses including nitrogen,
phosphorus and iron.
Studies of microalgal senescence and death induced alteration
of pigments and pigment ratios [54,66-68,81-84] have shown
that various biomarker carotenoids are rapidly altered (e.g.,
fucoxanthin) or remain unchanged for years (i.e., alloxanthin,
lutein, zeaxanthin) during senescence and death. Consideration of
the effects of senescence/death [85], sediment resuspension [53]
and light levels [47] all enter the proper application of pigmentbased
chemotaxonomy [86-105].
Acknowledgement
Work in Florida Bay was funded by grants to the senior author from the United States Department of Commerce, National Marine Fisheries Division (South Florida Ecosystem Restoration and Management Program) and took place under National Park Service permit numbers Permits # 2000088 and EVER-2001-SCI-0078.
Work around the island of Eleuthera in the in the Bahamas was funded by various research funds obtained from nonrelated contracts to the senior author with the South Florida Water Management District and the National Oceanographic and Atmospheric Administration. Collaborative work with the Cape Eleuthera Institute (CEI) of the Island School and use of their facilities is gratefully acknowledge here. Earth watch Institute volunteers and CEI research assistant Ms. Jessica Rudd working with co-author A. Brooks during collection and processing seagrass at the Eleuthera sites are thanked for their assistances. The Pittsburg Post-Gazette is thanked for permission to use the map shown here as Figure 1.
References
- Borowitzka MA, Lavery PS, Van Keulen M (2006) Epiphytes of seagrasses. In: Larkum AWD, Orth RJ, Duarte CM (Eds.), Seagrasses: Biology, ecology and conservation. Springer, Dordrecht, pp. 441-461.
- Connolly RM, Hindell JS, Gorman D (2005) Seagrass and epiphytic algae support nutrition of a fisheries species, Sillago schombrgkii, in adjacent intertidal habitats. Marine Ecology Progress Series 286: 69-79.
- De la Torre CM, Di Carlo G, Jiddawi NS (2014) Seagrass importance for a small-scale fishery in the tropics: The need for seascape management. Marine Pollution Bulletin 83(2): 398-407.
- Farmer A, Mee L, Langmead O, Cooper P, Kannen A, et al. (2012) The Ecosystem approach to marine management. The Ecosystem Approach in Marine Management, USA.
- Fulford RS, Russell M, Rogers JE (2016) Habitat restoration from an ecosystem goods and services perspective: Application of a spatially explicit individual-based model. Estauries and Coasts 39: 1801-1815.
- Gillanders BM (2006) Seagrasses, fish, and fisheries. In: Larkum AWD, Orth RJ, Duarte CM (Eds.), Seagrasses: Biology, Ecology and Conservation. Springer, Dordrecht, Netherlands p. 676.
- Jackson EL, Rowden AA, Attrill MJ, Bossey SJ, Jones MB (2001) The Importance of seagrass beds as a habitat for fishery species. Oceanography and Marine Biology: An Annual Review 39: 269-303.
- Johns G, Lee DJ, Leeworthy V, Boyer J, Nuttle W (2014) Developing economic indices to assess the human dimensions of the south Florida costal marine ecosystem services. Ecological Indicators 44: 69-80.
- Adams A (2019) Tropical seagrass. Fisherman’s Coast-Fly Fishing for Coastal Gamefish.
- Daniels E (2018) Leaves of grass. Vulnerable gentle giants. Alert Diver Fall, pp. 42-44.
- Phillips J (2000) Seagrasses: Fragile foundation of our fisheries. Florida Sportsman, pp. 90-99.
- Scavella N (2016) Marine biologist suggests conservation of Bahamas’ seagrass habitats. The Tribune, Bahamas.
- Hind OEJ, Jones BL (2018) Seagrass science is growing: A report on the 12th international seagrass biology workshop. Marine Pollution Bulletin 134: 223-227.
- Behrenfeld MJ, Malley ORT, Boss ES, Westberry TK, Graff JR, et al. (2016) Revaluating Ocean warming impacts on global Phytoplankton. Nature Climate Change 6: 323-330.
- Bruno JF, Bates AE, Cacciapaglia C, Pike EP, Amstrup SC, et al. (2018) Climate changes threatens the world’s marine protected areas. Nature Climate Change 8: 499-503.
- Hoegh GO, Bruno JF (2010) The Impact of climate change on the world’s marine ecosystems. Science 328(5985): 1523-1528.
- Orth RJ, Carruthers TJB, Dennison WC, Duarte CM, Fourqurean W, et al. (2006) A global crisis for seagrass ecosystems. Bioscience 56(12): 987- 996.
- Waycott M, Duarte CM, Carruthers TJB, Orth RJ, Dennison WC, et al. (2009) Accelerating loss of seagrass across the globe threatens coastal ecosystems. Proceedings of the National Academy of Science 106(30): 12377-12381.
- Frankovich TA, Fourqurean JW (1997) Seagrass epiphyte loads along a nutrient availability gradient, Florida Bay, USA. Marine Ecology Progress Series 159: 37-50.
- Heck Jr KL, Pennock JR, Valebtine JF, Coen LD, Sklenar A (2000) Effects of nutrient enrichment and small predator density on seagrass ecosystems: An experimental assessment. Limnology and Oceanography 45(5): 1041-1057.
- Lapointe B, Connell OJD, Garrett GS (1990) Nutrient couplings between on-site sewage disposal systems, groundwaters, and nearshore surface waters of the Florida keys. Biogeochemistry 10: 289-307.
- Lapointe B, Barile P, Matzie W (2004) Anthropogenic nutrient enrichment of seagrass and coral reef communities in the lower Florida keys: Discrimination of local versus regional nitrogen sources. Journal of Experimental Marine Biology & Ecology 308(1): 23-58.
- Meeroff DE, Bloetscher F, Bocca T, Morin F (2008) Evaluation of water quality impacts of on-site treatment and disposal systems on urban coastal waters. Water, Air and Soil Pollution 192(1-4): 11-24.
- Best RJ, Stachowicz JJ (2012) Trophic cascades in seagrass meadows depend on meso-grazer variation in feeding rates, predation susceptibility, and abundance. Marine Ecology Progress Series 456: 29-42.
- Cook K, Vanderklift MA, Poore AGB (2011) Strong effects of herbivorous amphipods on epiphyte biomass in a temperate seagrass meadow. Marine Ecology Progress Series 442: 263-269.
- Heck Jr KL, Valentine JF (2006) Plant-herbivore interactions in seagrass meadows. Journal of Experimental Marine Biology and Ecology 330(1): 420-436.
- Lewis LS, Anderson TW (2012) Top-down control of epifauna by fishes enhances seagrass production. Ecology 93(12): 2746-2757.
- Lonergan NR, Kenyon RA, Staples DJ, Poiner IR, Conacher CA (1998) The influence of seagrass type on the distribution and abundance of post-larval and juvenile tiger prawns (Penaeus esculentus and Penaeus semisulcatus) in the western gulf of Carpentaria, Australia. Journal of Experimental Marine Biology and Ecology 228(2): 175-195.
- Sweatman JL (2016) Gammaridean amphipods as bioindicators in subtropical seagrass ecosystems. FIU Electronic Theses and Dissertations, Florida, USA.
- Sweatman JL, Layman CA, Fourqurean JW (2017) Habitat fragmentation has some impacts on aspects of ecosystem functioning in a sub-tropical seagrass bed. Marine Environmental Research 126: 95-108.
- Heck Jr KL, Hays CG, Orth RJ (2003) Critical evaluation of the nursery hypothesis for seagrass meadows. Marine Ecology Progress Series 253: 123-136.
- Kikuchi T, Peres JM (1977) Animal communities in the seagrass beds. In: McRoy CP, Helferrich C (Eds.), Seagrass Ecosystems. A Scientific Perspective, Marcel Dekker, New York, USA, pp. 147-193.
- Vaslet A, Phillips DL, France C, Feller IC, Baldwin CC (2012) The relative importance of mangroves and seagrass beds as feeding areas for resident and transient fishes among different mangrove habitats in Florida and Belize: Evidence from dietary and stable-isotope analyses. Journal of Experimental Marine Biology and Ecology 434-435: 81-93.
- Behringer DC, Butler IV MJ, Herrnkind WF, Hunt JH, Acosta CA, et al. (2009) Is seagrass an important nursery habitat for the Caribbean spiny lobster, Panulirus argus, in Florida? New Zealand Journal of Marine and Freshwater Research 43(1): 327-337.
- Butler IV MJ, Mojica A, Sosa CE, Millet M, Sanchez NP, et al. (2010) Patterns of spiny lobster (Panulirus argus) post larval recruitment in the Caribbean: A CRTR project. Proceedings of the Gulf and Caribbean Fisheries Institute 62: 360-369.
- Herrnkind WF, Butler IV MJ (1986) Factors regulating post larval settlement and juvenile microhabitat use by spiny lobsters Panulirus argus. Marine Ecology Progress Series 34: 23-30.
- Marshall Jr LS, Lipicus RN (1991) Juvenile queen conch survival in similar seagrass habitats. Proc 45th Gulf and Caribbean Fisheries Institute, pp. 926-931.
- Ray M, Stoner AW (1995) Growth, survivorship, and habitat choice in a newly settled gastropod, Strombus gigas. Marine Ecology Progress Series 123: 83-94.
- Stoner AW, Lin J, Hanisak D (1995) Relationships between seagrass bed characteristics and juvenile queen conch (Strombus gigas Linne) abundance in the Bahamas. Journal of Shellfish Research 14: 315-323.
- Klumpp DW, Salita EJS, Fortes MD (1992) The role of epiphytic periphyton and macroinvertebrate grazers in the trophic flux of a tropical seagrass community. Aquatic Botany 43(4): 327-349.
- Stoner AW, Sandt VJ (1991) Experimental analysis of habitat quality for juvenile queen conch in seagrass meadows. National Marine Fisheries Service 89(4): 693-700.
- Millie DF, Paerl HW, Hurley JP (1993) Microalgal pigment assessments using high performance liquid chromatography: A synopsis of organismal and ecological applications. Canadian Journal of Fisheries and Aquatic Science 50(11): 2513-2527.
- Uitz J, Claustre H, Morel A, Hooker SB (2006) Vertical distribution of phytoplankton communities in open ocean: An assessment based on surface chlorophyll. Journal of Geophysical Research 111(C8): 23.
- Descy JP, Metens A (1996) Biomass-pigment relationships in potamoplankton. Journal of Plankton Research 18(9): 1557-1566.
- Descy JP, Higgins HW, Mackey DJ, Hurley JP, Frost TM (2000) Pigment ratios and phytoplankton assessment in northern Wisconsin lakes. Journal of Phycology 36(2): 274-286.
- Descy JP, Sarmento H, Higgins HW (2009) Variability of phytoplankton pigment ratios across aquatic environments. European Journal of Phycology 44(3): 319-330.
- Grant CS, Louda JW (2010) Microalgal pigment ratios in relation to light intensity-Implications for chemotaxonomy. Aquatic Biology 11: 127-138.
- Grant CS, Louda JW (2013) Scytonemin-imine, a mahogany-colored UV/VIS sunscreen of cyanobacteria exposed to intense solar radiation. Organic Geochemistry 65: 29-36.
- Havskum H, Schluter L, Scharek R, Berdalet E, Jacquet S (2004) Routine quantification of phytoplankton groups-microscopy or pigment analyses? Marine Ecology Progress Series 273: 31-42.
- Irigoien X, Meyer B, Harris R, Harbour D (2004) Using HPLC pigment analysis to investigate phytoplankton taxonomy: The importance of knowing your species. Helog Marine Research 58: 77-82.
- Lewitus AJ, White DL, Tymowski RG, Geesey ME, Hymel SN, et al. (2005) Adapting the CHEMTAX method for assessing phytoplankton taxonomic composition in southeastern US estuaries. Estuaries 28: 160-172.
- Li HP, Ging GC, Hsiung TM (2002) Phytoplankton pigment analysis by HPLC and its application to algal community investigations. Botanical Bulletin of Academia Sinica 43: 283-290.
- Louda JW (2008) Pigment-based chemotaxonomy of Florida bay phytoplankton; development and difficulties. Journal of Liquid Chromatography and Related Technologies 31: 295-323.
- Louda JW, Grant C, Browne J, Hagerthey SE (2015) Pigment-based chemotaxonomy and its application to Everglades periphyton. In: Entry JA, Jayachandrahan K, Gottlieb AD, Ogram A (Eds.), Microbiology of the Everglades Ecosystem. Science Publishers pp. 287-347 plus appendices pp. 455-468 and color plate p. 485.
- Mackey DJ, Higgins HW, Mackey MD, Wright SW (1996) CHEMTAX-a program for estimating class abundances from chemical markers: Application to HPLC measurements of phytoplankton. Marine Ecology Progress Series 144: 265-283.
- Mackey DJ, Higgins HW, Mackey MD, Holdsworth D (1998) Algal class abundances in the western equatorial Pacific: Estimation from HPLC measurements of chloroplast pigments using CHEMTAX. Deep-Sea Research 45(9): 1441-1468.
- Mendes CR, Cartaxana P, Brotas V (2007) HPLC determination of phytoplankton and microphytobenthos pigments: Comparing resolution and sensitivity of a C18 and a C8 Limnol Oceanogr Methods 5(10): 363-370.
- Sarmento H, Descy JP (2008) Use of marker pigments and functional groups for assessing the status of phytoplankton assemblages in lakes. Journal of Applied Phycology 20: 1001-1011.
- Schulter L, Lauridsen TL, Krogh G, Jorgensen T (2006) Identification and quantification of phytoplankton groups in lakes using new pigment ratios-a comparison between pigment analysis and microscopy. Freshwater Biology 51(8): 1474-1485.
- Schmid H, Bauer F, Stich HB (1998) Determination of algal biomass with HPLC pigment analysis from lakes of different trophic state in comparison to microscopically measured biomass. Journal of Plankton Research 20(9): 1651-1661.
- Silva A, Mendes CR, Palma S, Brotas V (2008) Short-time scale variation of phytoplankton succession in Lisbon Bay (Portugal) as revealed by microscopy cell counts and HPLC pigment analysis. Estuarine, Coastal and Shelf Science 79: 230-238.
- Wachnika A, Browder J, Jackson T, Louda W, Kelbe C, et al. (2019) Hurricane Irma’s impact on water quality and phytoplankton communities in Biscayne Bay (Florida, USA). Estuaries and Coasts 43: 1217-1234.
- Wear DJ, Sullivan MJ, Moore AD, Millie DF (1999) Effects of water-column enrichment on the production dynamics of three seagrass species and their epiphytic algae. Marine Ecology Progress Series 179: 201-213.
- Moncreiff CA, Sulliva MJ (2001) Trophic importance of epiphytic algae in subtropical seagrass beds: Evidence from multiple stable isotope analyses. Marine Ecology Progress Series 215: 93-106.
- Samper VJ, Bernecker A, Wehrtmann IS (2008) Inventory of macroalgal epiphytes on the seagrass Thalassia testudinum (Hydrocharitaceae) in Parque Nacional Cahuita, Caribbean cost of costa Rica. Revista de Biologia Tropical 56 (Suppl 4): 163-174.
- Louda JW, Neto RR, Magalhaes ARM, Schneider VF (2008) Pigment alterations in the brown mussel Perna perna. Comparative Biochemistry and Physiology-B: Biochemistry and Molecular Biology 150(4): 385-394.
- Louda JW, Li J, Liu L, Winfree MN, Baker EW (1998) Chlorophyll-a degradation during cellular senescence and death. Organic Geochemistry 29(5-7): 1233-1251.
- Louda JW, Loitz JW, Rudnick DT, Baker EW (2000) Early diagenetic alteration of chlorophyll-a and bacteriochlorophyll-a in a contemporaneous marl ecosystem. Organic Geochemistry 31(12): 1561-1580.
- Van den MK, Soetaert K, Middelburg JJ (2008) A Bayesian compositional estimator for microbial taxonomy based on biomarkers. Limnology and Oceanography Methods 6(5): 190-199.
- Browne J (2010) Comparison of chemotaxonomic methods for determination of algal class composition in Florida Everglades periphyton. MS Environmental Sciences, p. 103.
- Browne J, Louda JW (2010) Comparison of chemotaxonomic methods for determination of algal class composition in Florida everglades periphyton. 74th Annual Meeting of the Florida Academy of Sciences. Ft Pierce, FL, USA.
- Singh A, Louda JW (2002) Utilization of epiphytometers for the estimation of epiphytic productivity and community structure in conjunction with HPLC pigment analysis. 66th Annual Meeting, Florida Academy of Sciences, Miami, Florida, USA.
- Singh A, Louda JW (2003) Epiphytometry in the study of epiphyte productivity and taxonomic makeup in north-central Florida Bay. 67th Annual Meeting of the Florida Academy of Sciences. Orlando, Fl, USA.
- Bartholomew A (2002) Faunal colonization of artificial seagrass plots: The importance of surface area versus space size relative to body size. Estuaries 25: 1045-1052.
- Bologna PAX, Heck Jr KL (1999) Macrofaunal associations with seagrass epiphytes-Relative importance of trophic and structural characteristics. Journal of Experimental Marine Biology and Ecology 242: 21-29.
- Horner SMJ (1987) Similarity of epiphyte biomass distribution on Posidonia and artificial seagrass leaves. Aquatic Botany 27: 159-167.
- Pinckney JL, Micheli F (1998) Microalgae on seagrass mimics: Does epiphyte community structure differ from live Seagrasses? Journal of Experimental Marine Biology and Ecology 221(1): 59-70.
- Trautman DA, Borowitzka MA (1999) The distribution of the epiphytic organisms on Posidonia australis and sinuosa, two seagrasses with differing leaf morphology. Marine Ecology Progress Series 179: 215-229.
- Singh AG (2003) Epiphyte Productivity and Community Structure in Conjunction with HPLC Pigment Analysis. (M.S. Environmental Sciences), Florida Atlantic University, Boca Raton, Florida, p. 68.
- Fourqurean JW, Zieman JC, Powell GVN (1992) Phosphorus limitation of primary production in Florida Bay: Evidence from C:N:P ratios of the dominant seagrass Thalassia testudinum. Limnology and Oceanography 37(1): 162-171.
- Louda JW (2003) The wax and wane of cyanobacterial blooms in north-central Florida Bay as discerned by pigment-based chemotaxonomy. 67th Annual Meeting of the Florida Academy of Sciences, Orlando, Fl, USA.
- Szymczak ŻM, Kowalewska G, Louda JW (2008) The Influence of microorganisms on chlorophyll-a degradation in the marine environment. Limnology and Oceanography 53(2): 851-862.
- Louda JW (2011) Initial investigations of microbial mats in hypersaline lagoons on the island of Eleuthera, Bahamas. Florida Academy of Sciences, Melbourne, Fl, USA.
- Szymczak ŻM, Kowalewska G, Louda JW (2011) Sedimentary chlorophyll-a derivatives as indicators of marine eutrophication. Marine Chemistry 125: 39-48.
- Louda JW, Liu L, Baker EW (2002) Senescence-and death-related alteration of chlorophylls and carotenoids in marine phytoplankton. Organic Geochemistry 33(12): 1635-1653.
- Clauste H, Hooker SB, Van Heukelem L, Berthon JF, Barlow R, et al. (2004) An intercomparison of HPLC phytoplankton pigment methods using in situ samples: Application to remote sensing and database activities. Marine Chemistry 85(1-2): 41-61.
- Cullen ULC, Unsworth R (2018) A call for seagrass protection. Science 361(6401): 446-448.
- Davis GE, Dodrill JW (1980) Marine parks and sanctuaries for spiny lobster fishery management. Proceedings of the Gulf and Caribbean Fisheries Institute 32: 194-207.
- Duarte CM, Chiscano CL (1999) Seagrass biomass and production: A reassessment. Aquatic Botany 65(1-4): 159-174.
- Eggleston DB (1995) Recruitment in Nassau grouper Epinephilus striatus: Post-settlement abundance, microhabitat features, and ontogenetic habitat shifts. Marine Ecology Progress Series 124: 9-22.
- Eggleston DB, Lipcius RN, Miller DL, Coba CL (1990) Shelter scaling regulates survival of juvenile caribbean spiny lobster Panulirus argus. Marine Ecology Progress Series 62: 79-88.
- Fourqurean JW, Robble MB (1999) Florida bay: A history of recent ecological changes. Estauries 22: 345-357.
- Frankovich TA, Gaiser EE, Zieman JC, Wachnicka AH (2006) Spatial and temporal distributions of epiphytic diatoms growing on Thalassia testudinum Banks ex Konig: Relationships to water quality. Hydrobiologia 569: 259-271.
- Gacia E, Littler MM, Littler DS (1999) An experimental test of the capacity of food web interactions (Fish-Epiphytes-Seagrasses) to offset negative consequences of eutrophication on seagrass communities. Estuarine Coastal and Shelf Science 48(6): 757-766.
- Hagerthey SE, Louda JW, Mongkronsri P (2006) Evaluation of pigment extraction methods and a recommended protocol for periphyton chlorophyll a determination and chemotaxonomic assessment. Journal of Phycology 42(5): 1125-1136.
- Herrnkind WF, Butler IV MJ (1986) Factors regulating post larval settlement and juvenile microhabitat use by spiny lobsters Panulirus argus. Marine Ecology Progress Series 34: 23-30.
- Kitting CL (1979) The use of feeding noises to determine the algal foods being consumed by individual intertidal molluscs. Oceclogia 40(1): 1-17.
- Kitting CL, Fry B, Morgan MD (1984) Detection of inconspicuous epiphytic algae supporting food webs in seagrass meadows. Oceclogia 62(2): 145-149.
- Louda JW, Mongkhonsri P, Baker EW (2011) Chlorophyll degradation during senescence and death-III: Three-to-ten-year experiments, implications for ETIO-series generation. Organic Geochemistry 42(6): 688-699.
- Peterson BJ, Frankovich TA, Zieman JC (2007) Response of seagrass epiphyte loading to field manipulations of fertilization, gastropod grazing and leaf turnover rates. Journal of Experimental Marine Biology and Ecology 349(1): 61-72.
- Robblee MB, Barber TR, Carlson PR, Durako MJ, Fourqurean JW, et al. (1991) Mass mortality of the tropical seagrass Thalassia testudinum in Florida Bay (USA). Marine Ecology Progress Series 71: 297-299.
- Stoner AW, Ray M (1996) Queen conch, Strombus gigas, in fished and unfished locations of the Bahamas: Effects of a marine fishery reserve on adults, juveniles, and larval production. National Marine Fisheries Service 94: 551-565.
- Virnstein RW, Howard RK (1987) Motile epifauna of marine macrophytes in the Indian river lagoon, Florida. I. Comparisons among three species of seagrasses from adjacent beds. Bulletin of Marine Science 41(1): 1-12.
- Waltner TD, Kay JJ, Lister NME (2008) The ecosystem approach: Complexity, uncertainty, and managing for sustainability. Columbia University Press, USA, p. 408.
- Zieman JC, Fourqurean JW, Frankovich TA (1999) Seagrass die-off in Florida Bay: Long-term trends in abundance and growth of turtle grass, Thalassia testudinum. Estuaries 22: 460-470.
© 2021 J William Louda. This is an open access article distributed under the terms of the Creative Commons Attribution License , which permits unrestricted use, distribution, and build upon your work non-commercially.
 a Creative Commons Attribution 4.0 International License. Based on a work at www.crimsonpublishers.com.
Best viewed in


.jpg)


 Editorial Board Registrations
 Submit your Article
 Refer a Friend
 Advertise With Us
.jpg)


.jpg)


.bmp)
.jpg)
.png)
.jpg)


.jpg)


.png)

.png)


.png)


