- Submissions

Full Text
Examines in Marine Biology & Oceanography
Effects of Anthropogenic Pressures on the Structure of Floristic Components of Mangroves in the Cameroon Estuary
Emane Jean Michel1, Essomè Koum Guillaume Léopold2, Ngotta Biyon Jacques Bruno1, Ekodeck Georges Emmanuel3, Tomedi Eyango Minette2 and Ndongo Din1*
1Department of Botany, Plant Biology and Physiology Laboratory, Faculty of Science, The University of Douala, Douala, Cameroon
2Institute of Fisheries and Aquatic Sciences at Yabassi, The University of Douala, Douala, Cameroon
3Faculty of Sciences, The University of Yaounde I, Yaounde, Cameroon
*Corresponding author: Ndongo Din, Department of Botany, Plant Biology and Physiology Laboratory, Faculty of Science, The University of Douala, Douala, Cameroon
Submission: April 15, 2020;Published: May 6, 2021

ISSN 2578-031X Volume4 Issue1
Abstract
Mangroves are recognized worldwide as one of the most remarkable ecosystems because of their exceptional biological diversity whose origins are terrestrial, marine or intertidal. Mangroves play a role in coastal protection, biodiversity maintenance, flood mitigation, storm protection, pollution control, and coastal erosion reduction. This study was conducted with the aim of determining the impact of anthropogenic activities on the structure of some biological components in the mangroves of the Cameroon Estuary. The work took place at seven sites in the study area, spread across the Littoral and Southwest regions from February to December 2019. Inventories were carried out on all trees of at least 5cm in diameter in plots of 2500m2 (50m x 50m). Species were identified and counted, and parameters such as circumference, height, or distance between two neighboring trees were measured. The results identified 24 species belonging to 12 families. The “Bois des Singes” (1100 individuals/ha) and Tiko (850 individuals/ha) sites showed higher densities, while the Youpwè site showed the lowest density (125 individuals/ha). The diameters varied significantly (K=11.48; p=0.04) between the Bobongo (33.07±23.10cm) and “Bois des Singes” (18.14±7.94cm). Heights also varied significantly (K=12.22; p=0.03) between Tiko (20.28±10.41m) and “Bois des Singes” (11.98±4.59m). Distances between neighboring trees did not vary significantly between the sites (K=9.17; p=0.1). The calculated basal area was higher at Tiko (36.84m2/ha), and lower in “Bois des Singes” (8.87m2/ha). The free and gratis exploitation of the mangrove’s natural resources leads to its degradation. However, the absence of the use of these resources can also become a disadvantage because the progressive dynamics of the mangroves can lead to channel obstruction.
Keywords: Anthropogenic activities; Biodiversity; Cameroon estuary; Mangroves; Vegetation dynamics
Introduction
Mangroves act as a barrier against some natural disasters such as cyclones, hurricanes and tsunamis (Dahdouh [1] and Alongi [2]). Because of their role in limiting coastal erosion, they contribute to the advance of the land to the ocean while providing a buffer zone in storm and cyclone areas (Hong [3]) The entangled roots of mangroves contribute to the filtration of estuarine water through the retention of many coarse debris as well as sediments, but also have an important role in maintaining biodiversity and controlling the population (Lin [4]).
In the tropics, mangroves are classified as one of the most carbon-rich forests. They play a significant role in climate stability because recent estimates show that about 11% of the total mass of organic carbon at the earth-ocean interface is set by mangroves. Mangroves fix atmospheric CO2 and thus contribute to the fight against global warming (Alongi [5]). These coastal ecosystems also mitigate the negative effects of rising sea levels (Ellison [6] and Nitto [7]). A high-density mangrove population has been shown to promote sediment accretion and, as a result, the elevation of the coastal surface (Kumara [8]). Mangroves also have an important function in stabilizing the coastline and coastal substrate, biological purgation, shoreline protection and coastal erosion prevention (Din [9]).
In the Cameroon estuary, the loss of mangrove vegetation cover is mainly due to the extension of the port of Douala, the exploitation of firewood and timber, the extraction of sand and also the construction of huts following rampant urbanization (Din [10]). Mangrove trees close to homes are cut down by local people who traditionally use them for firewood, and when this activity becomes lucrative, people use more efficient cutting and transportation equipment to maximize their income (Nfotabong [11]).
The Cameroon estuary, like many mangroves in developing countries, is characterized by anarchic urbanization due to high population pressure that causes complete deforestation of these peri-urban ecosystems (Din [12] and Massou [13]). The resurgence of anthropogenic activities such as anarchic logging, the discharge of domestic and/or industrial waste, oil and mining operations are causing enormous damage to these unstable ecosystems to the point where estimates and modelling tests predict a total disappearance of all mangroves in the next hundred years (Rajkaran [14]). This work was carried out with the aim of determining the impact of anthropogenic activities on the structure of some biological components in the mangroves of the Cameroon estuary.
Materials and Method
Study site
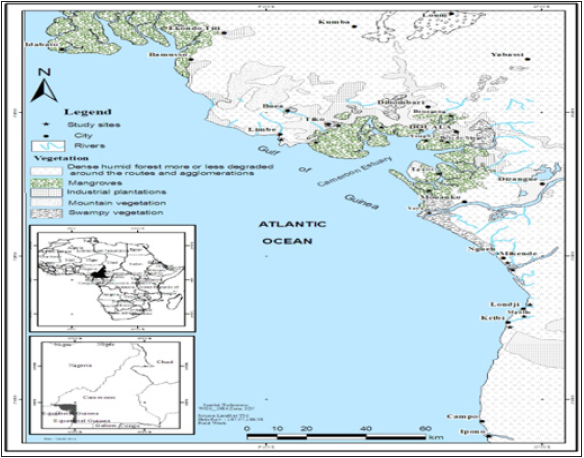
The study was carried out in mangroves of the Littoral and Southwest administrative regions for eleven months from February to December 2019. These regions are characterized by the northern coastal equatorial climate, marked by two seasons in a year: a longer rainy season from mid-March to mid-November; a short dry season from mid-November to mid-March. The temperature at the Wouri estuary is almost constant throughout the year and is around 26 ᵒC needed for optimal mangrove growth (Massou [13]). The study covered seven sites, namely Bobongo, “Bois des Singes”, Bojongo, Essengue, Limbe, Tiko, and Youpwe, in degraded mangroves (Figure 1); [15].
Figure 1:Map showing the location of the sampling stations (Modified from Din [15]).
Method
All woody species with a circumference stem of at least 15cm were then sampled from a 50m x 50m plot delineated at the prospected sites. The circumference of the stems was measured using a tape meter while the heights of trees required the use of a clinometer. The circumference data were used to calculate the diameters by using the classical formula D=C/π. The diameter classes were then defined (Table 1); [11].
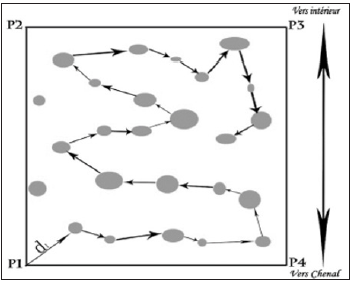
A decameter was used to measure the distance between two neighboring trees on a specific itinerary (Essome [16]); (Figure 2).
Table 1: Diameter classes (Nfotabong [11]).
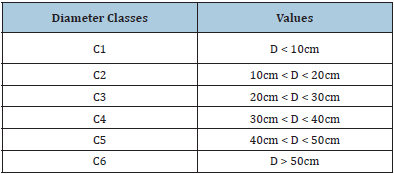
Figure 2:Path followed for the measurement of the distance between the trees (From Essomè [16]).
The absolute density of the trees was calculated using the formula:
dm being the average distance of trees in the plot.
The basal area was also calculated by the formula:
Dm being the average diameter of the trees in the plot.
The statistical analyses were carried out from the XLSTAT 2015 software version 11.0.0. Data allowed to obtain a dendrogram of similarity of the sites by the Jacquard index. The Kruskal-Wallis test was used to compare the averages of tree structure parameters. The correlations between the structure parameters were studied by the Pearson correlation coefficient. An analysis of key components was also used.
Result
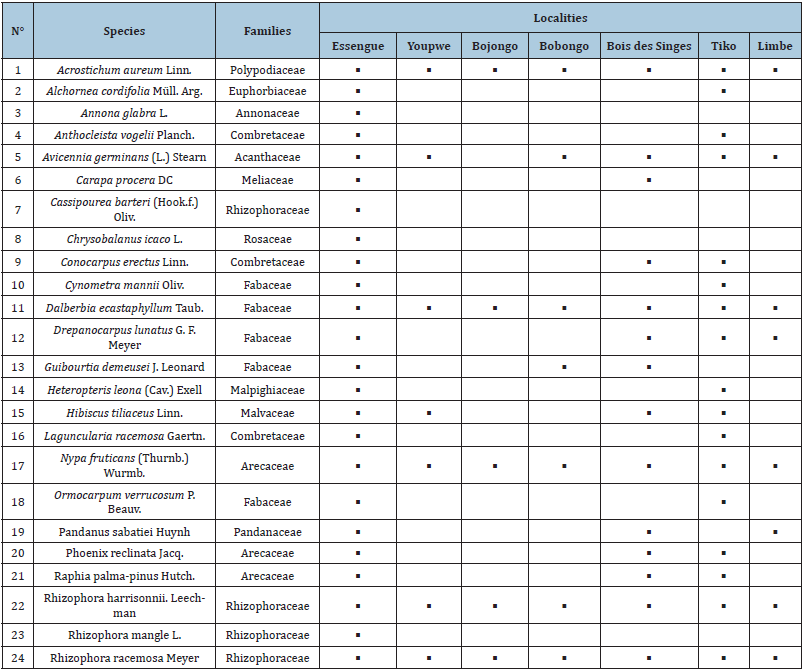
A total of 24 species were identified, divided into 22 genera belonging to 12 families. The most represented family is the Fabaceae (05 species), followed in descending order by the Rhizophoraceae (04 species), Arecaceae and Combretaceae (03 species). Similarly, five species were present at all sites. These are: Acrostichum aureum; Dalbergia écastaphyllum; Nypa fruticans; Rhizophora harrisonnii and Rhizophora racemosa. Two species (Hibiscus tiliaceus and Drepanocarpus lunatus) were present at four sites. Four species were present at three sites (Raphia palma-pinus; Phoenix reclinata; Pandamus satabiei; Guibourtia demeusei. Five species (Anthocleista vogelii; Carapa procera; Cynometra mannii; Ormocarpum verruscom; Heteropteris leona) were present in three localities. Annona glabra was present only at Essengue (Table 2).
Table 2: Distribution of species in the studied area.
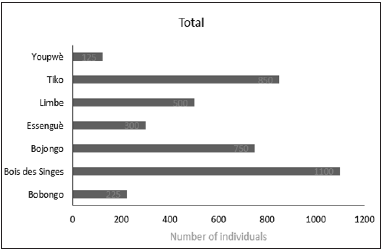
Tree densities varied significantly at different sites (Figure 3). The highest number of individuals per hectare is the “Bois des Singes” (1100ind./ha), followed by Tiko (850ind./ha), Bojongo (750ind./ha Limbe (500ind./ha), Youpwe (500ind./ha), Essengue (300ind./ha) and Bobongo (225ind./ha). Mean diameters were significantly higher at the Bobongo (33.07±23.10cm) than the “Bois des Singes” (K=11.48; p=0.04). In Bojongo, the mean diameter was 23.19±11.57cm; in Essengue it was 32.43±10.51cm; In Limbe, the mean diameter was 21.68±18.32cm; In Tiko, 31.42±23.06cm; and in Youpwe, the mean diameter was 19.50±16.72cm. The minimum and maximum diameters were all obtained at Tiko (5.74cm and 83.07cm respectively). In Bobongo, the minimum and maximum diameters were 6.05cm and 74.80cm; At “Bois des Singes”, 9.55cm and 42.97cm respectively; In Bojongo, 6.68cm and 58.89cm respectively; In Essengue, 14.97cm were obtained as a minimum diameter, and 49.04cm as maximum diameter; A Limbe, 8.91cm for the minimum diameter, and 68.44cm for the maximum diameter; In Youpwe, the minimum diameter was 6.68cm and the maximum diameter was 53.15cm (Table 3).
Table 3: Stems diameter measurements in the studied localities.

Figure 3:Tree’s abundance in different localities.
The distribution of diameter classes in all sites shows important differences and gaps (Figure 4). Two sites, Bojongo and Tiko, presented all diameter classes. Classes 2 and 3 had the highest number of individuals in Bojongo, with 25 individuals and 10 individuals and 13 individuals, respectively. The sites of “Bois des Singes”, Limbe and Youpwe are characterized by the high number of Class 2 individuals (11 individuals, and 9 individuals respectively), and a relatively small number of individuals of the other diameter classes, these not exceeding 6 cm in diameter. The Bobongo site was characterized by a very small number of individuals not exceeding 2 among the 5 classes in diameter that it counted; Essengue was the only site with four (04) diameter classes, and the highest number of individuals was found in Class 4 with 6 individuals.
Heights also varied significantly between Tiko and Youpwe (K=12.22; p=0.03). The average heights were 20.28±10.41m and 11.98±4.59cm respectively in Tiko and “Bois des Singes”. It was 20.05±10.15cm in Bobongo, 17.57±7.67cm in Bojongo, 19.21±2.60cm in Essengue, 15.72±10.94cm in Limbe, and 12.25±6.58cm in Youpwe. The minimum height was obtained at “Bois des singes” (Hmin - 3m), and the maximum height was obtained at Limbe (Hmax - 37.5m). The minimum heights were 5.43m in Bobongo, 5.89m in Bojongo, 7.5m in Limbe, 15m in Essengue, 5.2m in Tiko, and 5.9m in Youpwe. The maximum height was 37m in Bobongo, 36.5m in Bojongo, 23.3m in Essengue, 37m in Tiko, and 24.3m in Youpwe (Table 4).
Table 4: Trees height measurements in the localities.

Figure 5 shows the distribution of height classes at different sites. The height classes C1, C2 and C3 were found at the Bobongo, Bojongo, Limbe and Tiko sites. Class 3 was the most represented in Bobongo (03 individuals) and Tiko (18 individuals). Class 2 was the most represented in Bojongo with 15 individuals, while class 1 was the highest in Limbe (09 individuals). Classes 1 and 2 were found at the «Bois des Singes” site (20 individuals and 24 individuals respectively), while in Essengue, they are classes 2 (09 individuals) and 3, with 03 individuals.
Figure 6 shows the average distances between trees. Distances between the trees did not vary significantly (K =9.17; p=0.1), ranging from 2.59±1.62m at Tiko, to 5.13±2.24m at Bobongo. The average distance between the trees was 3.04±1.82m at “Bois des singes”, 3.02±2.08 m in Bojongo, 3.36±3.44m in Essengue, 3.35±2.67m in Limbe, and 2.92±1.70m in Youpwe.
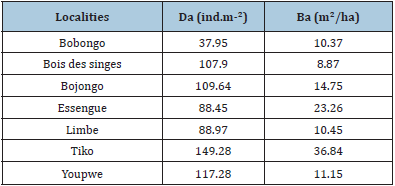
Absolute density was higher at the Tiko site at 149.28ind/m2, and the lowest was found in Bobongo (37.95ind/m2). It was valued at 107.9ind/m2 at “Bois des Singes”, 109.64ind/m2 in Bojongo, 88.45ind/m2 in Essengue, 88.97ind/m2 in Limbe, and 117.28ind/ m2 in Youpwe. Basal surfaces ranged from 8.87m2/ha in «Bois des Singes” to 36.84m2/ha in Tiko. In the other sites, land areas were 10.37m2/ha in Bobongo, 14.75m2/ha in Bojongo, 23.26m2/ha in Essengue, 10.45m2/ha in Limbe, and 11.15m2/ha in Youpwe (Table 5).
Figure 4:Number of individuals of diameter classes.
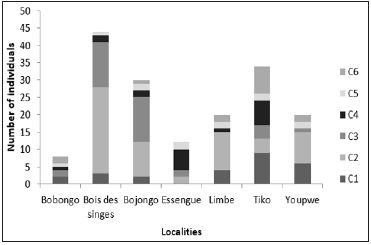
Figure 5:Number of individuals in height classes.
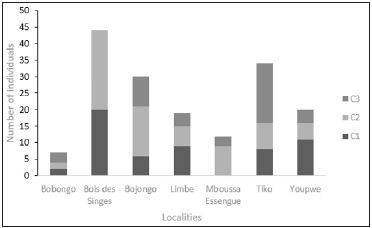
Figure 6:Average distance between the localities.
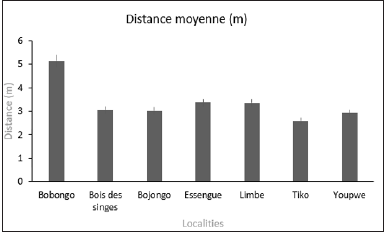
Table 5: Absolute densities and basal areas of the localities.
Discussion
The distribution of individuals by diameter class is not uniform in all study sites. It has the characteristics of disturbed stands with a few diameter classes absent with the exception of Bojongo and Tiko. Also, the larger classes do not always have a smaller number of individuals than the smaller classes, which is observed in all localities. This change is more pronounced in Tiko where the last diameter class (D˃50cm) has more individuals than the middle classes. This structure is far removed from that of Thevand [17] which indicates that in the kaw mangroves in Guyana, the histogram of distribution of individuals by diameter shows that 74.93% of individuals have a diameter of less than 5cm, only a few individuals exceed 10cm in diameter and are the furthest from the waterfront. It is important to note that localities where the plots have been established are affected by logging, although it is more important in the vicinity of fishing camps for fishing and all classes of diameters are affected. On the other hand, Din [15] believe that although all classes are concerned, it is the fourth class (30 < D ≤ 40cm) who are most exploited for Rhizophora spp. and cutters operate trees with an average diameter of 32cm (31.36 ± 11.92cm).
The work of Gehring [18] confirmed that Chest Diameter (DBH) and height are standard parameters for studying trees. Despite numerous disturbances, the sampled communities have well-developed mangrove ecosystems because for Pellengrini [19], mangroves with a DBH between 27.0 and 29.9cm and an average height of the most developed trees of 17.7 to 21.2m have a maximum development structure. Thus, more than half of the localities, namely Bobongo, Bojongo, Essengue, and Limbe, can be classified as intermediate development structure, the other localities (“Bois des Singes”, Bojongo and Limbe) have a minimum development structure according to the values reported by Pellengrini [19].
Basal areas are variable and low in study communities. Thus, the plots with a higher basal area (Tiko, Essengue) correspond to adult vegetation facies. This is the view of Ondo [20] that low basal areas correspond to young or juvenile stands, while strong basal areas suggest a mature stand. This author also points out that for an adult stand consisting mainly of Avicennia germinans, because of the relatively large differences between individuals, in the case of falling tree, regeneration is ensured quickly, which increases density obtained basal area values ranging from 11.93 to 43.07 m2 ha-1 for all facies in the mangroves of the Sinnamary basin in French Guiana. Basal areas in this study (27.87 to 115m2 ha-1) are greater or equal to those obtained by Perera [21] and [22] in a mangrove in Sri Lanka with values ranging from 27.10 to 48.25m2 ha-1. However, our basal area values are much higher than those obtained by Maia [23] which range from 0.60 to 2.97m2 ha-1 in the mangroves of the estuaries of Brazil and those obtained by Aheto [24] in the mangroves of the Kakum River estuary in Ghana. The basal areas in this study are also higher than those obtained by Din [10] which find average basal area of 8.804m2 ha-1 for Rhizophora racemosa and 5.167m2 ha-1 for Avicennia germinans in the mangroves of the Wouri estuary.
Conclusion
The free and gratis exploitation of the natural resources of the mangroves leads to its degradation, the absence of the use of these resources can also become a disadvantage because the progressive dynamics of the mangroves can lead to obstruction. Therefore, the preservation of this ecosystem, which should be accentuated in the Bobongo and Essengue sites, which are distinguished by a low density of individuals, does not necessarily mean full protection of any activity. In an unstable environment, maintaining this ecosystem requires the constant reshuffling of its impacts thanks to their plasticity. It is not an identical posture or a return to any “stable state” like the climax, but to set up a new dynamic ‘balance’.
References
- Dahdouh GF, Collin S, Seen LD, Rönnbäck P, Depommier D, et al. (2006) Analysing ethnobotanical and fishery-related importance of mangroves of the East-Godavari Delta (Andhra Pradesh, India) for conservation and management purposes. Journal of Ethnobiology and Ethnomedecine 2: 1-24.
- Alongi DM (2008) Mangrove forest: Resilience, protection from tsunamis and responses to global climate change. Estuarine Coastal and Shelf Sciencce 76(1): 1-13.
- Hong PN, San HT (1993) Mangrove of Vietnam. IUCN, Switzerland.
- Lin BB, Dushoff J (2004) Mangrove filtration of anthropogenic nutrients in the rio coco solo, Pancompama. Management of Environmental Quality 15: 131-142.
- Alongi DM (2011) Carbon payments for mangrove conservation: Ecosystem constraints and uncertainties of sequestration potential. Environmental Science & Policy 14(4): 462-470.
- Ellison JC (2003) How South Pacific mangroves may respond to predicted climate change and sea-level rise. Advances in Global Change Research 2: 283-300.
- Nitto D, Dahdouh GF, Kairo JG, Decleir H, Koedam N (2008) Digital terrain modelling to investigate the effects of sea level rise on mangrove propagule establishment. Marine Ecology Progress Series 356: 175-188.
- Kumara MP, Jayatissa LP, Krauss KW, Phillips DH, Huxham M (2010) High mangrove density enhances surface accretion, surface elevation change, and tree survival in coastal areas susceptible to sea-level rise. Oecologia 164(2): 545-553.
- Din N (2001) Mangrove du Cameroun: Statut écologique et perspectives de gestion durable. Thèse d’Etat, Univ Yaoundé I, Cameroun. p. 268.
- Din N, Massou NVM, Essomè KGL, Nsombo E, Kottè MEF et al. (2017) Impact of urbanization on the evolution of mangrove ecosystems in the Wouri river estuary (Douala Cameroon). In: CW Finkl, C Makowski (Eds.). Coastal wetlands: Alteration and remediation. Springer International Publishing AG, pp: 81-131.
- Nfotabong A, Din N, Longonje SN, Koedman N, Dahdouh F (2009) Commercial activities and subsistence utilization of mangrove forests around the Wouri estuary and the Douala-Edéa reserve (Cameroon). Journal of Ethnobiology and Ethnomedicine 5: 35.
- Massou VM, Essomé KGL, Mapoko EF, Din N (2014) Biology and distribution of mangrove crabs in the Wouri river estuary, Douala, Cameroon. Journal of Water Resource and Protection 6(4): 236-248.
- Massou VM, Din N, Kenne M, Dongmo AB (2018) Brachyuran crab diversity and abundance patterns in the mangroves of Cameroon. Regional Studies in Marine Science 24: 324-335.
- Rajkaran A, Adams J, Taylor R (2010) Historic and recent (2006) state of mangroves in small estuary from Mlalazi to Mtamvuna in kwa zulu-natal, South Africa. Southern Forests 71(4): 287-296.
- Din N, Massou NVM, Kottè ME, Mongo MCE, Essomè KLG (2014) Evolution of mangrove crabs distribution in the Atlantic coast of Cameroon. In: Ardovini C (Ed.), Crabs: Global Diversity, Behavior and Environmental Threats. Nova Sciences Publishers, USA, pp. 161-180.
- Essomè GL, Massou VM, Kottè EF, Bilong P, Din N (2017) Diversity shifts in the mangrove vegetation of the rio del Rey estuary (Cameroon). International Journal of Research Studies in Biosciences 5(4): 6-14.
- Thevand A (2002) Structure et dynamique des mangroves de la région de Kaw (Guyane Française), Etude par télédétection et analyse in-situ. Mémoire de DEA, France.
- Gehring C, Park S, Denich M (2008) Close relationship between diameters at 30cm height and at breast height. Acta Amazonica 38(1): 71-76.
- Pellengrini JAC, Soares MLG, Chaves FO, Estrada GCD, Cavalcanti VF (2009) A method for the classification of mangrove forests and sensitivity/ vulnerability analysis. Journal of Coastal Research 56(1): 443-447.
- Ondo AE (2006) Dynamique des paysages végétaux du littoral centre-ouest du gabon autour de port-gentil: Approche spatial et analyse des données du terrain. Thèse de Doctorat. Université Paul Valéry Montpellier, p. 302.
- Perera KARS, Amarasinghe MD, Somaratna S (2013) Vegetation structure and species distribution of mangroves along a soil salinity gradient in a micro tidal estuary on the north-western coast of Sri Lanka. American Journal of Marine Science 1(1): 7-15.
- Peet RK (1974) The measurement of species diversity. Annual Review of Ecology and Systematic 5: 285-307.
- Maia RC, Coutinho R (2012) Structural characteristics of mangrove forests in Brazilian estuaries: A narrative study. Revista de Biología Marina y Oceanografía 47(1): 87-98.
- Aheto WD, Aduomih AA, Adzesiwor OE (2011) Structural parameters and above-ground biomass of mangrove tree species around the Kakum river estuary of Ghana. Annals of Biological Research 2(3): 504-514.
© 2021 Ndongo Din. This is an open access article distributed under the terms of the Creative Commons Attribution License , which permits unrestricted use, distribution, and build upon your work non-commercially.
 a Creative Commons Attribution 4.0 International License. Based on a work at www.crimsonpublishers.com.
Best viewed in


.jpg)


 Editorial Board Registrations
 Submit your Article
 Refer a Friend
 Advertise With Us
.jpg)


.jpg)


.bmp)
.jpg)
.png)
.jpg)


.jpg)


.png)

.png)


.png)


