- Submissions

Full Text
Examines in Marine Biology & Oceanography
Ocean Temperature Changes and Sea Level Changes
Nils Axel Mörner*
Department of Paleogeophysics & Geodynamics, Sweden
*Corresponding author: Nils Axel Mörner, Department of Paleogeophysics & Geodynamics, Sweden
Submission: March 05, 2020;Published: March 18, 2020

ISSN 2578-031X Volume3 Issue4
Abstract
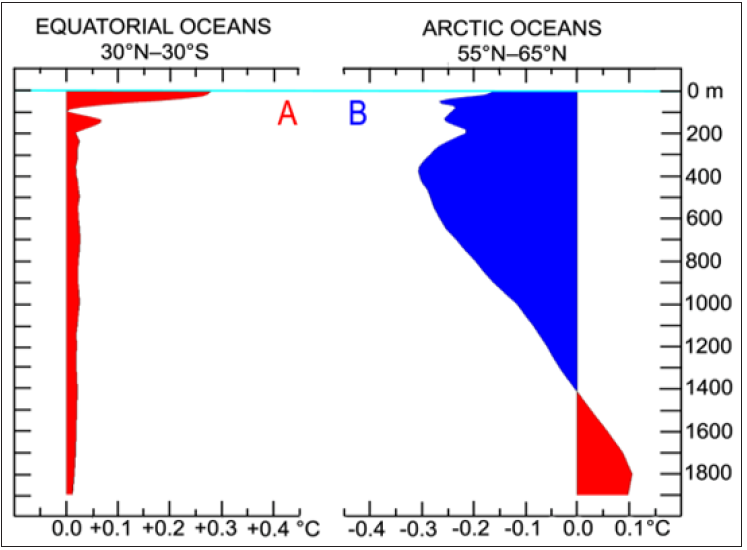
Thermal expansion and contraction affect the ocean surface level. With the installation of the ARGO temperature measurements in 2004, we now have high-precision records of the changes in temperature both in horizontal and vertical dimension. In the Equatorial region (30 °N-30 °S) there has been a warming of about 0.25 °C in the uppermost 50-70m. This would rise sea level by about 1.2mm. In the Arctic region (55 °N-65 °N) there has been a cooling of about 0.20 °C in the upper 1400m. This would lower sea level by about 4.9cm. This invalidates previous global thermal expansion estimates.
Keywords: ARGO temperature; Ocean water expansion; Ocean water contraction; Sea level changes
Introduction
Changes in temperature and salinity of the ocean water will affect sea level [1]. This is known as steric effects or “thermal expansion” [2]. To measure ocean temperature changes is both complicated and linked to large uncertainties. Therefore, old measurements [3] are quite hypothetical. With the establishment of the ARGO global observational system in 2004 [4], we suddenly got high quality measurements of temperature and salinity from the surface down to 2000 m via the continual monitoring of temperature and salinity from 3800 free-drifting floats. We use the ARGO database and address its expected effects on sea level.
ARGO temperature with latitude and depth
The measured changes in temperature by depth and time is often given as a curve of mean global changes in temperature [5,6]. Figure 1 gives the ARGO data [6,7], divided up in two groups:
- For the Equatorial region of 30 °N-30 °S, and
- For the Arctic region of 55 °N-65 °N.
Whilst the Equatorial region shows a temperature warming of 0.25 °C (2004-2019), which is confined to the uppermost 50-70m, the Arctic region shows a temperature cooling of about 0.20 °C reaching down to 1400m. This means opposed climate trends.
Conversion of temperature into ocean expansion/contraction
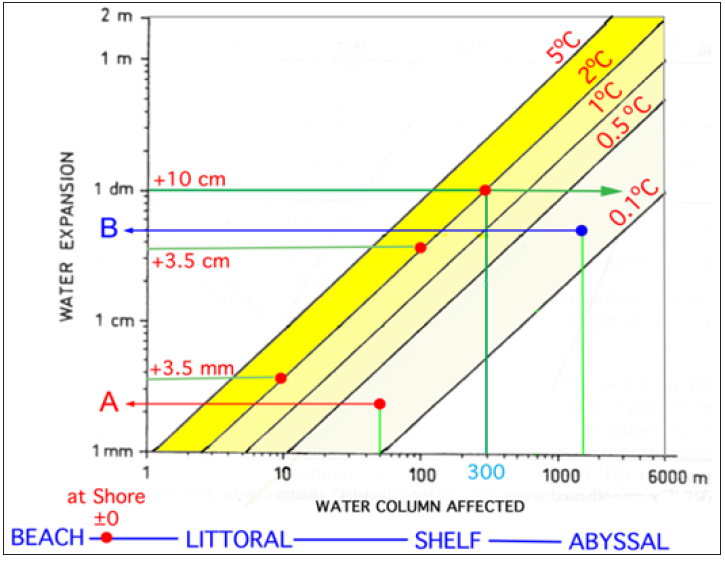
The temperature change observed (Figure 1): 0.25 °C warming in the uppermost 50-70m in the Equatorial region (A), and 0.20 °C cooling in the upper 1400m of the Arctic region (B) are in Figure 2 plotted into the diagram of expansion/contraction with respect to temperature and ocean depth [2,8]. The observed changes in temperature in the Equatorial (A) and Arctic (B) latitudes are in Figure 2 converted to corresponding expansion (warming) and contraction (cooling) of the water column (i.e. steric sea level). In the Equatorial region:
- Sea level should rise by 1.2mm, and in the Arctic region
- Sea level should fall by 4.9cm.
This means opposed changes in sea level in the Equatorial and Arctic regions, in full agreement of the concept of “rotational eustasy” [9], but in disagreement with the use of values of “global thermal expansion” [10].
Discussion
According to the IPCC [10] the rate of global mean thermal expansion is 1.1mm/year. Figure 1 records a temperature rise over the last 15 years, which corresponds to a thermal expansion in the Equatorial regions (Figure 2) of 1.2mm. Converted to rate this would imply a rate of sea level rise of 0.08mm/yr. In the Arctic region, there was a cooling reaching 1400m down (Figure 1), corresponding to a sea level fall of 4.9mm (Figure 2); i.e. a sea level lowering at a rate of -3.3mm/year. The ARGO data are superior to previous estimates of changes in temperature with time, ocean depth and latitudes.
Figure 1: ARGO temperature records 2004-2019 in the Equatorial latitudes (A) and in the Arctic latitudes (B) from the ocean surface down to 1900m: blue = cooling, red = warming.

Figure 2: Relations among water expansion (or contraction), water column affected and temperature change in °C [2]. The observed changes in temperature (Figure 1) for the Equatorial latitudes and the Arctic latitudes are marked as A and B providing an expansion of +1.2mm for A (red dot) and a contraction of -4.9cm for B (blue dot).

Conclusion
High-quality temperature measurements by the ARGO system provide strongly different records in absolute values, differentiation with latitudes and variations with depth (Figure 1). The records obtain give a rise of 1.2mm in the Equatorial region and a 4.9cm fall in the Arctic region (Figure 2). This means opposed trends in the Equatorial and Arctic regions [9]. To speak about global meant thermal expansion [10] is no longer tenable and should be classified as misleading.
References
- Fairbridge RW (1961) Eustatic changes in sea level. Phys Chem Earth 4: 99-185.
- Mörner NA (2017) Thermal expansion. Encyclopedia of Coastal Science.
- Levitus S (1983) Climatological atlas of the world Ocean. NOAA Prof Papers 64(49): 962-963.
- http://www.argo.ucsd.edu.
- https://www.nodc.noaa.gov.
- Humlum O (2020) Climate4you update January 2020.
- http://www.argo.ucsd.edu.
- Mörner N A (2011) Setting the frames of expected future sea level changes by exploring past geological sea level records. In: Easterbrook DJ (Ed.), Evidence-based climate science. Netherlands, pp. 185-196.
- Mörner NA (2019) Rotational eustasy as understood in Physics. International Journal of Earth & Environmental Sciences 10(6): 709-723.
- IPCC (2013) Climate Change. pp. 1137-1216.
© 2020 Nils Axel Mörner. This is an open access article distributed under the terms of the Creative Commons Attribution License , which permits unrestricted use, distribution, and build upon your work non-commercially.
 a Creative Commons Attribution 4.0 International License. Based on a work at www.crimsonpublishers.com.
Best viewed in


.jpg)


 Editorial Board Registrations
 Submit your Article
 Refer a Friend
 Advertise With Us
.jpg)


.jpg)


.bmp)
.jpg)
.png)
.jpg)


.jpg)


.png)

.png)


.png)


