- Submissions

Full Text
Examines in Marine Biology & Oceanography
Segments and Gaps in Tide Gauge Records
Nils Axel Mörner*
Department of Paleogeophysics & Geodynamics, Sweden
*Corresponding author: Nils Axel Mörner, Department of Paleogeophysics & Geodynamics, Sweden
Submission: December 02, 2019;Published: December 11, 2019

ISSN 2578-031X Volume3 Issue2
Abstract
The tide-gauge stations all over the globe frequently include gaps, earthquake deformations of reference level, damages of stations and re-locations of sites. In meaningful reconstruction of past sea level change all such structures must be handled with great care. In the original databases of PSMSL and NOAA they are ignored, invalidating meaningful long-term mean trend analyses.
Keywords: Tide gauge records; Sea level changes; Trends; Segments; Gaps
Introduction
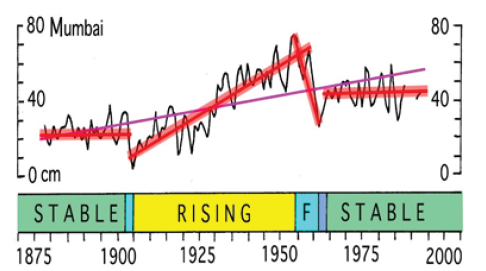
The word “segment” in sea level analyses has been differently used. Mörner [1-3] used it to denote segments of sea level changes that had to be characterized individually-in contrast to linear trends ignoring the observational records. Because tide gauges in Mumbai and in Visakhapatnam located on opposed sites of the Deccan Plateau record the same four-parted segments, I interpreted these segments as records of eustatic changes (Figure 1). Parker [4,5], on the other hand, used segmentation to denote interruptions and gaps in the tide-gauge recording.
Figure 1: The Mumbai tide gauge record showing a fourfold record in the last 150 years: A stability, 1885-1902; a rise, 1905-1955; a fall, 1955-1962; a stability over the last 50 years. The thin purple line provides a totally meaningless linear trend analysis of +0.77mm/yr by [6].

Material
Many sea levels records in the PSMSL and NOAA tide-gauge databases do, in fact, not refer to continual, but interrupted records. Those interruptions may be of different types:
- Interruptions in the recording (due to technical or social problems).
- Sudden changes of the reference level due to earthquakes.
- Damage of the recording station due to events like tsunamis and hurricanes, and
- Changes in the location of the tide-gauge station.
Interruptions
Sometimes there are interruptions in the recording at a tide gauge station due to technical and social problems. Usually such problems do not affect meaningful evaluations. Parker showed that gaps in the tide-gauge recording are far more common that generally believed and are usually ignored in the databases of NOAA and PSMSL. To make sense out of these “segmented” (or rather “fragmented”) records is complicated, uncertain and sometime even impossible [4-6].
Earthquake Effects
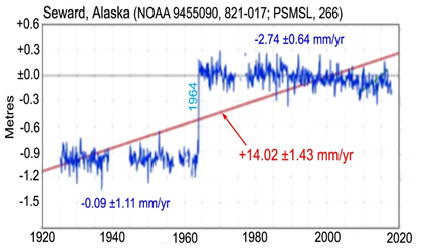
Figure 2: Tide-gauge record from Seward, Alaska, as presented by NOAA and PSMSL with red line providing a mean trend ignoring the 100 cm earthquake induced jump in 1964 (modified from Wysmuller [7]).

Earthquakes may alter the elevation of the reference level. Wysmuller [7] refers to a terrible misuse of actually observed tidegauge measurements at Seward station in Alaska (Figure 2). The record spans 90 years. The area was struck by Alaska 1964 megaearthquake of magnitude 9.3, which left striking evidence in the tide-gauge record as an instantaneous rise in relative sea level by about 100cm (due to a 1.0m crustal down-faulting). Prior to the earthquake, sea level remained more or less stable for 40 years (-0.09±1.11mm/yr), and after 1964 it shows a 50 years’ long period of relative sea level lowering due to crustal uplift at a mean rate of -2.74±0.64mm/yr. In the original databases of both NOAA and PSMSL the record from the Seward station was given as a longterm sea level rise of +14mm/yr (Figure 2), which must be held as a vulgarization of how tide-gauge records should be analysed [7].
At the 2009 Samoa earthquake, the picture was even more complicated with the interaction between crustal movements, gravitational adjustment and sea level changes [8] invalidating simple mean rate analyses of tide-gauge records.
Damage of the Tide Gauge Station
Big storms, hurricanes and tsunami events may damage a tide-gauge station. This may generate differences in the recording before and after the damage, usually implying that the sea level analysis must be divided in independent segments before and after the event.
Changes in the Location of the Tide-Gauge Station
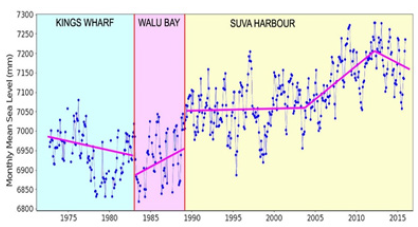
A change of the location of a tide-gauge station generally implies such a serious break that the records should be treated as two independent records. A good example of this is the Suva tidegauge station in Fiji, which was moved three times. Therefore, Mörner & Matlack-Klein [8] divided the record up in 3 independent segments (Figure 3).
Figure 3: The complex tide-gauge record at Suva cut up in three segments representing the location of the station at Kings Wharf, Walu Bay and Suva Harbour [8]. Each segment must be analyzed by itself.

Continual Records
The ideal is to have long and continual records from regions where the crustal component is known in great details. There exist a number of such sites [9,10]. The tide-gauge stations of Korsør and Slipshavn (Nyborg) in Denmark rising continually for 125 years at a mean rate of +0.83±0.17mm/yr and +1.07 ±0.14mm/yr, respectively [11]; Korsør representing crustal stability (±0.0 mm/ yr) and Slipshavn a slow crustal subsidence (-0.1mm/yr) during the last 8000 years [9]. This gives a eustatic component o about +0.9mm/yr and an absence of acceleration during the last 125 years, which are fundamental pieces of information in the study of present sea level changes [9,10].
Conclusion
Tide-gauges records are unfortunately full of gaps and fragmented records, and re-locations of stations. This implies that great care must be taken when calculating rates of sea level changes. The PSMSL and NOAA databases provide mean rates of sea level change ignoring gaps, earthquake deformation of reference level and re-location of sites. This generates errors and misleading information. (In the latest NOAA database [11], the Seward station is treated correctly). Meaningful sea lever estimates can only be achieved from tide-gauge data if relevant care is taken to the occurrence of intervals, earthquake events, damages of stations and re-location of stations.
References
- Mörner NA (2010) Sea level changes in Bangladesh. Energy & Environment 21: 235-249.
- Mörner NA (2013) Sea level changes past records and future expectations. Energy & Environment 24(3/4): 509-536.
- Mörner NA (2017) Coastal morphology and sea-level changes in Goa, India during the last 500 years. Journal of Coastal Research 33(2): 421-434.
- Parker AO, Clifford DO (2017) Is sea level stable at Aden, Yemen? Earth Systems and Environment 1: 18.
- Parker A (2016) The claim of a high rate sea-level rise for Diego Garcia is based on non-existing data. New Concepts in Global Tectonics Journal 4: 688-692.
- Unnikrishnan AS, Shankar D (2007) Are sea-level-rise trends along the coasts of the north Indian Ocean consistent with global estimates? Global Planetary Change 57(3-4): 301-307.
- Mörner NA, Wysmuller T, Parker A (2019) The views of three sea level specialists. Journal of Marine Science Research and Oceanography 2(1): 1-5.
- Mörner NA, Matlack KP (2017) The Fiji tide-gauge stations. International Journal of Geosciences 8: 536-544.
- Mörner NA (2014) Deriving the eustatic sea level component in the Kattegatt Sea. Global Perspectives on Geography 2: 16-21.
- Mörner NA (2014) Sea level changes in the 20th and 21st Coordinates Magazine 10(10): 15-21.
- NOAA (2019) Tides & currents. Sea Level Online.
© 2019 Nils Axel Mörner. This is an open access article distributed under the terms of the Creative Commons Attribution License , which permits unrestricted use, distribution, and build upon your work non-commercially.
 a Creative Commons Attribution 4.0 International License. Based on a work at www.crimsonpublishers.com.
Best viewed in


.jpg)


 Editorial Board Registrations
 Submit your Article
 Refer a Friend
 Advertise With Us
.jpg)


.jpg)


.bmp)
.jpg)
.png)
.jpg)


.jpg)


.png)

.png)


.png)


