- Submissions

Full Text
Environmental Analysis & Ecology Studies
Impact of Climate Dynamics on Vineyards in the South-Eastern Region of Galati County, Romania
Ionela Daniela Fertu1, Claudia Simona Stefan1, Mihai Tudor1,2*, Aurel Ciubuca2 and Ciprian Grigorescu1
1Dunărea de Jos University of Galaţi, Romania
2Bujoru viticulture and wine making research facility, Romania
*Corresponding author:Mihai Tudor, Dunărea de Jos University of Galaţi, Romania
Submission: April 04, 2024; Published: May 10, 2024

ISSN 2578-0336 Volume12 Issue3
Abstract
Climate change concept includes all forms of climate variability on time scales greater than 10 years, regardless of the cause. Bujoru viticulture and winemaking research facility, is situated in the S-E geographical area of Romania, whit a specific 800m elevation for all vine plantations. Significant climate change manifestations has been documented since 2002. The most common phenomena witnessed was the manifestation of extreme drought. This phenomenon has amplified in recent years due to the lack precipitation during specific growing periods of the vines and high temperatures during vegetative phenophases. Climatic factor augmentation have obvious repercussions on grape quality and quantity. Our comparative climate data analysis has shown climatic parameter variations specific to both decades studied. Average values tell the truth about the extent of climate change. Soil moisture and water availability, calls into question sustainable viticulture strategies in Southeastern Romania.
Keywords: Climate change; Viticulture; Wine quality; Phenophases
Introduction
The World Meteorological Organization has established the use of “climate change” concept, to include all forms of climate variability reported on a time scale greater than 10 years, regardless of phenomenon etiology [1]. In 2013, the Intergovernmental Panel on Climate Change concluded that global warming was unequivocal (Intergovernmental Panel on Climate Change 2013) [2]. According to the latest IPCC report (IPCC, 2021), climate projections show that climate change phenomena will intensify during the 21st century. This will have a major impact on natural areas and ecosystems whit repercussions on human standard of life [3]. Different predictive climatic scenarios with varying intensities regarding the negative effects of climate change indicate an overall increase in global temperature [4].
Climate factors directly influence production yields in all types of vegetable foods and as a result can vary from year to year, therefore climate change inherently affects this sector [3,5]. Grape cultivation is not immune to variable environmental conditions [6]. These changes subject vines to climatic conditions that no longer fit specific weather norms for the viticultural area [7]. Wine quality and yield being strongly influenced by the climatic conditions [8,9]. Complex interactions between temperatures, water availability, plant material and viticultural techniques can alter wine defining aroma, in this sense constant viticultural technique adaptations are made in order to counteract climatic factor variations [2]. Weather data indicates that global ambient temperatures are increasing whit negative effects on vegetative phenophases [10]. Higher average temperatures during spring and summer modify harvest periods in all vineyards present around the world, with important variations in production yields and quality indices in the wine obtained for that certain vintage [11,12]. The present study looks at two different decades from a climate change perspective and how specific grape maturation indices are modified as a result of new environmental factor implication.
Material and Method
Experiments were carried out at “Bujoru” Research Facility, Galați County, Romania. 4 main grapevine genotypes were included in the study: White maiden, Muscat Ottonel, representing white grapevine varieties and respectively: Cabernet Sauvignon, Black maiden, for red grapevine varieties. For time dependent climate analysis two extremes where chosen: the first-time interval was 1989-1999 and the second was 2013-2023.
Climate analysis followed the variation of: Global heat balance, (Ʃt°g); Active thermal balance, (Ʃt°a); Useful heat balance, (Ʃt°u); Average temperatures in July, °C; Average temperatures in August, °C; Average temperatures in September, °C; Temp. min. absolute in air, °C; Maximum air temperature, °C; Ʃ annual precipitation, mm; Ʃ precipitation during the vegetation period, mm; Ʃ hours of insolation per vegetation period, hours; Average maximum temperatures in August, °C; Average temperature from the first and second decades of June; No. days with temp. maximums >30 °C; Duration of the bioactive period, no. days; Real Heliothermal Index (IHr); The Hydrothermal Coefficient (CH), the Bioclimatic Index (Ibcv); Oenoclimatic Aptitude Index (IAOe); Huglinheliothermic Index (IH); Night Cooling Index (IF).
Grape ripening evaluation, as well as environmental factors influence on grape quality and subsequently wine quality was carried out by monitoring the following parameters: endogenous amount of sugar/Kg in grapes, total acidity and specific constant mass for 100 grape berries. All determinations were performed in triplicate.
Result
Climatic data
Global heat, active and useful thermal balance were the first set of climatic factors analyzed. Figure 1 shows the specific variation of the mentioned climatic factors. Statistical analysis for 1989-1999 time interval revealed maximum values for: global heat -3860-, active -3836- and thermal -2036- balance specific to 1994. By comparison for 2013-2023, maximum values of the same parameters registered the following values: 3561 (global heat balance), 3527(active thermal balance) and 1737 (useful heat balance). These parameter maxima were registered in 2018. From these results higher values for global and active thermal balances were specific for 1989-1999 time interval. In the case of useful heat balance monitored from 2013-2023, a decline of maximum values by 14.68% was observed when compared to the first decade. Important variation of temperature indices was seen between the two analyzed decades. Highest absolute values were seen for the analyzed periods (Figure 2).
Figure 1:Global heat, active and useful thermal balance variation specific to studied decades.
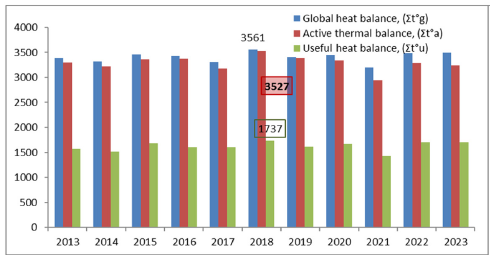
Figure 2:Temperature indices variation.

Temperature indices reveal the highest average temperature of 39.5 ˚C recorded in 1994 with average annual values of 11.65 ˚C. Lower maximum temperatures were characteristic for 2013-2023 whit a value of 38.0 ˚C and higher medium temperature values of 11.8 ˚C for 2023. On the other hand, minimum values for average temperatures specific for 2013-2023 interval was 10.8 ˚C recorded in 2014 and 2017 by comparison whit a value of 10.6 ˚C recorded in 1997. Absolute minimum values remain specific to January and February for both decades studied. Average absolute minimum temperatures from 2012-2023 were situated at a value of -17.1 ˚C, 0.2 ˚C higher than -17.3 ˚C an average value obtained from 1989- 1999. Statistical data analysis showed low points in absolute minimum temperatures to values of -23 ˚C (year 2015), were as the minimum absolute temperature value for the first analyzed decade reached -19 ˚C (year 1996).
In depth analysis of temperature variations revealed that, specific for 1989-1999 decade, average temperature values reached high points in July whit gradual temperature decreases of 5.45% in August and 29.12% in September. When the same statistical analysis was applied for 2013-2023 time interval, July temperature values of 22.74 ˚C, were lower by 2.15% compared to the maximum August average temperature of 23.24 ˚C. For the month of September, temperature declines registered a 22.75% drop compared to July values and a 24.39% drop compared to August average values.
The average maximum temperature specific for August increased by 1.03 ˚C, between the two studied decades. Maximum average temperatures in August reached 29.98 ˚C from 2013- 2023, while from 1989-1999 maximum average temperatures in August reached 28.95 ˚C. Total number of days whit temperatures over 300C increased by 13.1 when 1989-1999 interval was used as a reference. The Oeno-climatic Aptitude Index (IAOe) suffered a 2.99% increase, whit average values of 4700.25 for 213-2023 and 4599.25 for 1989-1999. Real Heliothermic Index (rHI) had a base average value of 2.22 and increased to 2.45 in the time interval 2013-2023. Data regarding mentioned climatic parameters are detailed in Table 1. Soil water availability has recently gone on a downward trend. Figure 3 shows annual precipitations and precipitations during vegetation periods.
Table 1:
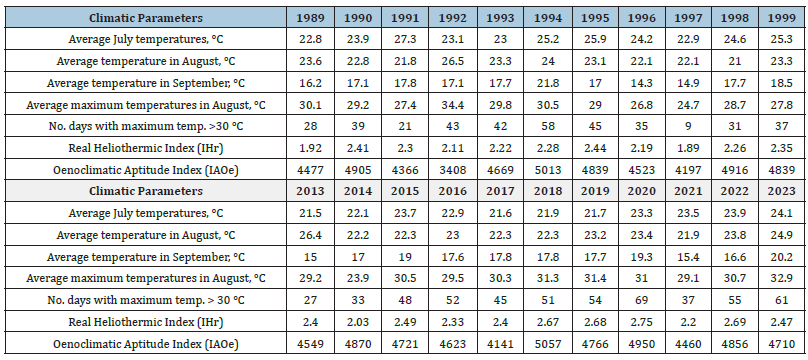
Figure 3:Annual precipitations and precipitations during vegetation periods variations.

Water input had an average value of 497.6mm and average values for precipitations during vegetative phases of 302.1mm recorded for 2013-2023. Minimum average values of 346.6mm were recorded consecutively in 2022 and 2023. Compared to 1989- 1999 decade average precipitations suffered an increase of 7.55%. Even though the availability of water in soil increased, the quantity of precipitations during vegetative periods decreased by 4.43%. Compared to a maximum value of 713.1mm for total precipitations specific to 2013, the values recorded in 2022 and 2023 suffer a reduction by 48.56%. The lowest values in precipitations for 1989- 1999 were recorded in 1994 (286.1mm), whit a value for total quantity of precipitations during vegetative periods of 194.1mm.
Average precipitation values during vegetation periods is another climatic factor that has a major influence on the vineyard plantations. In this sense, in 2023 water accumulated as a result of precipitation during vegetation periods reached an average value of 233mm. This value represents the minimum recorded for the time period included in the study, namely 2012-2023. Cool night index an important climatic parameter that has great influence over grape maturation showed important variations (p<0.5) whit maximum values 14.1 in 1994 and 13.6 in 2015. Average values reached 10.33 (2013-2023) and 10.81 (1989-1999) (Figure 4 & 5).
Figure 4:Cool night values (1989-2023).
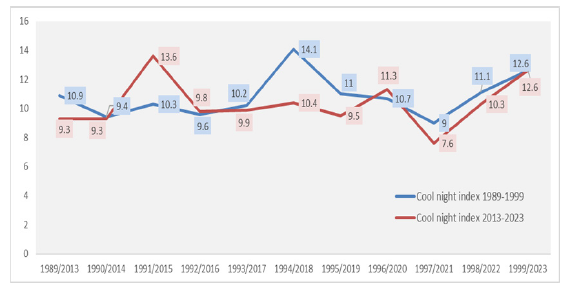
Figure 5:Huglin Index variation (1989-2023).
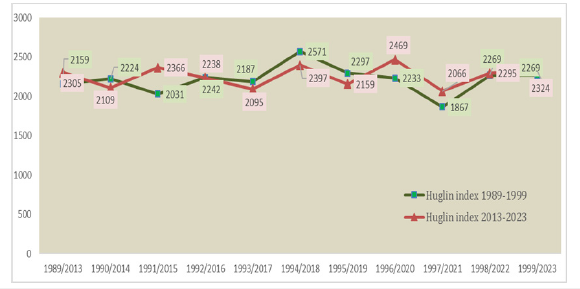
The average values of 2256.64, for Huglin index, suffered a slight increase for 2013-2023 interval. Maximum values for Huglin index reached a value of 2469 specific for 2020 whit am minimum of 2066 specific for 2021. By comparison, Huglin index values for 1989-1999 reached an average of 2213.55 and maximum values were 4.26% higher than those registered in 2020. The minimum value of 1867 was 9.63 % lower than the minimum value specific for the second decade studied.
Maturation Parameters Analysis
Grape maturity evaluation with the help of specific parameters identified specific variations dependent on vine variety and climatic conditions (Figure 6). Analysis reveals differences of 4.4% on total sugar concentrations between white and red wine varieties from 2013-2023 compared to the difference of 3.2% registered from 1989-1999. Minimum sugar concentration was specific to White maiden, 171g/kg, and Merlot wines 181g/kg, values registered in 2013. This ranking was reversed for the first decade studied, whit minimum values characteristic for Muscat Ottonel, 119g/kg and 166g/kg for Black maiden. Between 1989-1999 maximum total sugar content reached a value of 229g/kg, the highest value recorded for both time intervals studied. Total sugar content varied between 166-229g/kg, extreme values belonging to 1989-1999 interval. For the second decade, maximum values showed an 8% variation between varieties, whit maximum values reached in 2023. Highest sugar concentration in red genotypes, were specific for Cabernet Sauvignon whit 208g/kg followed by Black maiden 207g/kg, white genotypes were characterized by values of 204g/kg in Muscat Ottonel 2019.
Figure 6:Total Sugar content specific to genotype and vitage.
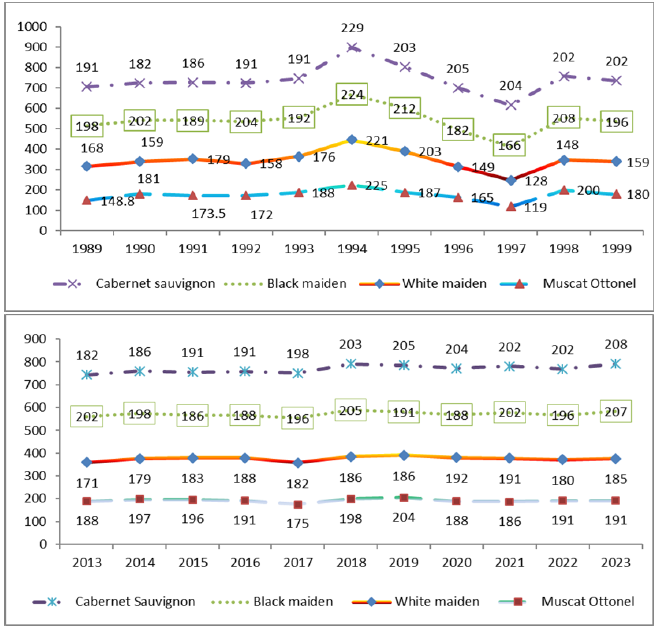
Average concentrations for total sugar content registered an increase in values for white varieties. Average values for White maiden and Muscat Ottonel varieties were significantly higher (p<0.5), whit values of 183.91g/kg and 191.36g/kg, 2013-2023 decade. By comparison total sugar content for studied white varieties were situated at values of 168g/kg (White maiden) and 173.6g/kg (Muscat Ottonel) for 1989-1999 time interval. Red varieties average sugar content reached values of 197.55g/kg (Black maiden), 198.73g/kg (Cabernet Sauvignon) for 1989-1999 interval and 195.67g/kg (Black maiden), 196.92g/kg (Cabernet Sauvignon) for 2013-2023 time interval. Average values for red varieties showing slightly lower average concentrations by comparison between the two analyzed decades (p<0.05).
Total acidity registered a descending trend whit average values of 5.50 (White maiden), 4.76 (Muscat Ottonel), 7.45 (Black maiden) and 6.81(Cabernet Sauvignon) when compared to 1989- 1999 initial average values. Figure 7 shows total acidity decrease in all genotypes studied. Minimum values decreased by 14.21% in white varieties and 1.65% for red ones. Red genotypes registered higher total acidity values when compared to white genotypes whit maximum values specific to Black maiden (9.8). Constant mass for 100 grape berries ranged from 78-236g in white varieties and 82-163g for red varieties, 1989-1999, whit minimum values specific to 1994. From 2013-2023 constant mass variation specific for 100 grape berries ranged from 80-215g in white genotypes, with minimum values observed in 2012 for White maiden. For red genotypes, a consecutive decline in constant mass values was observed in 2022 and 2023 whit values ranging between 105- 73g/100 grape berries. Figures 7 & 8 show average value variations of total acidity and constant mass of 100 grape berries.
Figure 7:Total acidity variation 1989-2023.
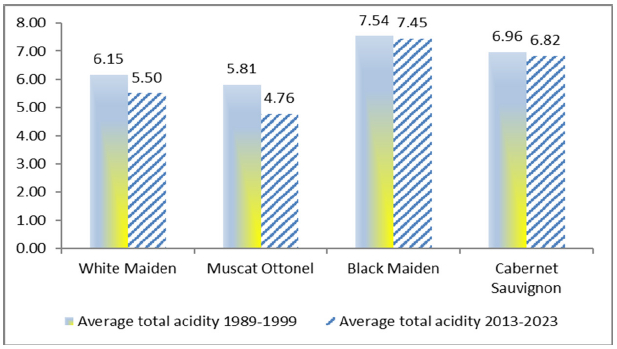
Figure 8:Constant mass for 100 grape berries 1989-2023.
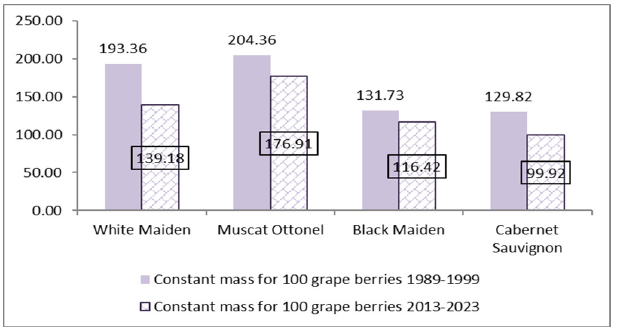
Average values for 100 grape berries varied between 204.36g for Muscat Ottonel and 129.82g for Cabernet Sauvignon varieties. From 2013-2023 constant mass average values were situated between 176.91g and 99.92g. Maximum average values being specific for Muscat Ottonel for both intervals monitored. Berry mass declined whit variable amounts dependent on genotype characteristics. The most notable decline in constant mass for 100 grape berries was seen in White maiden varieties that registered an average 28.02% reduction. For red varieties, Cabernet Sauvignon suffered a 23.03% in constant mass reduction, followed by Muscat Ottonel 11.43% and Black Maiden whit 11.62%.
Discussion
Statistical analysis performed on meteorological data collected at Bujoru wine and viticulture research station shows the impact of climate change on specific grape maturation and wine quality parameters. Average global temperature increased corroborated with a decrease in of precipitation in vegetative periods following a trend observed in previous studies carried out by Enache et al. [13]. The starting point for climate data collection for the specific Bujoru viticultural area was 1986 and shifts in the water and thermal regime were observed since 2010 [14]. In the current study climatic data obtain from 1989-1999 time interval were considered the baseline for climate change evaluation. Analysis of this meteorological data surprisingly showed that 1994 was an atypical year that registered extreme values when compared even to 2013-2023 interval. Although this year was characterized by extreme values, it wasn’t stricken out of our statistical analysis and latest average temperature analysis showed significant increases of temperature indices like: Global heat balance, (Ʃt°g); Active thermal balance, (Ʃt°a); Useful heat balance, (Ʃt°u). Climatic studies conducted in the western part of Balkans showed that climacteric parameters suffered similar changes [15]. Results obtained by Trbic et al. [15] using climatic previsions confirm some data seen by us in 2022 and 2023. Studies carried out in the Mediterranean viticultural areas also confirmed current data collected by our study [16,17]. Significant increase in number of days with temperatures >300C and average maximum temperatures in August °C (p<0.5) documented in our research were also observed by Costa et al. [17] in their study. A shift in maximum temperature normally specific for the month of July, according to data collected and analyzed from 1989-1999, was observed. New climatic data obtain as a result of statistical analysis from 2013-2023 showed gradual temperature parameter decreases in July whit specific increases in August, that suggest season shifts. Climate projections obtained from 2018 climatic studies done by Lazoglou et al. [8] confirm latest data obtain, involving temperature parameters [8]. Important variations of Oenoclimatic Aptitude Index (IAOe); Huglinheliothermic Index (IH); Night Cooling Index (IF) that determine vital in grape maturation and wine yield and quality were observed. Increase of the mentioned parameters threatens current vine plantation sustainability. Previous previsions regarding Romanian vine sustainability done by Irimia et al. [18], are confirmed by current study results.
Precipitation decreases all year round determining the appearance of a new set of challenges in terms of ensuring viticultural sustainability. Studies by Llana & McGregor (2022) also identify a frost risk potential in vineyards as a result of a lack snowfalls. These risks may also apply to the Bujor viticulture areal area as a result of the negative day and night temperatures that are specific in the winter months. Minimum temperature data analysis revealed that even though minimum average temperatures have increased, there are some extreme values registered reaching values below -20 ˚C. Due to season shifts, there is a real risk of early spring frost damage documented by Poni et al. [19] in studies conducted in Tuscany region of Italy [19].
Comparative analysis of precipitation parameters for the selected decades showed a sustained water deficit specific for 2022 and 2023. Not all data collected suggest that, from 1989 to 1999, water availability was greater, but the latest data underlines the fact that average water input has diminished. Santorini climate change studies confirm data seen in 2022 and 2023 in Bujoru viticultural area. Results obtained by Xyrafis et al. [16] offer possible climate perspectives and precipitation previsions [17]. Decreases in Ʃ annual precipitation, mm; Ʃ rainfall during the vegetation period, mm had a negative impact on production yields and quality of wines obtained [16,17]. As observed in Bujoru wine yield registers. Vegetative phase delays been described since 2005 in of some viticultural areas located in the southern regions of Italy, due to environmental change as a result of climatic factors values listed previously [5].
Deficient distribution of precipitation during spring and early summer causes lengthen drought periods [20]. These changes cause an increase in the amount of total sugar, decrease in pH and grape berry weight. These modifications were apparent as a result of comparative data analysis between the two decades analyzed by our research. Maturation parameter alteration has a negative impact on production yields but also can modify wine zonal specificity. Such changes were recorded by Droulia F & Charalampopoulos I [21], through data analysis reported from multiple viticulture areals situate in southwestern Europe.
Ripening indicators alterations are a consequence of climate factor modifications and have a direct impact on wine quality for that certain vintage [22]. Similar implications because of climate distortions were documented in southeastern Australia, producing changes both in specific vegetative phases and ripening indices [8]. Temperature increase, as well as soil moisture reduction, during the critical vineyard vegetative periods greatly modify all qualitative indices and production yields [23].
Climate change determines fundamental modifications for viticultural areas, causing a decrease in plant material quality and implicitly in finished product quality [24]. Some viticultural practices involve the use of plant growth regulators in order to counteract diminishing yields as a direct result of climate change [25]. Plant growth regulator overuse in vegetable cultivation has been documented in recent studies, whit values above EU current legislation [26]. Therefore, strategies that involve the use of this class of chemicals must take into account current food security legislation [27]. The worrying fact is that according to the latest meteorological data a trend that involves prolonged uncharacteristic periods of severe drought is repeating itself whit higher and higher frequency [28-37].
Conclusion
The present study highlights the extent and speed with which climate changes are occurring in a microclimate such as Bujoru viticultural area, whit possible extension to global interpretation. Even though our comparative climate data analysis has shown climatic parameter variations specific to both decades, average values tell the truth about the extent of climate change. Global warming phenomenon determines the use of new strategies that aim at preserving traditional genotypes specific to Bujoru viticultural area that include the use of precision agriculture techniques and yield augmentation via plant growth regulators. Results showed a direct correlation between climate change and ripening indicators.
Climate analysis for 2022 and 2023 raises alarms regarding parameter modifications resulting prolonged drought phenomenon, which is becoming more common. Drought interval prolongation with drastic effects on soil moisture and water availability, calls into question sustainable viticulture strategies in Southeastern Romania. Current trend of extreme weather phenomena has devastating effects on vine plantations and should not be neglected [33]. Even though our comparative climate data analysis has shown climatic parameter variations specific to both decades, average values tell the truth about the extent of climate change.
References
- Papadavid G, Kountios G, Hadjimitsis D, Tsiouni M (2024) The use of precision agriculture for improving the water economics of farms and the need for agricultural advisory. Proceedings 94(1): 47.
- Perin C, Verma PK, Harari G, Fait A (2023) Influence of late pruning practice on two red skin grapevine cultivars in a semi-desert climate. Frontiers in Plant Science 14: 1114696.
- Van Dijk M, Morley T, Rau ML, Saghai Y (2021) A meta-analysis of projected global food demand and population at risk of hunger for the period 2010-2050. Nature Food 2(7): 494-501.
- Jackson DI, Lombard PB (1993) Environmental and management practices affecting grape composition and wine quality-A Review. Am J Enol Vitic 44: 409-430.
- Stock M, Gerstengarbe F, Kartschall T, Werner P (2005) Reliability of climate change impact assessments for viticulture. Acta Horticulturae 689: 29-40.
- Gouot JC, Smith JP, Holzapfel BP, Walker AR, Barril C (2019) Grape berry flavonoids: A review of their biochemical responses to high and extreme high temperatures. Journal of Experimental Botany 70(2): 397-423.
- Rienth M, Vigneron N, Darriet P, Sweetman C, Burbidge C, et al. (2021) Grape berry secondary metabolites and their modulation by abiotic factors in a climate change scenario-a review. Frontiers in Plant Science 12: 643258.
- Lazoglou G, Anagnostopoulou C, Koundouras S (2018) Climate change projections for Greek viticulture as simulated by a regional climate model. Theoretical and Applied Climatology 133: 551-567.
- Tarara JM, Lee J, Spayd SE, Scagel CF (2008) Berry temperature and solar radiation alter acylation, proportion, and concentration of anthocyanin in Merlot grapes. American Journal of Enology and Viticulture 59: 235-247.
- Met Office (2014) Too hot, too cold, too wet, too dry: Drivers and impacts of seasonal weather in the UK, Met Office: Exeter, England, UK.
- Nechita C, Iordache AM, Voica C, Costinel D, Botoran OR, et al. (2023) Evaluating the chemical hazards in wine production associated with climate change. Foods 12(7): 1526.
- Enache V, Donici A (2015) The adaptation to climate change a grapevine technologies. Scientific works horticulture series 58(2): 111-116.
- Enache V, Donici A (2012) Aspects of behavior of wine grapes in the Dealu Bujorului vineyard in terms of climate change, pp. 297-302.
- Enache Viorica (2010) Research on the behavior of grape varieties in the context of climatic change at Dealu Bujorului vineyard. Lucrari stiintifice, UASVM Iasi, Seria Horticultura 1(53): 425-430.
- Trbic G, Djurdjevic VI, Mandic MV, Ivanisevic M, Cupac R, et al. (2021) The impact of climate change on grapevines in Bosnia and Herzegovina. Euro-Mediterranean Journal for Environmental Integration 6: 1-9.
- Xyrafis EG, Fraga H, Nakas CT, Koundouras S (2022) A study on the effects of climate change on viticulture on Santorini Island. OENO one 56(1): 259-273.
- Costa JM, Egipto R, Aguiar FC, Marques P, Nogales A, et al. (2023) The role of soil temperature in mediterranean vineyards in a climate change context. Frontiers in Plant Science 14: 1145137.
- Irimia LM, Patriche CV, Roșca B (2018) Climate change impact on climate suitability for wine production in Romania. Theoretical and Applied Climatology 133: 1-14.
- Poni S, Sabbatini P, Palliotti A (2022) Facing spring frost damage in grapevine: recent developments and the role of delayed winter pruning-a review. American Journal of Enology and Viticulture 73(4): 211-226.
- Enache V, Donici A (2014) Research on minimizing the disruptive effect of climate change on viticulture by applying adapted technologies. UASVM Iași, Scientific Papers, Series Horticulture 57(2): 169-174.
- Droulia F, Charalampopoulos I (2021) Future climate change impacts on European viticulture: A review on recent scientific advances. Atmosphere 12(4): 495.
- Santos JA, Fraga H, Malheiro AC, Moutinho-Pereira J, et al. (2020) A review of the potential climate change impacts and adaptation options for European viticulture. Applied Sciences 10(9): 3092.
- Gutiérrez-Gamboa G, Zheng W, de Toda FM (2021) Current viticultural techniques to mitigate the effects of global warming on grape and wine quality: A comprehensive review. Food Research International 139: 109946.
- Bonfante A, Monaco E, Langella G, Mercogliano P, Bucchignani E, et al. (2018) A dynamic viticultural zoning to explore the resilience of terroir concept under climate change. Sci Total Environ 624: 294-308.
- Yerbolova LS, Ryabushkina NA, Oleichenko SN, Kampitova GA, Galiakparov NN (2013) The effect of growth regulators on in vitro culture of some Vitis vinifera L. cultivars. World Applied Sciences Journal 23(1): 76-80.
- Fertu DI, Batir-Marin D, Tudor M (2023) Ethephon residue analysis in commonly used vegetable foods by a HPLC-PDA method. Environmental Engineering & Management Journal (EEMJ) 22(8).
- Pettoello-Mantovani C, Olivieri B (2022) Food safety and public health within the frame of the EU legislation. Global Pediatrics 2: 100020.
- Masson-Delmotte V, Zhai P, Pirani A, Connors SL, Péan C, et al. (2021) Climate change 2021: The physical science basis. Contribution of working group I to the sixth assessment report of the intergovernmental panel on climate change 2(1): 2391.
- Nedealcov M (2014) The impact of climate change on the productivity of some agricultural crops. Science, Innovation, Culture and Art Magazine Academies 33(2): 62-65.
- Nedealcov M (2016) Recent estimates of regional climate change: Noosphere. Scientific Journal of Education Spirituality and Ecological Culture (17): 204-210.
- Parry ML, Rosenzweig C, Iglesias A, Livermore M, Fischer G (2004) Effects of climate change on global food production under SRES emissions and socio-economic scenarios. Global Environmental Change A 14(1): 53-67.
- Sgubin G, Swingedouw D, Mignot J, Gambetta GA, Bois B, et al. (2023) Non‐linear loss of suitable wine regions over Europe in response to increasing global warming. Global Change Biology 29(3): 808-826.
- Webb LB, Whetton PH, Barlow EWR (2007) Modelled impact of future climate change on the phenology of winegrapes in Australia. Australian Journal of Grape and Wine Research 13(3): 165-175.
- Papadakos P, Ioannis C, Theodore P, Giorgos F, Giorgos S, et al. (2023) Message-in-a-bottle: Engaging stories around sustainable and safe wine products. Discover Sustainability 4(1): 43.
- Enache V (2013) The influence of some technological links on the dynamics of soil moisture, in the conditions of prolonged drought of year 0 in Dealu Bujorului Vineyard-Romania. Horticulture, Viticulture and winemaking, Forestry and public gardens, Plant Protection 36: 249-251.
- Aryal JP, Sapkota TB, Khurana R, Khatri-Chhetri A, Rahut DB, et al. (2020) Climate change and agriculture in South Asia: Adaptation options in smallholder production systems. Environment, Development and Sustainability 22(6): 5045-5075.
- Zaldea G, Nechita A, Damian D, Ghiur AD, Cotea VV (2021) Climate changes in recent decades, the evolution of the drought phenomenon and the impact on vineyards in North-eastern Romania. Botanical Notes of the Agrobotanical Garden of Cluj-Napoca 49(4): 12448-12448.
© 2024 © Mihai Tudor. This is an open access article distributed under the terms of the Creative Commons Attribution License , which permits unrestricted use, distribution, and build upon your work non-commercially.
 a Creative Commons Attribution 4.0 International License. Based on a work at www.crimsonpublishers.com.
Best viewed in


.jpg)


 Editorial Board Registrations
 Submit your Article
 Refer a Friend
 Advertise With Us
.jpg)


.jpg)


.bmp)
.jpg)
.png)
.jpg)


.jpg)


.png)

.png)


.png)


