
- About Us
- Information
-

The Author ensures that the research has been conducted responsibly and ethically with adherence to all relevant regulations. read more..
- For Authors
- For Reviewer
- Manuscript Guidelines
- Membership
- Publication Ethics
-
- Journals
- Reprints
- e-Books
- Videos
- Policies
- Contact Us
 COVID-19
- Submissions


Full Text
Environmental Analysis & Ecology Studies
Smartphone Application Determines Nitrate Concentration in Strawberries Leaves
Federico Hahn Schlam* and Carlos Martínez Nicolas
IAUIA, Postgraduate Department, Universidad Autonoma Chapingo, México
*Corresponding author:Federico Hahn Schlam, IAUIA, Postgraduate Department, Universidad Autonoma Chapingo, México
Submission: November 25, 2023; Published: December 18, 2023

ISSN 2578-0336 Volume11 Issue4
Abstract
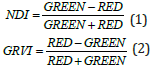
Nitrogen is necessary for the synthesis of chlorophyll that is involved in the process of photosynthesis. Vegetation indices measure spatial and temporal plant photosynthetic activity variations and are widely used due to their simplicity. Vegetation indices are dimensionless radiometric measurements, and combine different wavebands. Leaf analysis is an effective approach to monitor the nutritional status of strawberries and help to diagnose crop deficiencies. An application was developed for the smartphone, that acquire an image from a strawberry leaf and after processing it, displayed its nitrogen concentration. In this study, it was observed that with a decrease in the NO3 content, the R and G values increased, together with an increase in the R/G ratio, with values that reached 0.9 and 1.2 in the vegetative indices. The high degree of similarity between the R678 and R500 reflectance bands and the smartphone R and G color bands allow the application of these devices.
Keywords:Strawberry leaf image; Nitrate; LAQUAtwin; Smartphone application; Vegetation indexs
Introduction
Leaf Chlorophyll (Chl) content is considered a reliable indicator of plant health due to its central role in photosynthesis, as well as its close correlation with leaf nitrogen content [1]. Adequate amounts of N in the plant, produce dark green leaves, because they have a high concentration of the chlorophyll molecule. The green chlorophyll pigment absorbs the light energy required to start the photosynthesis process. High costs of non-destructive chlorophyll handheld meters SPAD-502 [2] limits their use. Hyperspectral imaging techniques are also costly and time-consuming [3]. As chlorophyll and nitrogen content meters are related to leaf coloration, digital leaf color analysis is becoming an important cheap non-destructive tool for real time Chl content monitoring [4]. Hand-held Chl meters can measure both leaf Chl and N content with special models [5]. Spectral reflectance reconstruction based on RGB images is inexpensive and fast [3]; Red and red-edge wavelengths are quite sensitive to leaf diseases [6]. Vegetation indices are dimensionless radiometric measurements and combine different spectral channel data to obtain information on vegetation properties. Vegetation indices are widely used due to their simplicity. Image color indices have been used as nitrate content indicators. The use of Red, Green, and Blue (RGB) colors has been reported for this purpose [4,7]. RGB studies present a negative CHL-content relationship with R and/or G color indices. Data plots present a logarithmic decline with these two colors when CHL content increases [8], which indicates a lower sensitivity of the R and G models under higher pigment content. Other color indices such as R-B, G-B, R+B, R+G, B+G, R+G+B, R/B and G/B, show a good correlation with chlorophyll content [9]. These indices measure spatial and temporal plant photosynthetic activity variations.
Spectrometers rely on an external computer to operate, collect and analyze data, increasing its operational cost [10]. Smartphones are simple computing devices that can be interfaced with spectrometers, although quality improvement is still required [11].
Smartphones have been applied to determine chlorophyll content in crop leaves. Contact imaging determine chlorophyll content of corn leaves, reducing the effect of environment light during the measurement [12]. A smartphone detected nitrogen stress in plants after calculating the ratio of blue reflectance against the combined reflectance of blue, green, and red wavelength [13]. Smartphone chlorophyll prediction of tender, immature and mature citrus leaves used artificial neural networks, ANN. The performance of the ANN model is evaluated by R2 (Coefficient of Determination) being always higher than 93% [14]. The present study describes a smartphone image analysis technique for the estimation of nitrate content in strawberry leaves. The system should work without the use of specialized equipment, complex mathematical analysis or image modification. A simple photography technique captured leaves images with a smartphone, ensuring minimum interference with ambient light conditions. A correlation was obtained between the R and G vegetation index and the leaves nitrates. An application for smartphones based on regression models was developed to estimate the content of nitrates in strawberries leaves.
Methodology
Nitrate-N leaf and petiole concentration studies were carried out at a strawberry plantation (variety Andrea), 120 Days after Transplanting (DDT) during the 2022 winter season. Contact leaf Images were taken with a Galaxy smartphone and a LAQUA twin pocket meter determined its nitrate content.
Vegetative material
Strawberries are planted on soil at Zamora, Mexico (19° 40՚ N, -102° 40՚ 30” W, 2 000m ASL) mounded within plasticulture raised beds. These beds with drip irrigation present good soil drainage to provide roots with sufficient oxygen for survival during heavy rainy periods. Each row is spaced 25cm apart, being each in-row plant spacing 20cm apart. High plant density with a transplant population of 82,000 per hectare, results in high yield. Low scale ejidal producers in Zamora cultivate between 1 and 5 hectares of strawberry with drip tape irrigation systems [15]. The grower bought transplants from local nurseries, planted them in December 2022 within a cover nursery field with screens and harvested them in July 2023. Nitrogen and other nutrients were applied by fertigation by the grower, and plants received a total of 130kg/ ha of N, 22 kg/ha of P, 180kg/ha of K, 7kg/ha of Ca, and 15kg/ha of Mg. These values are similar to the ones applied by Menzel in Queensland in Australia [16].
Nitrate-N extraction with LAQUA twin sensor
LAQUA twin pocket meters (HORIBA, Japan) provide accurate results for plant sap and tests nitrate-nitrogen (NO3-N), potassium (K+), calcium (Ca2+) and sodium (Na+). The pocket meter allows direct measurement of micro-volume sample (as low as 0.1ml) in a few seconds. Producers can take fertilization and irrigation decisions quickly. The NO3-11 Nitrate pocket meter has a measurement range from 1.4 to 5200ppm(mg/L), with a resolution of 10ppm for variable samples between 100 and 990ppm and with an accuracy of ±10% of the reading value. Tests with the sensor require of collecting the two most recent mature trifoliate leaves and their associated petioles from 20 strawberry plants to get a representative sample [17]. The leaves and petioles are cut in small pieces and the concentrated sap is obtained with a mechanical press, Figure 1. A drop of 0.05mL is placed on the sensor obtaining a reading in parts per million (ppm) or mg/L. Quick NO3 nutrient analysis after sixty and ninety days should be 550 and 400ppm, respectively [17]. Another researchers collected ten young, fully expanded leaves from the plants every 3 weeks for analysis of total N and Nitrate-N (NO3-N) [16,18]. The sensor must be calibrated beforehand and therefore it must be clean. At the beginning of the calibration, the sensor is rinsed with water, and then a little standard solution is placed and the calibration button is pressed. A signal (smiley face) will appear indicating that the calibration process is complete. During the analysis, a sample that fills the sensor window is used and a few seconds the measurement result is shown when the smiley face appears.
Figure 1:Extraction of the nitrate sap using a mechanical press.

Calculation of vegetative indices
Vegetation indices used the RED, GREEN and BLUE color bands with respect to the greenness of the strawberry, and were obtained with the OpenCV library. Subsequently, the value of each pixel was obtained and a one-dimensional array was formed by applying equations (1) and (2) to calculate the NDI and GRVI index.
These indices use the principle of reflectance emitted by plants, specifically chlorophyll b which is in the range of 400nm to 600nm. Chlorophyll b absorbs the light from 450nm to 650nm (orange-red light from the spectrum) and these bands can be captured with the smartphone camera.
Smartphone APP development
An application for Android phones was developed. This APP acquires the leaf image, obtains its RGB image, to finally estimate the greenness index. This is correlated with nitrates through linear prediction models. The greenness index assigns a value that varies between 0.3 and 1.5 depending on the leaf status. A value close to 0.3 corresponds to a deteriorated or low nitrate leaf and close to 1.5 for leaves in good condition. The application was developed using the Dart language and the Visual Studio Code SDK. The calculations and analysis of the images during the application were done in Python. A network was created with the APP since it captures the image. Afterwards, the image is processed with an OpenCV library with Python language and “Ngrok” API, Figure 2. The APP returns the image together with the calculated nitrate.
Figure 2:Smartphone detection of leaf nitrates..

Nitrate Measurements
Petiole Nitrate-N concentration is much more variable and less reliable than total leaf nitrogen. Maintain Nitrate-N levels should be maintained above 1000ppm during preharvest and above 400ppm during harvest to ensure high productivity. This recommendation is consistent with grower data, where petiole Nitrate-N concentrations below 500ppm indicate N deficiency. Nitrate-N concentrations above 10,000ppm produce excessive leaf growth and poor yield.
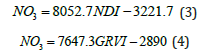
Nitrate content showed a strong positive Coefficient of Determination (r2=0.96) with NDI (equation 3) and of 0.93 with GRVI (equation 4). This corroborates the relationship between nitrates and their respective Greenness indices. The RED and GREEN bands accurately represent the abundance of chlorophyll pigments and nitrogen in leaves, Figure 3. The indices can reliably distinguish stressed from healthy plants, Figure 4. Stressed plants show a lower NDI index, and a yellowish color (Figure 4b), than healthy plants having a NVI over 1.05 and nitrate content of 4967.83ppm (Figure 4a). Healthy tissues presented NVI values over 0.85 which represent nitrate values over 2500ppm. Although the LAQUA twin pocket meter was useful to acknowledge the leaf nitrate its results were always a multiple of 50ppm.
Figure 3:Nitrates measured with the pocket meter and related to (a) NDI and (b) GRVI.

Figure 4:Smartphone image of the leaf from a (a) healthy plant and (b) a stressed plant together with its NVI and NO3 values.

Discussion
Leaf analysis is an effective approach to monitor the nutritional status of crop cultures and help to diagnose potential deficiencies [18]. NPK nutrients influence strawberry production, and its deficiencies decrease pigment formation causing subsequent leaf color changes from green to yellowish or purple [19]. As well they avoid fertilizer leaching causing soil contamination. Across all fields, leaf N concentrations declined from stage early flowering to main harvest and stabilized afterwards [20]. Petiole NO3-N declined throughout the season. The nitrate content was significantly lower in the leaf petiole sap than in the fruit peduncle sap [21] and significant differences were reported in the nitrate content between the late and early production seasons. The yellowing leaves experience a decrease in nitrate concentration. In contrast, healthy leaves have a lower total reflectance, reflecting green photons more than red ones, while senescent leaves have a high total reflectance, reflecting photons almost equally in the red and green wavebands. Leaves with high chlorophyll content have higher R500 values than R678. Although senescence causes the values of R500 and R678 to increase simultaneously, the value of R678 increases at a faster rate than that of R500, causing the two values to become almost equal on yellow (senescent) leaves. Strawberry leaves are green in color, but can present non-green parts sections of different colors [22]. In some systems each leaf is placed in a light chamber where lamps are adjusted to obtain even illumination without shadows [20]. However, the system is unpractical and slow, so this smartphone application is quicker and avoids lightning variations. Each normal and colored leaf image, had its red, green, and blue image processed by using an image segmentation algorithm developed by a python program [22]. The time consumed by this algorithm and the one presented in this paper is similar.
Conclusion
Leaf color information present in the R and G values within the RGB color space can provide the nitrate content of the strawberry plant. The smartphone APP developed as part of this study simplifies the process by directly providing the RGB value, as well as calculating the NO3 content. Since the present study was carried out using only one strawberry species (Andrea), future research should explore the application of this technique using other plant species and digital cameras to assess its practical feasibility, as well the possibility of detecting other nutrients. The two vegetation indices presented correlations greater than 93% and by taking contact photographs avoided lightning variation errors. The pocket sensor worked well but leaf and petiole N varies drastically.
Acknowledgement
We want to thank DGIP for the funding of this research.
References
- Wang JJ, Li Z, Jin X, Liang G, Struik PC, et al. (2019) Phenotyping of flag leaf nitrogen content in rice using a three-band spectral index. Comput Electron Agric 162: 475-481.
- Lin FF, Qiu LF, Deng JS, Shi YY, Chen LS, et al. (2010) Investigation of SPAD meter based indices for estimating rice nitrogen status. Computers and Electronics in Agriculture 71(1): 60-65.
- Gong L, Zhu C, Luo Y, Fu X (2023) Spectral reflectance reconstruction from Red-Green-Blue (RGB) images for chlorophyll content detection. Applied Spectroscopy 77(2): 200-209.
- Agarwal A, Dutta Gupta S (2018) Assessment of spinach seedling health status and chlorophyll content by multivariate data analysis and multiple linear regression of leaf image features. Computers and Electronics in Agriculture 152: 281-289.
- Walker HV, Jones JE, Swarts ND, Rodemann T, Kerslake F, et al.(2021) Predicting grapevine canopy nitrogen status using proximal sensors and near-infrared reflectance spectroscopy. Journal of Plant Nutrition and Soil Science 184(2):294-304.
- Mirandilla JRF, Yamashita M, Yoshimura M, Paringit EC (2023) Leaf spectral analysis for detection and differentiation of three major rice diseases in the Philippines. Remote Sens 15: 3058.
- Hassanijalilian O, Igathinathane C, Doetkott C, Bajwa S, Nowatzki J, et al. (2020) Chlorophyll estimation in soybean leaves infield with smartphone digital imaging and machine learning. Comput Electron Agric 174: 105433.
- Rigon JPG, Capuani S, Fernandes DM, Guimarães TM (2016) A novel method for the estimation of soybean chlorophyll content using a smartphone and image analysis. Photosynthetica 54(4): 559-566.
- Baresel JP, Rischbeck P, Hu Y, Kipp S, Barmeier G, et al. (2017) Use of a digital camera as an alternative method for non-destructive detection of leaf chlorophyll content and nitrogen nutrition status in wheat. Comput Electron Agric 140: 25-33.
- Das AJ, Wahi A, Kothari I, Raskar R (2016) Ultra-portable, wireless smartphone spectrometer for rapid, non-destructive testing of fruit ripeness. Scientific Reports 6: 32504.
- Gallegos D, Kenneth DL, Hojeong Yu, Clark PP, Lin Y (2013) Label-free biodetection using a smartphone. Lab on a Chip 13: 2124-2132.
- Vesali F, Omid M, Kaleita A, Mobli H (2015) Development of an android app to estimate chlorophyll content of corn leaves based on contact imaging. Computers and Electronics in Agriculture 116: 211-220.
- Adhikari R, Nemali K (2020) A novel method for estimating nitrogen stress in plants using smartphones. Horticulturae 6: 74.
- Barman U, Choudhury RD (2020) Smartphone image based digital chlorophyll meter to estimate the value of citrus leaves chlorophyll using Linear Regression, LMBP-ANN and SCGBP-ANN. Computer and Information Sciences 34(6 Part A): 2938-2950.
- Estrada-Chavira ME, Portillo-Vázquez M, Calderón-Zavala G, Segarra E, Martínez-Damián MA, et al. (2017) Potential for strengthening strawberry exports from Michoacán to the United States. Revista Chapingo. Serie Horticultura 23(3): 135-146.
- Menzel CM (2018) Changes in the concentration of leaf nitrogen over the season affect the diagnosis of deficiency or sufficiency in strawberries in the subtropics. Agriculture 8: 126.
- (2017) Quick nutrient analysis in strawberry production. Application Note. HORIBA, Kyoto, Japan.
- Osvalde A, Karlsons A, Cekstere G, Āboliņa L (2023) Leaf nutrient status of commercially grown strawberries in Latvia, 2014–2022: A possible yield-limiting factor. Plants 12: 945.
- Madhavi BGK, Basak JK, Paudel B, Kim NE, Choi GM, et al. (2022) Prediction of strawberry leaf color using RGB mean values based on soil physicochemical parameters using machine learning models. Agronomy 12(5): 981.
- Bottoms TG, Bolda MP, Gaskell ML, Hartz TK (2013) Determination of strawberry nutrient optimum ranges through diagnosis and recommendation integrated system analysis. Hort Technology 23(3): 312-318.
- Dominguez A, Martinez F, Allendes G, Palencia P (2020) Evaluation of the nutritional status of strawberry during the production season. Environmental Engineering & Management Journal (EEMJ) 19(4): 599-607.
- Shimoji H, Tokuda G, Tanaka Y, Moshiri B, Yamasaki HA (2006) Simple method for two-dimensional color analyses of plant leaves. Russ J Plant Physiol 53: 126-133.
© 2023 © Federico Hahn Schlam. This is an open access article distributed under the terms of the Creative Commons Attribution License , which permits unrestricted use, distribution, and build upon your work non-commercially.
Editor In Chief


.jpg)


Signup for Newsletter

Quick Links
 Editorial Board Registrations
 Submit your Article
 Refer a Friend
 Advertise With Us
Our Recent Edition

.jpg)


Top Editors


.jpg)


.bmp)
.jpg)
.png)
.jpg)


.jpg)


.png)

.png)


.png)


Financial Support

Sponsors

Latest e-Books

Latest Video

 a Creative Commons Attribution 4.0 International License. Based on a work at www.crimsonpublishers.com.
Best viewed in
a Creative Commons Attribution 4.0 International License. Based on a work at www.crimsonpublishers.com.
Best viewed in