- Submissions

Full Text
Environmental Analysis & Ecology Studies
Surface Water Quality Evaluation and Health Implications at In-Stream Sand Mining Sub-Catchment of Abak Local Government Area, Akwa Ibom State, Nigeria
Abraham Comfort1, Oloko Godwin1, Udoh Martins1, William Nyetiobong2*, Umoh Enobong2 and Udoh Winnie3
1Department of Geography and Natutral Resources Management, University of Uyo, Nigeria
2International Centre for Energy and Environmental Sustainability Research, University of Uyo, Nigeria
3Department of Plant Science, University of Benin, Nigeria
*Corresponding author:William Nyetiobong, International Centre for Energy and Environmental Sustainability Research, University of Uyo, Nigeria
Submission: July 28, 2023; Published: October 18, 2023

ISSN 2578-0336 Volume11 Issue4
Abstract
Over the years, incessant sand mining processes demean the quality of surface water in areas of in-stream mining particularly places where mining is pervasive and irrepressible. Consequently, render the populace vulnerable to gratuitous health risk. In Abak Local Government, Nigeria this study seeks to assess surface water quality of streams where sand mining activities take place and implications on health of catchment communities. Seven active mining streams were delineated within the sub-catchment of Cross river basin using stratified random sampling for the study. Surface water samples were collected in all the sites and subjected to standard laboratory methods for physicochemical and nutrient analyses for variables including: pH, temperature, conductivity, dissolved oxygen, total dissolved solid, total suspended solid, acidity, alkalinity, chloride, biochemical oxygen demand, chemical oxygen demand, total hardness, turbidity, calcium, Iron, Zinc, Nickel, Lead, Phosphate, Nitrate and Sulphate. This study found that acidity, Zn, Fe, DO, and turbidity at higher concentration indicate the presence of toxicants in the surface water samples. The results also revealed that values of some water variables deviated from World Health Organization and Minimum Permissible Limit (WHO*MPL). This implies that the least deviations from WHO*MPL mean that the water is risky to health when consumed. Thus, out of 70 responses from the two health centres around the study area, diseases like malaria (24%), typhoid (28%), diarrhea (13%), dysentery (7%), cholera (11%), and guinea worm (16%) were prevalent among the residents and these are diseases that are closely related to poor water quality. Therefore, there is need to regulate mining operations, establish monitoring plans that cover profile changes and sediment transport capacity in order to enable authorities in evaluating long-term and short-term effects of in-stream mining and reclaiming the terrain to protect the surface water from further contaminations.
Keywords:Surface water; In-stream; Mining; Sub-catchment
Introduction
The effects of sand mining in coastal areas and stream catchments are significantly considered in the impacts on aquatic biodiversity, water turbidity, water table levels and chemical constituents of water. In some extreme cases, the mining of marine aggregates has changed international boundaries, such as through the disappearance of sand islands in Indonesia [1,2]. Negative environmental impacts seem to outweigh positive effects in mining especially pollution. Kondolf [3] stated that in-stream mining is the mechanical removal of gravel and sand directly from an active channel through pit exaction and bar Skimming and this have consequences on water quality. Pereira [4] revealed that suspended solids affect domestic water users in downstream, which increase treatment costs in Indian rivers. Lawal (2011) supported Stebbins on that there are changes in channel morphology because of stream mining in Nigeria. Gravel pits are in some places used as dumping sites with tipper trucks carrying waste to dump as they come to collect sand and gravel. Thus, the flow of water carries the pollutants into streams and this contaminates drinking water and affects people’s health in Maine State [5]. Mwangi [6] noted the same impact of converting of abandoned gravel pits into dumping sites as a serious effect of uncontrolled gravel mining in Kenya. Wokorach [7] stated that in Botswana mining processes pollute water near mining areas and contaminate soils. Sand conditioning and processing activities such as material cleaning can also aggravate the TSS problem in overlying waters.
Sand was until recently extracted in land quarries and riverbeds; however, a shift to marine and coastal aggregate mining has occurred due to the decline of inland resources. River and marine aggregates remain the main sources for building and land reclamation. Saviour [8] discussed pollution of water as a result of some physicochemical and biological parameters which characterize degradation of water quality when it turns from brownish to reddish orange, lowering pH and increasing electrical conductivity. This is due to high concentration of ions of sulphate, iron and other heavy toxic metals such as zinc, nickel, copper and low dissolve oxygen. When mined materials for example walls of open pits and waste rocks are exposed to oxygen and water, acid can be formed leading to an acid mine then acid mine drainage which run off into streams and rivers [8]. This release of acid into the streams is causing water pollution.
There is environmental degradation on open land rivers as well as high evaporation from exposed river beds leading to dry rivers and shortage of water for domestic purpose and mining operations involve deforestation and biodiversity erosion. The activity on the long run adversely affects the physical characteristics of the river environment. The accuracy with which one can assess physical impacts is dependent on the understanding of how the natural environment functions. Given perfect understanding it should be made to predict exactly the direction, degree and rate of change of the physical environment as it responds to a given stimulus. Depending on the type and amount of mining, the physical effects may vary from place to place in a river and from one river to the other. The manual mining practiced for the extraction of sand and gravel could induce negative changes on land stability, soil, landform, aesthetics and river bed characteristics. Manual mining imposes medium negative impacts on land stability, soil and landforms in midlands and lowlands. But in highlands, manual mining causes only a low negative impact on land stability and soil. On the contrary, in the midlands and lowlands, the stability of the river banks is seriously affected by intense sand mining as the banks are composed of incompact soil. Invariably, the fluvial landforms (alluvial/sand bars) within the river channel are removed from midland areas in the name of sand and gravel mining. Sand bars are common in the midlands and hence, the impact is much higher in this zone.
Physicochemical parameters and concentration of the heavy metals Pb2+, Zn2+, Ni2+, As3+, Cu2+, Fe2+ , Mn2+, and Sn2+ were analysed in areas of mining and it was found that most parameters and metal concentration exceeds the permissible limit and concluded that the catchment has a high pollution potential due to important sand mining activities [9]. The concentration of pollutants from sand mining operations with suspended and dissolved materials cause surface runoff of these pollutants and impacts on water quality. The commonest surface water contaminant is sediment of suspended solids. Apart from runoff from over burden unemployment and stockpiles, storm water can be contaminated from process plants, workshops and vehicles wash-down pads during dredging. Drainage from oxidization of sulphuric pollutants is highly acidic and possesses elements that are toxic to aquatic life with impact on the surrounding hydrologic environment. Lawal (2011) stated that sand mining in Nigeria is an activity that is rapidly becoming an ecological problem as demand for gravel and sand increases. If speedy interventions take place, this will create more water resource problem beyond control. Therefore, this work examined the water characteristics in highly degraded streams under dredging.
The secondary effects of sand mining, river bank slumping, channel incision, etc., cause obvious physical disturbances on the land stability especially in areas close to the river banks. The pollution of mining streams in Abak and other parts of Nigeria cannot be overemphasized. However, there is dearth of literatures and research in the subject within Nigeria. Therefore, this study becomes vital because humans are affected by pollution effect.
The study seeks to examine:
a) The physicochemical and nutrient analysis of surface water in
streams where sand mining activities take place.
b) Compare the results with WHO*MPL standards.
c) The implications on health of catchment communities (in
terms of prevalent disease cases)
Study area
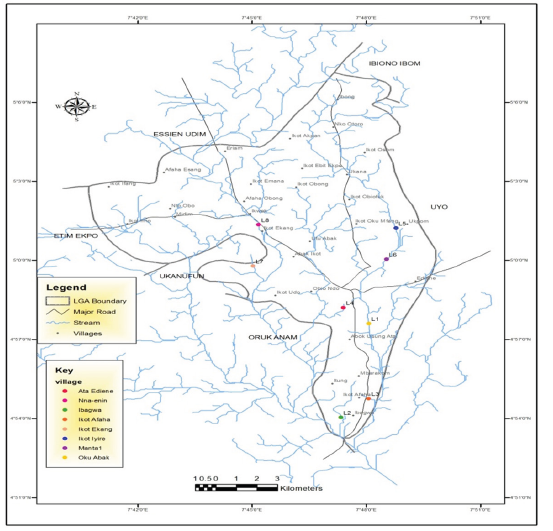
Abak belongs to the tropical rain forest zone. It is made up of green foliage of trees and shrubs and large expanse of farmlands, there are also scatters of both introduced and wild palm trees. Other trees common in the area are coconut palm (cocos nucifera), raffia palm (raffia fariniferia) and others. The relief is less than 60 meters above sea level and this means that the landscape is relatively undulating. The surface topography is not rough and has a peneplanned terrain. Gravel beds pebbly sands are commonly exposed on hillsides, road-cuts and stream channels in the area and the sands in are mature, coarse and moderately sorted. The sands here are sometimes cross-bedded with clays and sand clay occurring in the Benin younger. Benin Younger plain is partly fluviolacustrine in origin. The landscape is undulating thereby rising gradually and lies between 0 and 200 meters above sea level. The study area has long wet season and short dry season. While the wet season starts by March and lasts till November, the dry season begins from November and lasts till March. The average monthly temperature is less than 26.7 °C while the mean annual rainfall is about 31mm. The humidity of the area is high throughout the tear and ranges from 70% to 80% (Figure 1).
Figure 1:Delineated Sand mining streams in Subcatchments of CRB, Abak, Akwa Ibom State, Nigeria.
Materials and Methods
Sampling procedures
Seven active sand mining streams were sampled in Abak and surface water samples collected. The samples were taken to the laboratory for analysis of physicochemical and mineral characteristics. The variables considered in the study include: pH, temperature, conductivity, dissolved oxygen, total dissolved solid, total suspended solid, acidity, alkalinity, chloride, biochemical oxygen demand, chemical oxygen demand, total hardness, turbidity, calcium, iron, zinc, nickel, lead, phosphate, nitrate and sulphate as adopted from Kazi et al (2009). A total of 70 respondents were selected using purposive sampling from the cases of health in the two health centres around the area, to know the most prevalent cases that visit health centres. This aided in gathering reports on health implications of poor water quality.
Methods of data collection
Bottles used in collection of water samples were sterilized in an autoclave at a temperature of 1200 °C for three hours before duplicated samples of 100ml and 2 liters of each of the surface water were subjected to physicochemical and mineral/nutrient analysis of water, both were labeled separately to avoid mix up before analysis. Collected samples were subjected to laboratory methods. Temperature was determined by dipping a mercury-inglass portable thermometer into the water samples at the point of collection, to obtain the reading; turbidity by the nephelometric method (using HACH 2100 a tubid meter) [10]; total dissolved solids by Gravimetric method (Kazi et al 2009); total suspended solids by running a given amount of the water sample through a filter. The filter and residue were dried in oven. TSS calculated by subtracting weight of filter from that of filter and residue and divided by the volume of water (Kazi et al, 2009); electrical conductivity was determined using the Jenway conductivity meter (4510 model), by dipping the probe into the container of the water samples until a stable reading was obtained and recorded; PH level was determined by the use of HANNA pH meter (model HI 28129). Total hardness by using standard solution of sulphuric acid with solochrome black T as indicator (Ekwebelem 2010). Dissolved oxygen was determined using the winkler azide method (Pejman et al, 2009); Biological Oxygen Demand (BOD) was determined using the relationship BOD=DO1-DO2 (Agbaire and Obi 2009), same as in DO above (Winkler azide method) but was titrated after five days. Calcium was determined using EDTA titration; chloride was determined with argent metric titration. Nitrate was determined using Dionex-80 ion analyzer; sulphate, bicarbonate and alkalinity with strong acid titration method; copper, cobalt, chromium , iron and manganese were determined using atomic Absorption Spectrometer (AAS); iron content by the AAS, the concentration was read using UV spectrometer (Model: 01-960-00) at 510nm. Nitrate was analyzed by calcium reduction and ascorbic acid method (using HACH DR 2800 spectrometer); and sulphate by turbid metric method using barium chloride and concentration reading through UV spectrometer (Model UV-1601) [11].
Statistical techniques
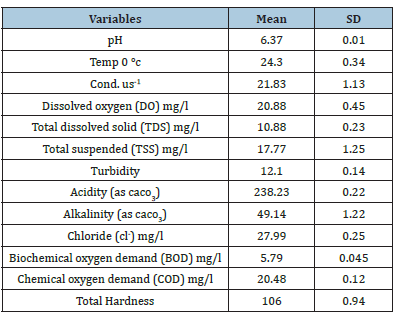
Standard deviation was used to examine and compare the results of the samples from mined streams and the WHO*MPL (Table 1).
Table 1:Mean Physicochemical properties of water samples.
Results and Discussion
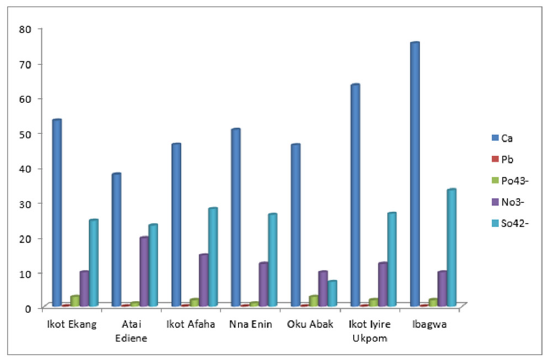
From the result of the analysis according to Figure 2, highest values were accounted by acidity and total hardness where Oku Abak had the highest peak for acidity while Atai Ediene had the highest for Total hardness. From Figure 3, Ca with the highest peak at Ibagwa indicates higher calcium concentration in Ibagwa followed by Sulphate in the same sampled site. Other sites also had higher calcium concentration compared to other variables in this series.
Figure 2:Physicochemical Characteristics of water in the respective streams.
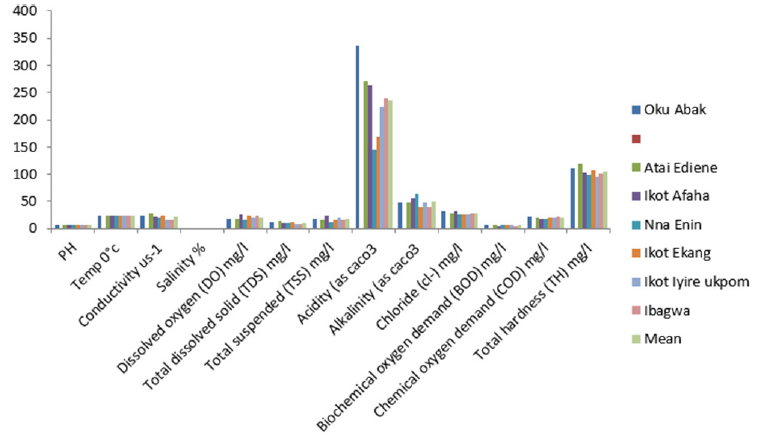
Figure 3:Calcium, Phosphate, Nitrate, Sulphate Content.
Health implications of the surface water quality
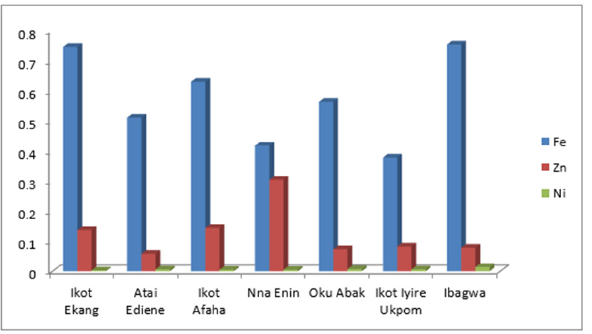
In the comparison between the results and World Health Organization and their Minimum maximal? permissible limit, the study revealed that pH, DO, Cl, Total Hardness, Ca, Fe, Zn, Turbidity exceeded the WHO*MPL of drinking water quality at 5, 4mg/l, 20mg/l, 100mg/l, 30mg/l, 0.2mg/l, 1mg/l and 0.3mg/l respectively. High DO poses danger to life supporting systems; high iron content is also disastrous to man. High zinc content is not acceptable for consumption, the acidity levels were very high, therefore the water quality of samples according to WHO*MPL standards was not acceptable only in alkalinity (Table 2). Drinkable and usable water do not need high level of acidity, iron and dissolved oxygen. The reason for the high level of iron and zinc content exceeding threshold is that sand mining in the affected streams involves the use of toxicants from dredgers, sediment transport and which have great impacts on water quality. In addition, turbidity was very high (Figure 4). The high turbidity is because of discharge of effluents during the sand mining process into the streams. High turbidity is not good for human consumption [12-16].
Table 2:Mineral and nutrient constituents.

Figure 4:Iron, zinc, nickel and lead content.
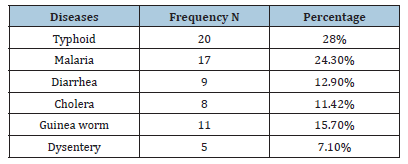
Typhoid has accounted for (28%) by 20 respondents, malaria 17(24.3%), diarrhea 9(12.9%), cholera 8(11.42), guinea worm (15.7%) and dysentery 5(7.1%) (Table 3). Thus, diseases like malaria, typhoid, diarrhea, dysentery, cholera, and guinea worm were prevalent among the residents and these are diseases that are closely related to poor drinking water. To compare with normal/ maximal values.
Table 3:Prevalent disease cases.
Conclusion
The results of the water quality analysis revealed that the characteristics of water in the streams varied from place to place depending on the rate of mining and pollutions by the dredging processes. The analysis clearly showed high level of acidity and some toxicants like iron and zinc. The presence of these toxicants exceeded the threshold and was not of advantage to community residents that use the water. This is supported by the work of Ashraf et al. [9] that physiochemical parameters and concentration of heavy metals in areas of sand mining exceeding permissible limit led to high pollution problems. The high level of turbidity is in line with Ashraf et al. [9] that instream sand mining effects on rivers water quality including increasing turbidity at the sand mining stream is caused by resuspension of sediment, sedimentation due to stockpiling, dumping of excess mining materials and organic particulate matter and oil spills during leakage from excavation machinery and transportation vehicles.
Recommendation
Having known the devastating effect of sand mining on stream
ecology especially water quality and associated derivations, there
is need to employ the following strategies in curbing the menace
vis-à-vis reclaiming and sustaining the environment.
A. Environmental management and monitoring plans are to be
structured to provide facts on contour changes and sediment
transport capacity, which would enable the authorities to
evaluate the long-term and short-term effects of the in-stream
mining activities.
B. The Ministry of Environment should also ensure that
regulations against indiscriminate sand mining are made.
They should continually intensify operations to reduce illegal
mining and enforce the requirements of the act. Companies
that are dredging should be bound by certain legislation that
is related to pollution in environment and defaulters should be
dismissed to control and prevent from further contaminations.
C. There is need for environmental remediation especially
reclaiming the ecology of the stream.
There should be urgent protection of polluted stream catchments from consistent degradation.
References
- New York Times (2010) Indonesia’s islands are buried treasure for gravel pirates. The New York Times, New York, USA.
- Guerin B (2003) The shifting sands of time and Singapore. Asia Times online.
- Kondolf MG (2007) Geomorphic and environmental effects of in-stream gravel mining. Landscape and Urban Planning 28(2-3): 225-243.
- Pereira K (2012) Illegal sand mining: The unexamined threat to water security in India. EIACP (PC-RP) on Environmental Problems of Mining.
- Stebbins M (2006) Can gravel mining and water supply wells coexist, University of Maine, Maine, USA.
- Mwangi S (2007) Management of river systems in East Africa. National Policy on National Resources Conservation and Development, Government Paper Number 1 of 1990, Government Printers, Gaborone, Botswana, Africa.
- Wokorach JB (2002) Human and Economic Geography for BGCSE. Salama Publishers, Mochudi, Botswana, Africa.
- Saviour NM (2012) Environmental impacts of soil and sand mining: A review. International Journal of Science Environment and Technology 1(3): 125-134.
- Ashraf MA, Maah MJ, Yusoff IB (2010) Study of water quality and heavy metals in soil & water of ex-mining area Bestari Jaya, Peninsular Malaysia. International Journal of Basic & Applied Sciences 10(3): 7-23.
- APHA (2005) American public health association, Standard methods for the Examination of Water and Wastewater. In: Greenberg AE, Clescert LS, Eaton AD (Eds.), 18th Edition.
- Ademoroti CMA (1996) Standard methods for water and effluents analysis, Foludex Press Ltd, Ibadan, Nigeria, pp. 1-49.
- Byrnes MR, Hiland MW (2011) Large-scale sediment transport patterns on the continental shelf and influence on shoreline response: St. Andrew Sound, Georgia to Nassau Sound, Florida, USA. Marine Geol 126: 19-43.
- Ekosse G (2004) A Handbook of Environmental impacts of mining on soils around the abandoned Kgwakgwe Manganese Mine in Botswana, Macmillan, Gaborone, Botswana, Africa.
- Ghose MK and Anjay Kumar (2010) Mineral industries and their environmental aspects in Indian context. Indian Journal of Engineering & Materials Sciences 11: 433-437.
- Goddard J (2007) Land degradation and rehabilitation, University of South Wales Press, Sydney, Australia.
- Gwimbi P, Dirwai C (2003) Research methods in geography and environmental studies. Zimbabwe Open University, Harare, Zimbabwe.
© 2023 © William Nyetiobong. This is an open access article distributed under the terms of the Creative Commons Attribution License , which permits unrestricted use, distribution, and build upon your work non-commercially.
 a Creative Commons Attribution 4.0 International License. Based on a work at www.crimsonpublishers.com.
Best viewed in


.jpg)


 Editorial Board Registrations
 Submit your Article
 Refer a Friend
 Advertise With Us
.jpg)


.jpg)


.bmp)
.jpg)
.png)
.jpg)


.jpg)


.png)

.png)


.png)


