
- About Us
- Information
-

The Author ensures that the research has been conducted responsibly and ethically with adherence to all relevant regulations. read more..
- For Authors
- For Reviewer
- Manuscript Guidelines
- Membership
- Publication Ethics
-
- Journals
- Reprints
- e-Books
- Videos
- Policies
- Contact Us
 COVID-19
- Submissions


Full Text
Environmental Analysis & Ecology Studies
Evaluating Dynamics of Ecosystem Service Value in Response to Land use/Land cover Changes in the Southern highland of Ethiopia
Eshetu Yirsaw1,2* and Wondifraw Nigussie1,3
1College of Agriculture and Natural Resource, Dilla University, Ethiopia
2Department of Natural Resources Management, Dilla University, Ethiopia
3Department of Land Administration and Surveying, Dilla University, Ethiopia
*Corresponding author:Eshetu Yirsaw, Department of Natural Resources Management, College of Agriculture and Natural Resource, Dilla University, Ethiopia
Submission: August 09, 2023; Published: September 20, 2023

ISSN 2578-0336 Volume11 Issue3
Abstract
This study assessed changes in the Ecosystem Services Value (ESV) due to changes in Land Use/Land Cover (LULC) during the period 1988-2019 in the Gedeo highlands of Ethiopia. Moderate-resolution Landsat images for 1988, 2003, and 2019 were obtained and analyzed using a pixel-based supervised image classification with a maximum likelihood algorithm for mapping and assessing the LULC changes. The ESVs were estimated based on the benefit transfer approach using adopted global value coefficients and modified local value coefficients. The results revealed that agroforestry, wetland, and forestland that have vital ecological values decreased, while other LULC with less ecological values, such as built-up area, cropland, and grassland, increased throughout the study period. Besides, the results showed that the aggregated ESVs of the agroforestry, wetland, and forestland had decreased, which consequently led to a total loss of US$ 45.46 million (57.96%) in ESVs over the past 30 years when calculated with the modified local value coefficients and US$ 7.78 million (34.94%) when calculated with the global value coefficients. To protect the ecological function of the studied landscape, protection of the valuable LULC classes from further degradation that involves proper conservation measures is urgently required. This study provided minimum estimates of the ESVs, which will contribute to the formulation of strategies for sustainable management of the Gdeo highland and inform various stakeholders on the tradeoffs involved in the use of land resources.
Keywords:Land use/land cover; Ecosystem service; Benefit transfer; Gdeo; Ethiopia
Introduction
Ecosystems provide a wide range of direct and indirect services to human wellbeing, including food, fiber, raw materials for industries, and water supply [1-4]. In spite of the incredible contribution of ESs to the functioning of nature and sustainable human well-being and survival [2,3,5,6] globally the values of ESs have been significantly degraded over time and space [2,4,7]. LULC changes are the main drivers that significantly altered ESs [6,8,9] and they are becoming one of the fundamental concerns in global environmental change and sustainable development. Rapid worldwide population growth accompanied by economic activities causing urban agglomeration, and subsequent construction and agricultural land expansions has led to rapid LULC changes [10-12]. In connection to construction and agricultural land expansions, the less attention given to other LULC categories, particularly in developing countries, have resulted in various ecological consequences in various areas for which Ethiopia is not exceptional [6,13,14]. For instance, it has been observed that the conversion of LULC into agricultural land and urban areas is disparaging to entertaining scenes, genetic resources and nutrient cycling, erosion control and climate regulation, and water availability and soil fertility [15-19]. These impacts resulted in remarkable changes on the potential provision of various ES that make the quantification of ESVs essential to raise awareness [20] and develop decision making for the distribution of scarce resources among conflicting demands [8].
Following the pioneering works of Costanza et al. [1] that proposed 17 types of ESs coefficients for 16 biomes and the estimate of ESV at a global scale, there have been numerous studies that value ESs at different levels [15,21-24], based on these proposed value coefficients [25]. In addition, for the corresponding value coefficients of different biomes, the Economics of Ecosystems and Biodiversity (TEEB) valuation database was also developed, mainly based on the literature of case studies in different parts of the globe (de Groot et al. 2010). Most studies employed these proposed value coefficients through a benefit transfer approach together with remote sensing and GIS technology estimation to estimate the ESV and map their distributions [22,26]. This approach has been practical to estimate ESVs and suggests management options for regions with scarce data [8,25]. Though there have been efforts to estimate ESVs for areas with scarce data, there are few studies on the ESs valuation in Ethiopia, particularly in relation to LULC change dynamics.
In Ethiopia, LULC change is a common and ever-present phenomenon because agricultural activities mainly dominate rural landscapes, which have been causing considerable losses in ecological values [9]. However, research carried out on LULC changes in the country mainly focuses on the change dynamics of LULC changes [27,28], with less attention paid to the consequences of these changes on a wide range of ecological values. Currently, there are few efforts made to evaluate ES dynamics in response to LULC changes [8,9,29]. Those research findings have revealed that the effects of LULC change on ESs vary from place to place depending on location-specific factors. Similarly, despite investigating considerable changes in LULC around the study area, where intensive agricultural land use systems have been causing substantial environmental losses [30], there has been less attempt to investigate the impact of these changes on ecological values of the environment [29,30]. Therefore, it is important to evaluate dynamics in ESVs in response to LULC changes as they raise awareness of the consequences and improve decision-making regarding the management of an ecosystem. Hence, this study was designed to quantify changes in ESVs in response to LULC change based on the adopted global and modified local value coefficients in the Gedeo highland areas of Ethiopia over the past three decades (1988-2019) and to explore the effects of changes in each LULC type on ecosystem service values.
Materials and Methods
Study area description
The study area is located in Ethiopia’s Southern Nations, Nationalities, and People Region (Figure 1), which is 390 kilometers from the country’s capital city and 27 kilometers from Dilla town (38˚11ʹ32ʺ to 38˚26ʹ18ʺ E and 5˚58ʹ30ʺ to 6˚22ʹ7ʺ N). The study area is 448.95km2, with elevations ranging from 1,800 to 3000m a.s.l. The average annual rainfall is between 1,200 and 1,800mm, and the average temperature is between 15 0c and 22 0c. It has highland climatic conditions [31]. The livelihood of the study area is largely dependent on cereal crop production and agroforestry practices, according to BDANRO [32]. However, as an indication of the scenario, a large area of land that used to be covered by agroforestry practices, which had socioeconomic and environmental significance, is now degraded among various LULC classes [32]. Furthermore, the local community’s livelihoods have been harmed as a result of decreased agroforestry production and land degradation as a result of LULC changes in recent decades [33].
Figure 1:Map of the study area.

LULC data sources and methods
In this analysis, LULC time series datasets were generated using multispectral Landsat imagery from the Thematic Mapper (TM), Enhanced Thematic Mapper Plus (ETM+), and Operational Land Imager (OLI) from three acquisition years (1988, 2003, and 2019) with nearly no cloud cover acquired from path 168 and row 056 for the months of January and February (Table 1). In the study region, these months correspond to the dry season. The acquisition years were chosen to coincide with a national drought and famine in the 1980s, as well as a change of regime and subsequent policy changes in the country’s rural land and agriculture in the 1990s. All scenes used in this study were obtained from the website of the US Geological Survey (USGS) Center for Earth Resource Observation and Science (http://glovis.usgs.gov). In order to minimize sceneto- scene variability and place the data on the same radiometric scale to represent true changes on the field, the absolute correction approach was implemented in all images using the image-based Dark-Object Subtraction (DOS) model as defined by Chander et al. [34] and Paolini et al. [35]. After the images had been pre-processed and mosaicked, the region of interest was subset using the inbuilt mosaicking method in ERDAS and a vector boundary layer of the study area.
Table 1:Description of imagery datasets used in the LULC change analysis.

The images were classified using a pixel-based supervised image classification with a maximum likelihood algorithm [36,37]. To obtain appropriate LULC change classification results, ancillary data such as field data, the Digital Elevation Model (DEM), administration maps, and online Google Earth Services were used. Random Ground Control Points (GCPs) from all land use classes were collected for classification-training sites and image signatures to aid image classification. The images were classified into six (6) LULC types: wetland, grassland, forestland, cropland, builtup, and agroforestry. Furthermore, GCPs were obtained from all land use classes using a GPS system in order to compute accuracy assessments for the classification year 2019. Overall precision was 85.91%, 85.22%, and 88.18%, with over-all Kappa coefficients of 0.83, 0.82, and 0.86, respectively. These met the recommended values suggested by Janssen and Vender Wel [38]. The ERDAS Imagine 2014 and ArcMap 10.3.1 tools were used to detect postclassification changes. For each of the years, a final LULC change map was developed. A LULC change analysis was conducted and compared between three time intervals: 1988-2003, 2003-2019, and 1988-2019, based on the classified classes. A change detection matrix was created to display the LULC class conversion and transformations over the last 31 years. The percent of cover change between the periods relative to the initial year was determined using each pair of datasets.
Valuation of ESVs
This study employed the benefit transfer approach to estimate the ESVs based on the adopted global and modified local value coefficients of the ES for the target LULC types; for examples, see Kreuter et al. [15]; Tolessa et al. [9]. In this case, the six major LULC types were compared with their corresponding equivalent biomes, which were developed by Costanza et al. [1], Kindu et al. [8] and Temesgen et al. [29]. The most representative biome was used as a proxy for each LULC type, including (1) tropical forest for agroforestry; (2) cropland for cropland; (3) grass/range land for grassland; (4) wetland/marsh for wetland; (5) tropical forest for forest; and (6) urban for built-up (Table 2). The adopted modified local value coefficients of the ESs were obtained from Kindu et al. [8] and Temesgen et al. [29] as shown in Table 2. The value coefficients were generated based on expert knowledge of the ecological conditions of the Ethiopian rift valley landscape and from other literature, mainly from the TEEB valuation database [39]. The modification of ESV coefficients was performed based on the Benefit Transfer (BT) approach, which refers to the adaptation of existing values or data from one site to estimate the ESVs of other new similar sites in the absence of site-specific valuation information [40,41]. These studies considered values from tropical areas with LULC types similar to their studied geographical setting to ensure the applicability of the transferred data from the TEEB valuation database. The global ESV coefficients were employed from ESs valuation model of Costanza et al. [1] (Table 2). All value coefficients were converted into 1994 US$ ha−1year−1 to facilitate the estimation process of the ESVs and their changes.
Table 2:LULC classes and biome equivalents with their corresponding adapted a) global (Costanza et al. [1] and b) modified local (Kindu et al. [8]; Temesgen et al. [29]) value coefficients.

The LULC datasets for each year, which were used as proxies for the measurement of the ESVs were prepared, and the corresponding area in hectares was assessed and presented in a raster in the GIS. Then, the total value of ESs in the study area for 1988, 2003 and 2019 was calculated by multiplying the area of a given LULC type by the corresponding modified ESV coefficients that were extracted from weight factors of the ESs per hectare of each biome, which was used by Liu et al. [42], as follows:
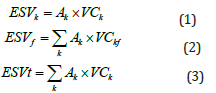
where ESVk, ESVf, and ESVt denote the ecosystem service value for LULC type k, service function f, and the total ESV, respectively; Ak is the area (ha) for LULC type k; VCk is the value coefficient ($ ha−1 yr−1) for LULC type k; and VCkf is the value coefficient ($ ha−1 yr−1) for LULC type k with ES function type f.
Results
Land use/land cover changes
Spatiotemporal distributions of land use/land cover: In the study landscape, a total of six LULC types were extracted with different reference years, namely 1988, 2003 and 2019 (Figure 2). Agroforestry was the dominant LULC type at the start of the study period (1988), accounting for 45.75% of the study landscape, followed by cropland (43.51%), grassland (4.95%), wetland (3.78%), and forestland (1.88%) (Table 3). Built-up areas accounted for just 0.13% of the total land area. The overall condition changed in 2003. Cropland took up the most land (50.37%), followed by agroforestry (36.21%), grassland (6.75%), and forestland (3.65%). Built-up areas and wetland cover occupied the remaining areas. Cropland, agroforestry, and grassland remained the most dominant LULC types in 2019, accounting for 57.55%, 25.42%, and 13.18% of the study area, respectively. Others took up the smallest proportion of the area.
Figure 2:LULC types of the year 1988 (a), 2003 (b), and 2019 (c).

Table 3:LULC areas for the reference years 1988, 2003, and 2019 of the study area.

Dynamics in land use/land cover change: Over the first (1988-2003) and second (2003-2019) study periods, the change results showed a significant reduction in wetland and agroforestry land cover (Table 4). Between the first and second study periods, more than 1131 ha of wetland were converted, accounting for about 66.73% of the total cover in 1988. During the second period, the wetland was further degraded by around 47.35% of the cover that existed in 2003. During the first and second periods, agroforestry decreased by 20.85% and 29.79%, respectively. Despite showing a growing trend during the first study period, forest cover decreased by 85.04 percent during the second. Built-up area, on the other hand, grew by 1208.83% in the first period and 49.83% in the second. Similarly, grassland increased by 36.28% and 95.23%, respectively, in both years. Over the entire study period, cropland showed an increasing trend (Table 4).
Table 4:LULC Changes between the periods 1988, 2003, and 2019 with relative to the basis.

The change matrix analysis shows that approximately 18,979.5ha (42.28%) of the land within the study area experienced LULC changes in one way or another over the 31-year study period (1988-2019) (Table 5). The degree of change varied between the LULC classes. For instance, in 1988, 211.83ha (12.5%) of the 1695.3ha wetland remained unchanged. Other LULC types were used to convert the remaining 87.5% of the 1988 wetland. More than 53% of the wetland area was transformed to grassland in the base year, followed by cropland, which accounted for more than 31% of the total area in 1988. Over the same time period, 9421.71ha (roughly 46%) of agroforestry LULC in 1988 remained unchanged. The remaining 54% was converted to a different LULC type. For example, out of the total cropland cover of 25,839.03ha in 2019, about 9023.09ha (35%) were converted from the area that used to be part of the agroforestry LULC in 1988. Over the study period, the original extent of forestland (around 842.9ha) was reduced by 70.9% due to changes in other LULCs, including about 48.5% that was converted to cropland.
Table 5:LULC change transition matrix (ha) from 1988 to 2019.

Where: AG= Agroforestry; BU= Built-up area; CR= Cropland; FR= Forestland; GR= Grassland; & WE= Wetland. The bold diagonal values represent the area (in ha) of each class that remains unchanged while the off diagonal values represent the change area
In comparison to the LULC change results discussed above, the change matrix study for built-up area, cropland, and grassland revealed significant opposite trends in LULC changes. Built-up areas replaced approximately 1,125.36ha of land previously occupied by other LULC types. Cropland (701.86ha) and agroforestry (389.4ha) were the most common conversions. As a result, the built-up area increased by nearly 1,961% over the study period. Other LULC types converted to cropland as well, but agroforestry had the highest conversion rate (Table 5). During the initial period of the analysis, agroforestry LULC covered about 9023.09ha of cropland. As a result, the area of cropland has increased by 32.3% since 1988. Grassland has replaced about 3,669.78ha of land previously covered by other LULC types. Cropland, agroforestry, and wetland were the most common conversions. As a result, grassland increased by 165.1% over the course of the study.
Estimation of ESVs and changes
The evaluation of the ESVs of the studied landscape for the years 1988, 2003, and 2019 is presented in Table 6. It showed that the total estimated ESVs of the whole study area were approximately US$ 78.42 million in 1988, US$ 49.74 million in 2003, and US$ 32.96 million in 2019 (Table 6, Part a) when the locally modified value coefficients were used. In general, the total estimated ESVs decreased by US$ 45.46 million (57.96%) during the period from 1988 to 2019. The gradual decline of the total ESV over the last 30 years was described by the difference in the ESVs among the LULC types within the different years in the study area. The aggregated ESVs of agroforestry, wetland, and forestland decreased from US$ 76.11 million (97.05%) in 1988 to US$ 29.21 million (88.62%) in 2019 and primarily accounted for the total loss in the ESVs in the studied landscape (Table 6, Part a). The consistently decreased area coverage of agroforestry, wetland, and forest led to decreased ESVs, affecting the total estimated ESV of the study area. This was evident from the fact that the aggregated ESVs of the agroforestry, wetland, and forest ecosystems declined by approximately US$ 46.89 million in the last 30 years, which was significantly higher than the total decline in ESVs in the whole study area, which decreased by approximately US$ 45.46 million (Table 6, Part a). Moreover, wetlands and forests have very small areas but have high contributions to the total ESVs due to their large value coefficients (Table 6). In 1988, wetlands and forests accounted for 33.2 million (42.33%) and 1.6 million (2.16%), respectively, of the total ESV, whereas in 2019, wetlands and forests accounted for 5.81 million (17.64%) and 0.49 million (1.49%), respectively, of the total ESV (Table 6, Part a), indicating a decreasing trend. Similarly, when the global coefficients developed earlier were used, the ESVs were observed to decline from US$ 22.27, 18.13, and 14.49 million in 1988, 2003, and 2019, respectively (Table 6, Part b), leading to a total loss of US$ 7.78 million (34.94%). This estimate was approximately 0.6 times lower than the loss estimated when the modified local value coefficients were adopted. The number of ESVs also differed among the LULC types in different years.
Table 6:Total ecosystem service valuation (ESV) (in $ × 106 year-1) estimated for each LULC type using the adopted modified (A) and global (B) value coefficients.

Discussion
The LULC data derived from remotely sensed imagery and GIS analysis were employed as a proxy for the measurement together with their corresponding value coefficients to assess the changes in the ESVs in response to LULC in the Gedeo highlands of Ethiopia, based on the benefit transfer approach. This approach is currently being used by various researchers to evaluate ESVs and their changes, despite criticism of the assumed uniformity within the land uses and the lack of consideration of the variation in the socioeconomic conditions within an area [8]. In this study, the LULC dataset generated from the Thematic Mapper (TM), Enhanced Thematic Mapper Plus (ETM+), and Operational Land Imager (OLI) images and their corresponding global ecosystem service value coefficients that were adopted from Constanza et al. [1], as well as the modified local value coefficients from Kindu et al. [8] and Temesgen et al. [29], were used to estimate the ESVs and their changes. The changes in patterns of LULC types were some of the important drivers that affected the quality and quantity of ES and the provision of functions [2]. The results showed that LULC changes have been towards decreased agroforestry, wetland, and forestland while cropland, grassland, and built-up areas have increased, affecting the sustainability of the provision of ES to the Gedeo highland ecosystem. These changes are due to population growth, intensification of human activities, and government policies and initiatives that aim to improve the economy of the country without considering the environmental consequences [29,30].
The results of the estimated ESVs in the study area showed that the total ESV obtained from the adopted modified local value coefficients had decreased by US$ 45.46 million (57.96%) over the period from 1988 to 2019, whereas the loss was estimated to be US$ 7.78 million (34.94%) when using the global value coefficients established by Constanza et al. [1]. This estimate was approximately 0.6 times lower than the loss estimated with the modified local value coefficients. The decline in the total ESV was attributed to the decrease in the ESVs of agroforestry, wetlands, and forestland, consistent with varied proportions during the study period. The reduction of these ESVs was mainly attributed to the LULC changes, which mainly decreased the area of agroforestry, wetland, and forestland in the study area. The interaction of the changes in these LULC types affected the total estimated ESVs in the study area. It was revealed that the ESVs for the agroforestry ecosystems contributed significantly to the declining total ESV in both the modified local value coefficients and global value coefficients (Table 6). The aggregated area of change in the wetland and forestland was relatively small compared to those of other LULC types; however, they have a considerable impact on the total value of the ES due to their higher value coefficients. This was similar to the findings of other studies, which revealed that LULC change resulted in a significant loss in the values of Ess [9,17,42,43]. The quantitative results of our study for 1988-2003, 2003-2019, and 1988-2019 revealed the extent of the changes in the ESVs that occurred as a result of LULC change throughout the study period. In general, the total estimated ESVs showed a declining trend for both the modified local value coefficients and the global value coefficients by Costanza et al. [1]. The total amounts of the changes in the ESVs were US$ 28.68 million (36.57%), US$ 16.78 million (33.73%), and US$ 45.46 million (57.96%) for 1988-2003, 2003- 2019, and 1988-2019, respectively, when adopted locally modified value coefficients were used. With the global coefficients, although the amounts differed, a significant decrease in the total values was also observed over the study period.
Conclusion
The LULC changes in the Gedeo highlands have resulted in a loss of the ESV over the last 30 years. It is estimated that the total ESV has decreased by US$ 45.46 million (57.96%) when using the adopted modified local value coefficients to US$ 7.78 million (34.94%) when using global value coefficients. This loss of ESVs is associated with decreased agroforestry, wetland, and forestland. The estimated losses of ESVs in the last 30 years have shown that Gedeo highland has been ecologically degraded and that it needs attention. The minimum estimates provided by this study give preliminary information that can be utilized by various development stakeholders to take into account the financial costs of the ecological losses that occurred. Our study further recommends policy actions and strategies that take into consideration the ecosystem‐based approach to maintain a balance between development initiatives and ecosystem health. In addition, local communities should adapt climate‐smart agriculture, such as agroforestry, to protect forests and payment for environmental services to protect forests and wetlands, which have had larger contributions to the total ESVs. Nevertheless, the valuation of the ESs showed the status of the ESs in the Gedeo highland and the minimum estimated values that provide insight into the tradeoffs involved in land resource use.
Acknowledgment
The authors would like to thank the three district agricultural officials as well as the local communities of the Districts for their support during field data collection. We are also indebted to Dilla University for its financial support in conducting this study.
References
- Costanza R, d’Arge R, de Groot R, Farber S, Grasso M, et al. (1997) The value of the world’s ecosystem services and natural capital. Nature 387: 253-260.
- Costanza R, de Groot R, Sutton P, van der Ploeg S, Anderson SJ, et al. (2014) Changes in the global value of ecosystem services. Global Environmental Change 26: 152-158.
- de Groot R, Brander L, van der Ploeg S, Costanza R, Bernard F, et al. (2012) Global estimates of the value of ecosystems and their services in monetary units. Ecosystem Services 1(1): 50-61.
- MEA (2005) Ecosystems and human well-being, Island Press, Washington DC, USA.
- Braat LC, de Groot R (2012) The ecosystem services agenda: bridging the worlds of natural science and economics, conservation and development, and public and private policy. Ecosystem Services 1(1): 4-15.
- Kubiszewski I, Costanza R, Anderson S, Sutton P (2017) The future value of ecosystem services: Global scenarios and national implications. Ecosystem Services 26(Part A): 289-301.
- Sutton PC, Anderson, SJ, Costanza, R, Kubiszewski I (2016) The ecological economics of land degradation: Impacts on ecosystem service values. Ecological Economics 129: 182-192.
- Kindu M, Schneider T, Teketay D, Knoke T (2016) Changes of ecosystem service values in response to land use/land cover dynamics in Munessa-Shashemene landscape of the Ethiopian highlands. Science of the Total Environment 547: 137-147.
- Tolessa T, Senbeta F, Abebe T (2017) The impact of land use/land cover change on ecosystem services in the central highlands of Ethiopia. Ecosystem Services 23: 47-54.
- Guan DJ, Li HF, Inohae T, Su WC, Nagaie T, et al. (2011) Modeling urban land use change by the integration of cellular automaton and Markov model. Ecol Model 222(20-22): 3761-3772.
- Halmy MWA, Gessler PE, Hicke JA, Salem BB (2015) Land use/land cover change detection and prediction in the north-western coastal desert of Egypt using Markov-CA. Appl Geogr 63: 101-112.
- Zheng HW, Shen GQ, Wang H, Hong JK (2015) Simulating land use change in urban renewal areas: A case study in Hong Kong. Habitat Int 46: 23-34.
- Garedew E, Sandewall M, Söderberg U, Campbell BM (2009) Land-use and land-cover dynamics in the central rift valley of Ethiopia. Environmental management 44: 683-694.
- Kindu M, Schneider T, Teketay D, Knoke T (2015) Drivers of land use/land cover changes in Munessa-Shashemene landscape of the south-central highlands of Ethiopia. Environ Monit Assess 187(7): 452.
- Kreuter UP, Harris HG, Matlock MD, Lacey RE (2001) Change in ecosystem service values in the San Antonio area, Texas. Ecol Econ 39: 333-346.
- Li RQ, Dong M, Cui JY, Zhang LL, Cui QG, et al. (2007) Quantification of the impact of land-use changes on ecosystem services: A case study in Pingbian County, China. Environ Monit Assess 128(1-3): 503-510.
- Peng J, Wang YL, Wu JS, Yue J, Zhang YA, et al. (2006) Ecological effects associated with land-use change in China’s southwest agricultural landscape. Int J Sust Dev World Ecol 13(4): 315-325.
- Portela R, Rademacher I (2001) A dynamic model of patterns of deforestation and their effect on the ability of the Brazilian Amazonia to provide ecosystem services. Ecol Model 143(1-2): 115-146.
- Temesgen H, Nyssen J, Zenebe A, Haregeweyn N, Kindu M, et al. (2013) Ecological succession and land use changes in a lake retreat area (Main Ethiopian Rift Valley). J Arid Environ 91: 53-60.
- Szumacher I, Pabjanek P (2017) Temporal changes in ecosystem services in European cities in the continental biogeographical region in the period from 1990-2012. Sustainability 9: 665.
- Liu S, Costanza R (2010) Ecosystem services valuation in China. Ecol Econ 69: 1387-1388.
- Troy A, Wilson MA (2007) Mapping ecosystem services: Practical challenges and opportunities in linking GIS and value transfer. Ecol Econ 60(2): 435-449.
- Wang Y, Dai E, Yin L, Ma L (2018) Land use/land cover change and the effects on ecosystem services in the Hengduan Mountain region, China. Ecosyst Serv 34(Part A): 55-67.
- Zhang F, Yushanjiang A, Jing Y (2019) Assessing and predicting changes of the ecosystem service values based on land use/cover change in Ebinur Lake Wetland National Nature Reserve, Xinjiang, China. Sci Total Environ 656: 1133-1144.
- Hein L, Van Koppen K, Groot RS, Van Ierland E (2006) Spatial scales, stakeholders and the valuation of ecosystem services. Ecol Econ 57(2): 209-228.
- Turner RK, Paavola J, Cooper P, Farber S, Jessamy V, et al. (2002) Valuing nature: Lessons learned and future research directions. Ecol Econ 46(3): 493-510.
- Meshesha DT, Tsunekawa A, Tsubo M (2012) Continuing land degradation: cause-effect in Ethiopia’s Central Rift Valley. Land Degradation and Development 23(2): 130-143.
- Tsegaye D, Moe SR, Vedeld P, Aynekulu E (2010) Land-use/cover dynamics in Northern Afar rangelands, Ethiopia. Agriculture, Ecosystems and Environment 139(1-2): 174-180.
- Temesgen H, Wu W, Shi X, Yirsaw E, Bekele B, et al. (2018) Variation in ecosystem service values in an agroforestry dominated landscape in Ethiopia: Implications for land use and conservation policy. Sustainability 10(4): 1126.
- Ketema K, Wu W, Temesgen H (2018) Quantifying the ecological values of land use types via criteria-based farmers’ assessment and empirically analyzed soil properties in southern Ethiopia. Appl Ecol Envion Res 16(6): 7713-7739.
- Legesse A (2014) The dynamics of Gedeo agroforestry and its implication to sustainability. PhD Dissertation, UNISA, Pretoria, South Africa.
- Bule District Agricultural and Natural Resource Office (BDANRO) (2018) Plan and program annual report, Ethiopia.
- Negash M (2013) The indigenous agroforestry systems of the south-eastern rift valley escarpment, Ethiopia. PhD dissertation, University Helsinki, Finland.
- Chander G, Markham BL, Helder DL (2009) Summary of current radiometric calibration coefficient for Landsat MSS, TM, ETM+, and EO-1 ALI sensors. Remote Sensing of Environment 113(5): 893-903.
- Paolini L, Grings F, Sobrino JA, Jiménez Muñoz JC, Karszenbaum H (2006) Radiometric correction effect in Landsat multi-date/multi-sensor change detection studies. International Journal of Remote sensing 27(4): 685-704.
- Currit N (2005) Development of a remotely sensed historical land cover change database for rural Chihuahua, Mexico. International Journal of Applied Earth Observation and Geoinformation 7(3): 232-247.
- Kuemmerle T, Radeloff VC, Perzanowski K, Hostert P (2006) Cross boarder comparison of land cover and land scape pattern in Eastern Europe using a hybrid classification technique. Remote sensing of Environment 103(4): 449-464.
- Janssen LLF, van der Wel FJM (1994) Accuracy assessment of satellite derived land cover data: A review. Photogrammetric Engineering and Remote Sensing 60(4): 4198-426.
- TEEB (2010) The economics of ecosystems and biodiversity: Ecological and economic foundations. In: Pushpam Kumar (Ed), (1st edn), Routledge, England, UK, London, UK.
- Farber S, Costanza RDL, Erickson J, Gross K, Grove M, et al. (2006) Linking ecology and economics for ecosystem management. Bioscience 56(2): 121-133.
- Richardson L, Loomis J, Kroeger T, Casey F (2014) The role of benefit transfer in ecosystem service valuation. Ecol Econ 115: 51-58.
- Liu Y, Li J, Zhang H (2012) An ecosystem service valuation of land use change in Taiyuan City, China. Ecological Modelling 225: 127-132.
- Gashaw T, Tulu T, Argaw M, Worqlul AW, Tolessa T, et al. (2018) Estimating the impacts of land use/land cover changes on Ecosystem Service Values: The case of the Andassa watershed in the Upper Blue Nile basin of Ethiopia. Ecosystem Services 31(Part A): 219-228.
© 2023 © Eshetu Yirsaw. This is an open access article distributed under the terms of the Creative Commons Attribution License , which permits unrestricted use, distribution, and build upon your work non-commercially.
Editor In Chief


.jpg)


Signup for Newsletter

Quick Links
 Editorial Board Registrations
 Submit your Article
 Refer a Friend
 Advertise With Us
Our Recent Edition

.jpg)


Top Editors


.jpg)


.bmp)
.jpg)
.png)
.jpg)


.jpg)


.png)

.png)


.png)


Financial Support

Sponsors

Latest e-Books

Latest Video

 a Creative Commons Attribution 4.0 International License. Based on a work at www.crimsonpublishers.com.
Best viewed in
a Creative Commons Attribution 4.0 International License. Based on a work at www.crimsonpublishers.com.
Best viewed in