- Submissions

Full Text
Environmental Analysis & Ecology Studies
Eastern Fire Salamander (Salamandra infraimmaculata) skin Mucus Metabolites – LC-MS/MS Analysis
Soliman Khatib1*, Sanaa Musa1*, Gad Degani1, Gad Ish Am2 and Neria Yatom2
1MIGAL-Galilee Research Institute, Kiryat Shmona, Israel; Faculty of Science and Technology, Tel-Hai Academic College, Kiryat Shmona, Israel
2Kibbutz Sasa, Upper Galilee, Israel
*Corresponding author: Soliman Khatib, MIGAL-Galilee Research Institute, Kiryat Shmona, Israel; Faculty of Science and Technology, Tel-Hai Academic College, Kiryat Shmona, Israel
Sanaa Musa, MIGAL-Galilee Research Institute, Kiryat Shmona, Israel; Faculty of Science and Technology, Tel-Hai Academic College, Kiryat Shmona, Israel
Submission: March 23, 2023; Published: April 10, 2023

ISSN 2578-0336 Volume10 Issue5
Abstract
Metabolites were determined in skin mucus of the Near Eastern fire salamander (Salamandra infraimmaculata) by LC-MS/MS analysis. The salamanders were sampled from three different sites at the southern border of their distribution in Israel: Kibbutz Sasa in the Upper Galilee and Manof in the Lower Galilee-both semi-arid mountain areas, and Dan River (Dan), where water is available year-round at a constant temperature. In total, 1112 metabolites were detected in the secreted mucus on the salamanders’ backs. Many of them were known protective substances (SSP) found in Salamandra salamandra. Of the metabolites, 891 were found in all of the S. infraimmaculata populations, 119 were found only in the salamanders from Manof, 84 only in the Sasa population and 7 only in the Dan salamanders. The percentage of metabolites that were common to salamanders from Dan and Manof, and to those from Dan and Sasa, was significantly lower than that between the two mountain populations (Manof and Sasa). The chemical names and formulas of 14 metabolites found in S. infraimmaculata are described. Comparison of these 14 metabolites among populations from the different habitats showed no significant difference in metabolite level, except for 2 metabolites between Sasa and Dan-cholic acid and dihydronandrolone, and one between Manof and Dan-samanine.
Keywords:Salamandra infraimmaculata; Skin mucus; Protective Substances (SSP); Metabolites
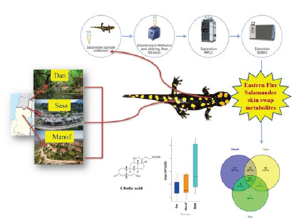
Graphical Abstract
Figure 1:
Introduction
Salamander species of the genus Salamandra are common in Europe, and the southern limit of their distribution is in North Africa, where the species Salamandra algira is found, and in the Near East, where Salamandra infraimmaculata is found [1]. The yellow-spotted black species of Salamandra in Europe have been described in detail in several articles [1], as has the species S. infraimmaculata at the southern limit of its distribution [1,2]. All species of the genus Salamandra secrete poisons, termed Salamandra Skin Poison (SSP), which serves to protect them in conjunction with the salamander’s warning colors. SSP has been characterized as steroidal alkaloids of the samandarine type [3]. Most of the studies on the mucus secreted from the skin of salamanders have been conducted on S. salamandra from Europe. Gas Chromatography-Mass Spectrometry (GC-MS) and Electron Spray Ionization Mass Spectrometry (ESI-MS) analyses have identified a group of secreted substances that are steroidal alkaloids: samandarine, samadarone, O-acetylsamandarine, samanone and O-3-hydroxybutanoyl samandarine [3]. Plácido A et al. [4] identified peptides, of which salamandrin-I, [M+H]+ = 1406.6 Da, was selected for solid-phase synthesis; it showed free radical-scavenging activity against DPPH and ABTS radicals, but no antimicrobial activity against Gram-positive or Gram-negative bacteria [4]. The biological activities of these steroidal alkaloids from S. salamandra and other organisms, including blockbuster drugs such as abiraterone acetate, have been described [5]
The genetic structure of the salamander population at the southern limit of its distribution in Israel, belonging to the species S. infraimmaculata, differs from that of the salamanders in Europe (S. Salamandra) [6-10]. In Israel, the salamanders are found in isolated populations, and various differences have been found among those populations, including ecological [11-14], morphological [15,16], physiological [17,18], behavioral [12] and genetic [19- 21] differences. The purpose of this study was to examine the metabolites in the mucus secreted by S. infraimmaculata from different habitats at the southern limit of its distribution.
Material and Methods
Sample collection
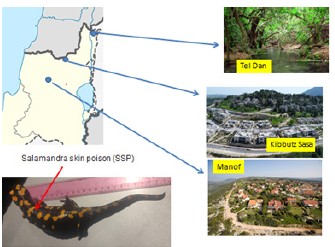
Salamander skin-excreted mucus samples were collected from salamander populations in three sites in Israel: Dan, Sasa, and Manof (Figure 2). The distance between Sasa and Dan is 50km, between Sasa and Manof 36km and between Dan and Manof 86km. Each animal was picked up in one hand, and the secretion was collected by applying filter paper with gentle thumb pressure.
Figure 2:The three sites from which the salamander mucus samples were collected. The illustration shows a salamander secreting the poisonous white mucus. The distance between Sasa and Dan is 50km, between Sasa and Manof 36km and between Dan and Manof 86km. The breeding places of the salamanders in Dan, Sasa and Manof are in pits carved out of stone, man-made, and water year-round in Dan [19-21].
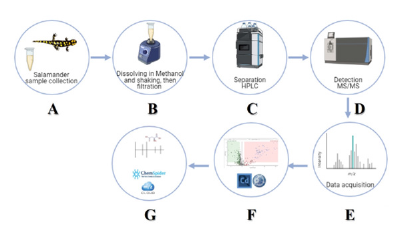
This secretion was extracted in 3mL of methanol for 10min with gentle vortexing. The samples were filtered through a 0.22-μm membrane, and the solvent was evaporated to dryness under nitrogen flow and kept at -80 °C, until analysis by liquid chromatography with tandem mass spectrometry (LC-MS/MS) (Figure 3). The samples were freshly prepared by dissolving them to a concentration of 2mg/mL in methanol. For untargeted metabolomics analysis, Quality Control (QC) procedures were used to ensure data quality. A pooled matrix was prepared by mixing a small volume (20μL) of each experimental sample and this served as the QC sample with four replicates. The blank contained methanol.
Figure 3:Scheme of the study protocol. (A) Mucus is sampled from the salamander’s back and head; (B) the sample is extracted in methanol, and (C) separated by HPLC; (D) detection of substances by MS/MS; (E) data acquisition; (F) data analysis by Compound Discoverer 3.3; (G) identification of the metabolites using MzCloud and ChemSpider databases.
Metabolomics instrumentation
The QC samples, blanks, and Salamandra samples were analyzed by injecting 5μL of the extracted solutions into an Ultra-High-Performance LC (UHPLC) apparatus connected to a photodiode array detector (Dionex Ultimate 3000), with a reversephase column (ZORBAX Eclipse Plus C18, 3.0x100mm, 1.8μm) (Figure 3). The QC and blank samples were injected first in the sequence, and then after every 10 samples and at the end of the sequence to ensure data quality. The mobile phase was comprised of (A) DDW with 0.1% formic acid and (B) acetonitrile with 0.1% formic acid. The gradient began with 2% B which was kept for 1.5min, then increased to 30% B over 2.5min, then to 40% B over 1min and kept isocratic at 40% B for 3min. It was then increased to 50% B over 6min and kept isocratic at 50% B for 4min. Solution B was then increased to 95% over 5min and kept for 9min more at 95%, then returned to 2% over 2min, and the column was allowed to equilibrate at 2% B for 4min before the next injection.
The flow rate was 0.4mL/min. The LC-MS/MS analysis was performed with a Heated Electrospray Ionization (HESI-II) source connected to a Q Exactive™ Plus Hybrid Quadrupole-Orbitrap™ Mass Spectrometer (Thermo Scientific). The ESI capillary voltage was set to 3900V, capillary temperature to 350 °C and gas temperature to 350 °C. Nitrogen gas (N2) was used. The MS conditions were set as follows: the flow rate of sheath gas, aux gas, and sweep gas were kept at 35L/min, 10L/min and 1L/min, respectively. For MS2 (tandem mass spectrometry) analysis, the collision energy was set to 15, 50 and 100EV. The mass spectra (m/z 67-1000) were obtained in negative-and positive-ion mode with high resolution (FWHM=70,000at m/z=200) and mass tolerance=5ppm.
Metabolomics data processing
Peak determination and peak area integration were performed with Compound Discoverer 3.3 (version 3.1.0.305; Thermo Xcalibur). Auto-integration of peak areas was manually inspected and corrected where necessary. Peak areas from each sample were normalized to the QC as follows: peak areas that exhibited a Relative Standard Deviation (RSD) above 50% in the pooled QC samples were removed from the analysis. RSD<50% was corrected using QC samples as reported previously (Dunn et al., 2011). For some compounds, identification was based on the MzCloud database using MS2 data (to obtain accurate qualitative and relative quantitative results) and the Chem Spider database using High-Resolution Mass Spectrometry (HRMS).
Data processing calculations and statistics
For the LC-MS/MS results, peak area medians, SD and RSD were calculated using the Compound Discoverer 3.3 program. Significant differences between groups (p<0.05) were determined by one-way analysis of variance (ANOVA).
Results
In total, 1112 metabolites were detected. Volcano plots comparing the untargeted metabolites in the mucus of the three populations are shown in Figure 4, and a Venn diagram is shown in Figure 5. Some of these metabolites are further described in Tables 1 & 2. Mucus composition was significantly different for the three salamander populations (Figure 3). A list of 14 metabolites that were found in the three populations-Manof, Sasa and Dan-is given in Table 1. In total, about 1112 different metabolites were found in the mucus secreted from the salamanders’ body (Figure 5). Many of the metabolites found in the mucus were known SSPs. 891 metabolites were common to the three S. infraimmaculata populations, 119 were unique to the Manof population, 84 to Sasa and 7 to Dan (Figure 5). The percentage of metabolites shared between the salamanders from Dan and Manof (0.1%), and between those from Dan and Sasa (0.2%), was significantly lower than that between the two mountain populations (Manof and Sasa, 0.7%) (Figure 5).
Table 1:Fourteen metabolites in the mucus of S. infraimmaculata. D, Dan; M, Manof, S: Sasa.
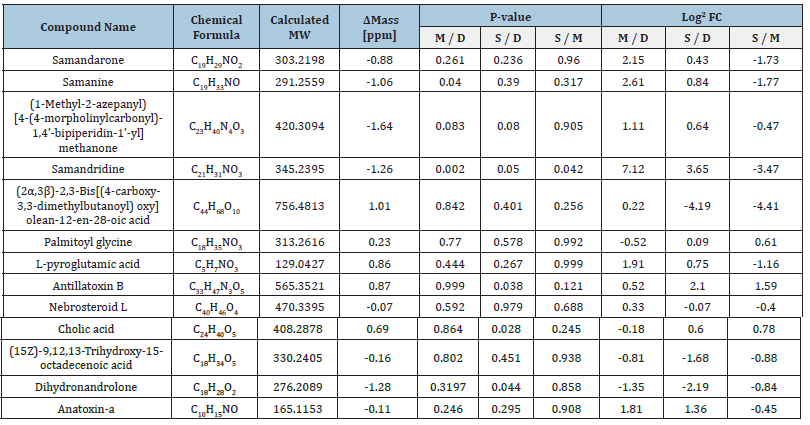
Table 2:Chemical structures and compound names of metabolites identified in the mucus of Salamandra infraimmaculata (Table 1).
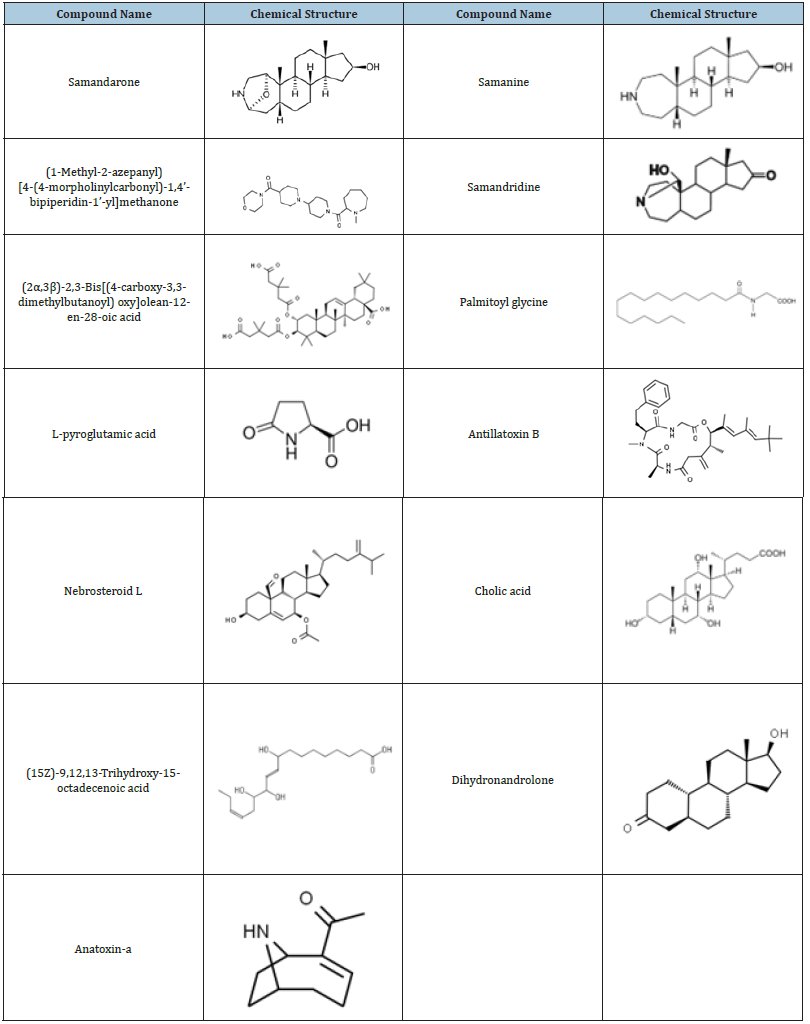
Figure 5:Venn diagram of the untargeted metabolites in the mucus of S. infraimmaculata from three sites (Manof, Sasa and Dan).
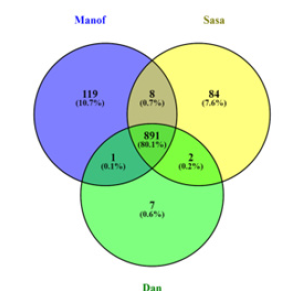
Names and chemical formulas of 14 of the metabolites found in S. infraimmaculata in Israel (Manof, Sasa and Dan) are presented in Table 1. Some of these metabolites have also been described in S. salamandra in Europe [1,5]. The chemical structures and compound names of the metabolites identified in the mucus of S. infraimmaculata are presented in Table 2. No significant differences in normalized area were found for most of these metabolites among the different population of salamanders, except for the cholic acid and dihydronandrolone between Sasa and Dan, and samanine between Manof and Dan. Samanine and samandarone were present at different levels in the mucus of the three populations of salamanders from different habitats (Figure 6 & 7). Both were higher in the Manof population than in the Dan and Sasa populations, but the difference was only significant (p<0.05) between Manof and Dan. No significant differences were found in the comparison of the 14 different metabolites’ level from the different salamander populations (Table 1), except for 1 metabolite between Manof and Dan and between Sasa and Dan samandridine; (Figure 8), and 2 metabolites between Sasa and Dan-cholic acid (Figure 9) and dihydronandrolone (Figure 10).
Figure 6:Comparison between the normalized areas of samanine in the mucus of the three populations’ salamanders, measured by auto-integration using Compound Discoverer 3.3. Results are presented as mean±SD.
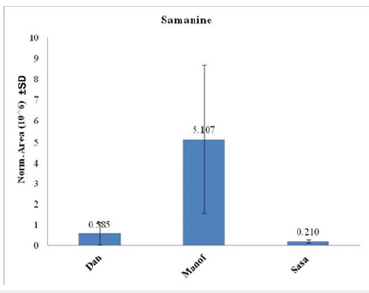
Figure 7:Comparison between the normalized areas of the samandarone in the mucus of the three populations of salamanders, measured by auto-integration using Compound Discoverer 3.3. Results are presented as mean ±SD.
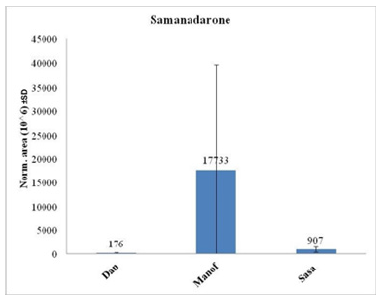
Figure 8:Comparison between the normalized areas of samandridine found in the mucus of the three populations of salamanders, measured by autointegration using Compound Discoverer 3.3. Results are presented as mean ± SD.
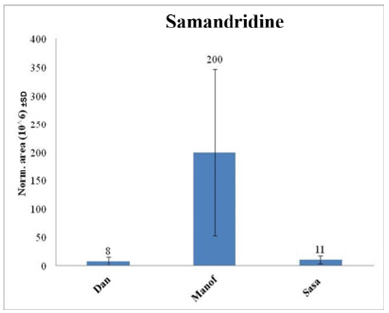
Figure 9:Comparison between the normalized areas of cholic acid found in the mucus (mean ± SD) of the three populations of salamanders.
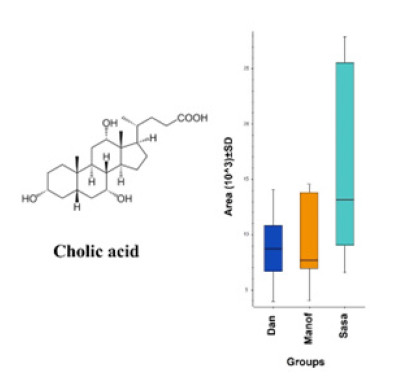
Figure 10:Comparison between the normalized areas of dihydronandrolone in the mucus (mean ± SD) of the three populations of salamanders.

Discussion
Many studies have been published on SSP-the toxic mucus secreted from Salamandra skin, most characterized steroidal alkaloids of the sandarin type [3-5] belonging to the species S. salamandra. The data published here on the species S. infraimmaculata is preliminary in this field, as not much work has been done on this species [1]. This species is found in isolated populations at the southern limit of its distribution, where the ecological conditions are different from the habitats of S. salalmandra in Europe [1,21]. The habitats of the S. infraimmaculata studied in this work included a high mountain (Sasa population), a low mountain (Manof population) and Dan River, a stable habitat where there is water year-round [21]. We present here the first study that examines substances secreted from the skin of this species of salamander, and also compares between geographically isolated populations. The differences found in the mucus secretions of S. infraimmaculata from the various habitats paralleled differences in many biological parameters, such as: morphological [14-16], physiological [14,15], genetic [6,17,15] and behavioral [11,12]. Most of the metabolites found here in the S. infraimmaculata mucus have also been found in S. salamandra [3-5]. However, the comparison between the populations from different habitats in Israel [21] indicated metabolite differences. Although in most cases no significant difference was found between the three populations regarding the 14 metabolites tested in the mucus composition, nevertheless, a difference was found for 2 metabolites between Sasa and Dan-cholic acid and dihydronandrolone, and one between Manof and Dan-samanine. The number of metabolites discovered in this work in the population was much larger. Therefore much more work is needed to define the differences between these populations from different habitats. The black-yellow coloration of S. infraimmaculata probably serves to deter predators [1], as described in other species of Salamandra, but solid evidence for aposematism in Salamandra is still lacking. Different colorpattern phenotypes for the yellow spots on the black back of the S. infraimmaculata populations studied here have been found [16]. The differences between the color patterns for the salamander populations in Dan and Sasa, and the concomitant variation found here in SSP composition may indicate a connection between these two variables.
Acknowledgement
Sanaa Musa would like to thank Ms. Mor Shlush and Ms. Elizabeth Kostanda for their technical support.
References
- Lüddecke T, Schulz S, Steinfartz S, Vence M (2018) A salamander’s toxic arsenal: Review of skin poison diversity and function in true salamanders, genus Salamandra. Naturwissenschaften 105(9-10): 56.
- Degani G (2017) Ecological, biological and genetic adaptation to xeric habitats of Salamandra infraimmaculata on the southern border of its distribution. Open Journal of Animal Sciences 7(1): 70-92.
- Kneppe K, Lüddecke T, Preißler K, Vences M, Schulz S (2019) Isolation and identification of alkaloids from poisons of fire Salamanders (Salamandra salamandra). Journal of Natural Products 82(5): 1319-1324.
- Plácido A, Bueno J, Barbosa EA, Moreira DC, Dias JN, et al. (2020) The antioxidant peptide Salamandrin-I: First bioactive peptide identified from skin secretion of Salamandra genus (Salamandra salamandra). Biomolecules 10(4): 512.
- Xiang ML, Hu BY, Qi ZH, Wang XN, Xie TZ, et al. (2022) Chemistry and bioactivities of natural steroidal alkaloids. Natural Products and Bioprospecting 12(1): 23.
- Goldberg T, Pearlson O, Nevo E, Degani G (2007) Mitochondrial DNA analysis of Salamandra infraimmaculata larvae from habitats in northern Israel. Progress and Perspectives in Veterinary Medicine-Scientific papers, pp. 23-31.
- Goldberg T, Nevo E, Degani G (2010) Genetic variation in Salamandra infraimmaculata from various breeding sites-a model for habitat selection. Asian Herpetological Research 1: 1-9.
- Goldberg T, Nevo E, Degani G (2011) Genetic diverseness and different ecological conditions in Salamandra infraimmaculata larvae from various breeding sites. Animal Biology Journal 2: 37-49.
- Rodríguez A, Burgon JD, LyraIker M, Denis I, Baurain L, et al. (2017) Inferring the shallow phylogeny of true salamanders (Salamandra) by multiple phylogenomic approaches. Molecular Phylogenetics and Evolution 115: 16-26.
- Burgon JD, Vences M, Steinfartz S, Elmer KR (2020) Phylogenomic inference of species and subspecies diversity in the palearctic salamander genus Salamandra. Molecular Phylogenetics and Evolution 157: 107063.
- Degani G, Warburg MR (1976) Biological and ecological studies on the salamander salamandra Salamandra salamandra. Israel Journal of Zoology 25: 206-207.
- Degani G, Warburg MR (1978) Population structure and seasonal activity of the adult Salamandra salamandra (L.) (Amphibia Urodela Salamandridae) in Israel. Journal of Herpetology 12: 437-444.
- Degani G, Mendelssohn H (1982) Seasonal activity of Salamandra salamandra (L.) (Amphibia, Urodela) in headwaters of the Jordan river. Israel Journal of Zoology 31: 77-85.
- Degani G (1986) Growth and behavior of six species of amphibian larvae in a winter pond in Israel. Hydrobiologia 140: 5-10.
- Degani G (1986b) Plasma protein and morphology of Salamandra salamandra in Israel. Amphibia-Reptilia 7: 105-114.
- Degani G, Ish-am G, Ish-am Am, A, Yatom N, Marshansky A, et al. (2023) The yellow spot pattern of Salamander (Salamandra infraimma culata) in various habitats at the southern border of its distribution in Israel. Open J Anim Sci 13(1): 114-125.
- Degani G (1981) The adaptation of Salamandra salamandra (L.) from different habitats to terrestrial life. British Journal of Herpetology 6: 169-172.
- Degani G (1981) Salinity tolerance and osmoregulation in Salamandra salamandra (L.) from different populations. Journal of Comparative Physiology 145: 133-137.
- Degani G (1996) The Salamander at the southern limit of its distribution, Laser Pages Publishing, Jerusalem, Israel.
- Degani G, Jackson K, Dosoretz C, Plotzky Y (1999) Molecular DNA variation in Salamandra infraimmaculata from different habitats. Israel Journal of Zoology 44(2): 239-246.
- Degani G, Mendelssohn H, Warburg MR, Shkolnik A, Goldberg T, et al. (2019) The fire salamandra (Salamandra infraimmaculata) and the banded newt (Triturus vittatus) along the southern border of their distribution. Scientific Research Publishing, Wuhan, China.
© 2023 © Soliman Khatib. This is an open access article distributed under the terms of the Creative Commons Attribution License , which permits unrestricted use, distribution, and build upon your work non-commercially.
 a Creative Commons Attribution 4.0 International License. Based on a work at www.crimsonpublishers.com.
Best viewed in


.jpg)


 Editorial Board Registrations
 Submit your Article
 Refer a Friend
 Advertise With Us
.jpg)


.jpg)


.bmp)
.jpg)
.png)
.jpg)


.jpg)


.png)

.png)


.png)


