- Submissions

Full Text
Environmental Analysis & Ecology Studies
Evaluation of Toxic Elements in the Agricultural Soils of the Mbalmayo City (Centre-Cameroon)
Natanael T1*, Clotaire KN1, Christelle KF1, Bertrand MM2, Jacques E3 and Suh CE4
1Department of Earth Sciences, University of Yaoundé, Cameroon
2Department of Earth Sciences, University of Dschang, Cameroon
3Department of Earth Sciences, University of Douala, Cameroon
4Department of Earth Sciences, University of Bamenda, Cameroon
*Corresponding author: Natanael T, Department of Earth Sciences, University of Yaoundé, Cameroon
Submission: September 16, 2022; Published: December 21, 2022

ISSN 2578-0336 Volume10 Issue2
Abstract
Mbalmayo is a medium city in Cameroon facing several problems including urban waste management. These wastes are sometimes incorporated into the urban soil due to a deficient collection system. The purpose of this study was to assess the concentrations of Trace Metals (TMEs) in soils intensively used for agriculture. Soil samples from three sites were analyzed for environmental physical chemistry and by Inductively Coupled Plasma Mass Spectrometry (ICP/MS). Some indices, including the enrichment factor (EF), the Geo-Accumulation Index (Igeo) and the Pollution Index (PI) were calculated to reflect the intensity of the contamination risk. The results for Cadmium (Cd), Copper (Cu), Iron (Fe), Manganese (Mn), Lead (Pb) and Zinc) Zn concentrations showed values of 0.10-0.45; 10.33-28.34; 1195-20020; 26.03-61.61; 15.60-48.00 and 40.12-206.36 mg/Kg respectively. They revealed highly variable levels of the defined trace metals. The presence of these hazardous elements in soils indicates a potential risk to the environment. The pollution index ranges from 0.13 to 0.31 and the enrichment factor is 0.11 to 8.58. This indicates a low to high enrichment of the soils in metallic trace elements. These results confirm a deterioration of soil quality.
Keywords:Trace metallic element; Contamination; Uncontrolled urbanization; Soil quality
Introduction
Cameroon is going through a historic period of demographic change. Indeed, if at the beginning of the 1990s two thirds of the African population lived in rural areas, by 2030 this figure is expected to double compare to 2010, and half of the population will move to the cities, 759.4 million inhabitants. Tsegai D [1] shows that the annual rate of urbanization has been between 4.7 and 9 percent for nearly a century. In addition, the anarchic and uncontrolled urbanization practiced, generates many corollaries among which, the anarchic invasion of natural spaces, the production and mismanagement of waste as well as urban agriculture to meet the ever-increasing food needs [2,3]. This situation has led to the development of various activities, some of which degrade the soil, water and air [4-6]. Soil also provides a habitat for living things: plants, animals and other microorganisms. Therefore, it is a vital part of environmental resources. Among the widespread pollutants, the Metallic Trace Elements (MTEs) are difficult to degrade. However, they can migrate and accumulate in the various components of ecosystems. These TMEs can be incorporated into the food chain and endanger the health of populations [7,8].
Their behavior depends on several factors: pH, cationic exchange capacity, clay content and organic matter. These parameters control the dynamics of pollutants, their solubility and their availability to plants. The Works of [9] on selected soils in different parts of the world revealed high concentrations of MTEs. For [10-13], these measured concentrations in soils are the combined result of weathering of primary minerals, their redistribution within the profiles, and exogenous inputs often related to anthropogenic activities. In the city of Mbalmayo, the anarchic occupation of the urban space is marked by the practice of agriculture, livestock, wood processing industry, coal manufacturing, aggregate exploitation, car garages, gas stations, metal welding workshops, the manufacture of cooking pots and presence of illegal dumps not far from the houses. Thus, the urban soils are positioned as real receptacles of wastes from different activities. Numerous studies have shown that the concentrations of TMEs are important in the soils of the world’s cities. So, the trace metal pollution indicator is a powerful tool for ecological geochemistry assessment [14-16]. For [14], these indicators assess the degree to which the chemical condition could harm living organisms. Their study is designed to assist in soil quality management.
While elsewhere data on the concentrations and dispersion of Trace Metal Elements (TMEs) are well controlled, in Cameroon and particularly in Mbalmayo, the question of trace metals in urban soils remains unanswered. However, most of the agricultural products intended for consumption come from these soils. The objective of this study is to make an assessment of the TME concentration. The aim is to evaluate the contamination by studying the TME concentrations and the enrichment factor.
Materials and Methods
Study area
The town of Mbalmayo is located between 03°22’00’’ and 03°38’40’’ North latitudes and 11°22’00’’ and 11°38’40’’ East longitudes (Figure 1). It is a crossroad city between Yaoundé and Ebolowa, covering an area of about 1200ha. Marked by anarchic urbanization, the uncontrolled practice of certain activities (Table 1) and the lack of adequate sanitation infrastructures generate the discharge of various pollutants into the environment. The climate is a humid tropical equatorial with four distinct seasons. The annual rainfall (Pm) is 1709mm and the average annual Temperature (Tm) is 24.03 °C. The vegetation is that of the semicaducious forest sector of the Guinean Congo Dense Forest domain. The geomorphology is characterized by a gently undulating erosion surface with an average altitude of 700m, subdivided into three units: lowlands below 650m, hills with rounded tops between 660- 700m, rare inselbergs with an altitude above [17]. This climate and geomorphology are at the origin of the formation of red and yellow ferrallitic soils in the interfluves and organic hydromorphic soils in the lowlands [18].
Figure 1: The study area showing the sampling location in Mbalmayo.
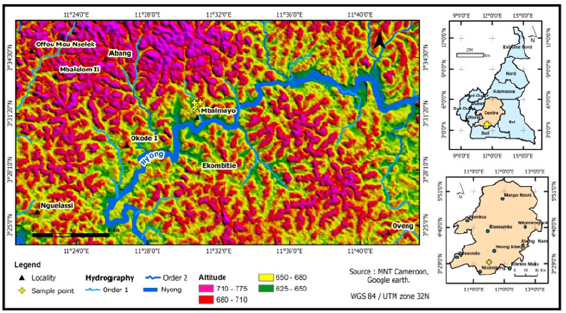
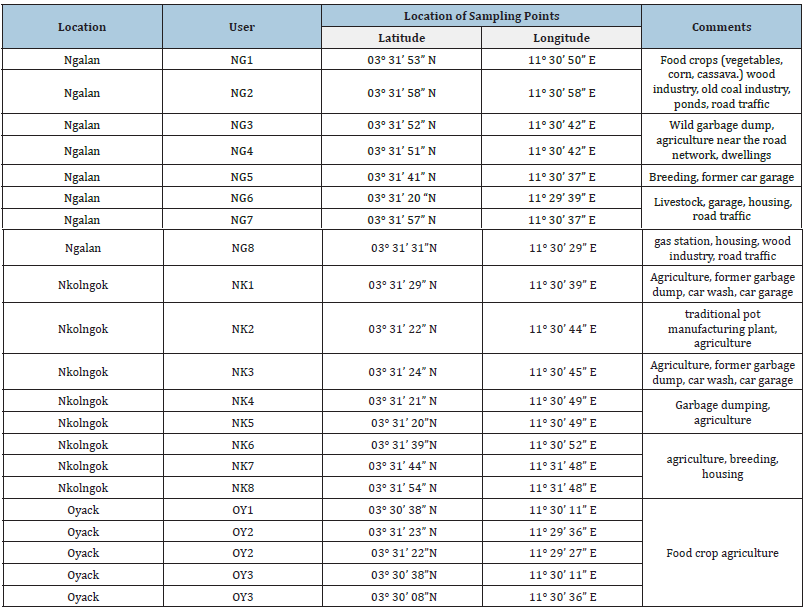
Table 1:Sampling points coordinates.
Sampling area
Field work was conducted at three sites: Ngalan (E 11° 30’ 37”; N 03° 31’ 41”), Nkolngok (E 11° 30’ 49”; N 03° 31’ 21”), and Oyack (E 11° 29’ 36”; N 03° 30’ 38”). The sampling strategy consisted of delineating each site into different more homogeneous areas representative of an activity following a visual inspection. Based on the description made on each homogeneous area, spot samples have been conducted. A total of twenty-one (21) samples were collected and distributed as follows: eight (08) in the Ngalan site, eight (08) in the Nkolngok site and five (05) in the Oyack site [19,20]. This difference in the number of samples is justified by the intensity of activities in and around each site. Sampling was conducted between July-August during seasonal transition period (dry and rainy seasons). At a depth of between 10 and 40 cm, the samples taken (Figure 1) were put in labelled plastic bags and brought back to the laboratory following the procedure used [21].
Treatment of samples
In addition to the Trace Metal Elements (TMEs) that are the focus of this work, additional analyses are undertaken to better understand the physico-chemistry of the environment. Prior to the analyses, the soils are dried at 85 °C for 48 hours, then crushed in an agate mortar and sieved with a 0.080mm sieve to remove residues. Twenty-one samples were selected and analyzed at the Soil, Plant, Water and Fertilizer Laboratory following the methods used at the Agricultural Research Institute for Development in Nkolbisson. The pH and organic matter were determined. The analyses also included the determination of trace metal concentrations: Cadmium (Cd), Copper (Cu), Lead (Pb), Zinc (Zn), Iron (Fe) and Manganese (Mn). The method used to extract the TMEs was acid extraction (HNO3+HCl). After introducing 20g of soil into the Meyer Erlen, 90ml of HNO3 (69%) and 30ml of HCl (37%) are poured. The mixture is kept hermetically sealed for 1h then placed on a stirring table for 30 minutes and heated to 150 °C for 1h. After cooling, the mineralization is filtered at 0.45μm using a “Whatman” filter paper. The final volume is read with a UV visible spectrophotometer after preparation of the standard solutions.
Estimation of the intensity of the contamination risk
The intensity of the risk of soil contamination by trace metallic elements has been evaluated on the basis of three indexes, namely Enrichment Factor, Geo-accumulation Index, Pollution Index, and Statistical analysis.
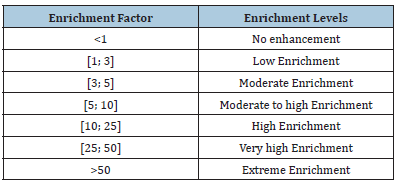
Enrichment Factor:[22] established a method in order to calculate the Enrichment Factor (EF). This parameter was employed to assess the degree of contamination and to understand the distribution of the variability, and its presence in the environment in trace amounts. Elements which are naturally derived have an EF value of nearly unity, while elements of anthropogenic origin have EF values of several orders of magnitude [23]. Following categories as stated by [24] are recognized below (Table 2).
Table 2:Classification of the enrichment factor.
Geo-accumulation index: The degree of contamination was estimated in relation to the continental crust values of [25]. This empirical index compares a given concentration to a normalized geochemical background. Its formula as following according to Equation 1.

Where Igeo = Geo-accumulation Index; log2= logarithm of base 2; n= element considered; C= concentration measured in the sample; B= geochemical background; 1.5= exaggeration factor of the geochemical background, whose function is to take into account the natural fluctuations of the geochemical background. [26] proposed a scale of values according to the intensity of the pollution (Table 3).
Table 3:Classes defined for the geo-accumulation Index (Muller G [26]).
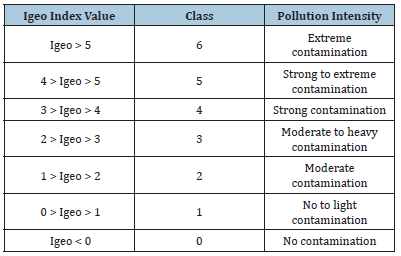
Igeo: Geo-accumulation Index.
Pollution index: The Pollution Index (PI) was calculated in order to determine the toxicity of the soils of the different sites in the area. Indeed, the PI is a criterion that allows evaluating the global toxicity of a contaminated soil. Thus, it can highlight a multielement contamination in the samples [27,28]. The PI is calculated from the average of the ratios of metal concentrations in the soil samples based on the guideline limit values. These limit values correspond to the tolerable levels of metal (TMEs) concentrations in soil according to the DPR standard [29]. The PI is determined by the following formula shown by Equation 2.

Statistical analysis: Statistical methods were used to complete the interpretation of the soil data. A Pearson correlation matrix was performed on the concentrations of TMEs determined in soils, plus those of iron and Manganese because of their abundance and importance in the environmental mobility of TMEs in the form of oxides and hydroxides [30]. Organic Matter (OM) concentration was included in this correlation due to the role of organic matter in the uptake of TMEs in terrestrial environments. This correlation was calculated for the data set resulting from the fusion of eight parameters: 4 TMEs, as well as two metallic elements Fe and Mn, plus OM and pH measured during this work.
Results and Discussion
The collection of waste is poorly organized and leads to spontaneous storage of them without prior study. Thus, landfills rub shoulders with industrial, agricultural and livestock activities. Moreover, landfills, organic fertilizers, livestock and fish farming waste and other runoff water inputs make leachates available, which are more or less loaded with polluting elements, constituting one of the sources of soil contamination. Due to the small variation in topography and poor drainage, the leachate will stay longer in the shallows and the absorbent complex will be saturated with chemical elements.
Physicochemical parameters
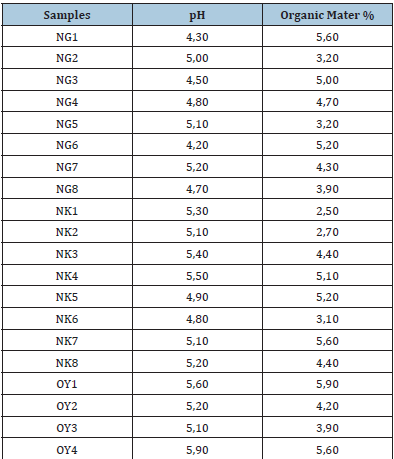
Table 4:Physico-chemical parameters of the investigated soils
pH : Hydrogen Potential. NG: Ngalan; NK: Nkolngok; OY: Oyack
The soils analyzed have an overall acidic pH between 4.2 and 5.9. The pH values show two trends depending on the samples. The first shows low pH values (pH<5). The second shows pH level slightly above the first (pH>5). These results show that the soil samples collected have generally acidic properties. NG6 shows the lowest pH value and OY4 the highest pH value in this series (Table 4). We observe also in Table 4 that, the carbon content varies between 3.20 and 5.90 %. Most have carbon contents between 3.10 and 4.70 %. Nkolngok site shows the lowest value (NK6) while Oyak site shows the highest value (OY1).
The results for pH and organic matter are presented in Table 2. The pH in the soils of the three sites ranges from 4.2 to 5.6. Furthermore, these values are similar to those obtained in the Yaoundé and Ebolowa soils, with values between 3.5 and 5.8 [15,31]. The acidity of a soil is due to a very slow evolution dominated by three major processes: biological activity, dissolution of rocks, soils and drainage [32]. The pH is a factor strongly influencing the content of TMEs in soils through sorption/desorption phenomena [33]. Indeed, the acidic pH favors the migration of metallic trace elements from the solid phase to the soil solution and then to the plant [34]. The pH values obtained are favorable to a high availability of TMEs in the environment. The lowering of the pH favors the mobility of the metallic trace elements (TMEs), in particular by the dissolution of metallic salts or the destruction of the retention phase. Conversely, the increase of the pH causes immobilization by formation of insoluble compounds or increase of the cationic exchange capacity [35].
The results show that the Organic Matter (OM) contents are between 2.5% and 5.9% in the four sites studied (Table 2). Averages to very high contents are the corresponding values [36]. The obtained OM values are close to those obtained in the soils of Endamdam in Ebolowa and Foto in Dschang, with values between 4.4 % and 7.7 % [37]. Indeed, organic matter participates effectively in the retention of TMEs that can be in an exchangeable form, or in the state of complexes in which, they are more fixed [38]. Its colloidal properties, its character as an element fixing substance and its chelating power, influence its role [39]. The high values of organic matter in the surface horizons come from the decomposition of the vegetal cover of the soil, the contributions of manures, composts as well as crop residues [40]. The increase in organic matter is accompanied by an improvement in soil structure, ease of water infiltration, and increased water holding capacity [41].
Trace metal concentrations
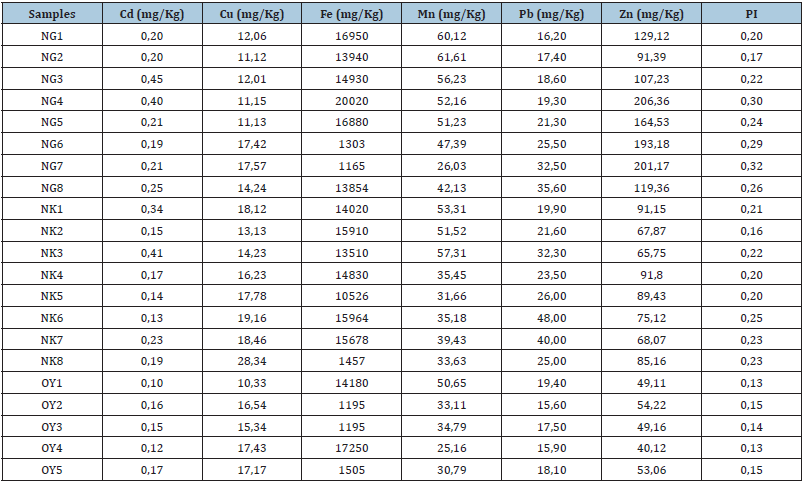
The results show that the values of trace metallic element concentrations in soils vary according ich of them. Table 5 shows the TME contents (in mg/Kg) of the analyzed soils. In the Ngalan soils, the measured values vary from 0.19 to 0.45mg/kg for cadmium (Cd), from 11.13 to 17.54mg/kg for copper (Cu), from 1165 to 16950mg/kg for iron (Fe), from 26.03 to 61.61mg/kg for manganese (Mn), from 16.20 to 35.60 mg/kg for Lead (Pb) and from 91.39 to 206.36mg/kg for zinc (Zn). For the Nkolngok soils, the contents are 0.13 to 0.34mg/kg for Cd, 14.24 to 28.34mg/kg for Cu, 1457.0 to 15910.00mg/kg for Fe, 31.66 to 57.31mg/kg for Mn, 21.60 to 48.00mg/kg for Pb and 65.75 to 91.15mg/kg for Zn. Finally, the values measured in Oyak soils vary from 0.12 to 0.19mg/kg for Cd, from 10.33 to 17.43mg/kg for Cu, from 1505.00 to 14180.00mg/kg for Fe, from 25.16 to 50.65mg/kg for Mn, from 15.60 to 18.10mg/kg for Pb and from 40.12 to 54.06mg/kg for Zn. The highest mean values are obtained with Fe followed by Zn, Mn, Pb, Cu and Cd in decreasing order (Table 5). We have the same trends in the Nkolngok and Oyak soils but the lowest value is obtained with Cd in these three sites.
Table 5:MTE concentration and PI values in the studied soils.
MTE: Metallic Trace Elements; PI: Pollution Index; Cd: Cadmium; Cu: Copper; Fe: Iron; Mn: Manganese; Pb: Lead; Zn: Zinc. NG: Ngalan; NK: Nkolngok; OY: Oyack.
The evolution levels of the TMEs in the soils of the study area and the pollution index are given in Table 5. TMEs contamination in soils is associated with a cocktail of contaminants rather than a single metal [42]. EF values are given in Table 6. I-geo values are given in Table 7. These values reflect the light contamination and the existence of moderate to high enrichment. Cd, Pb and Zn are the most important hazards. The enrichment factor values were used to define the enrichment levels for each MTE.
Table 6:Enrichment factor by TME in the studied soils.
EF: Enrichment Factor; Cd: Cadmium; Cu: Copper; Mn: Manganese; Pb: Lead; Zn: Zinc. NG: Ngalan; NK: Nkolngok; OY: Oyack.
Cadmium (Cd):Cd values in the studied soils vary from 0.12 to a maximum of 0.45mg/Kg. These values are higher than the estimated global baseline Cd value for surface soils of 0.3mg/ Kg. They are higher than those of Yaoundé soils, with values ranging from 0.2 to 0.5mg/Kg [15]. The EF values show moderate enrichment. The source could probably be the anthropogenic contribution of Cd in the soil. The presence of Cd in soils could be due to the use of compost inputs, plastics and fuels [43,44].
Copper (Cu):Copper levels in the soil samples ranged from 11.12 to 19.16mg/Kg. The levels found in the studied soils were lower than those of the soils in East and Adamawa in Cameroon, with values ranging from 27 to 291.6mg/Kg [45]. They are higher than those of Dschang soils, with values between 5 and 8mg/Kg. [46]. These values do not exceed the 100mg/Kg limit set by [47]. EF values show low enrichment in most samples. The presence of Cu in soils could be due to fertilizer use, welding alloys, landfills [48,49].
Lead (Pb):Lead levels in soil samples range from 16.20 to 48mg/Kg. It’s often associated with clay minerals, Mn oxides, Fe or Al hydroxides and organic matter. These concentrations are similar to those of soils from Yaoundé and Dschang in Cameroon, with values between 4.9 and 24mg/Kg [50]. The values obtained hardly exceed the limit content of 100mg/Kg set by [47]. EF values show high enrichment in most samples. Pb levels in soils could be explained by the use of input from atmospheric deposition, exhaust gases, fuels, solder alloys, old tires and batteries, metal-laden runoff from building roofs, decomposition and incineration of household waste [50,51].
Zinc (Zn):Zinc concentrations in the surveyed soils range from 40.12 to 206.36mg/Kg. The high level of zn in soils could be explained by the use of manure, slurry and some fertilizer materials, household waste [50,52]. These concentrations do not exceed the average concentration set by [47] with a value equal to 300mg/Kg. They are higher than the zinc concentrations in soils from the southeast of Ivory Coast, with values ranging from 42.1 to 59.99mg/Kg [53]. EF indicates high enrichment. The main sources of pollution may be industries, composted materials and agrochemicals such as fertilizers and pesticides in agriculture [54]. The high concentrations of Zn found in the studied soils, clearly suggest that one source is anthropogenic.
Estimation of the intensity of the risk of contamination in soils
This estimate is based on three indices: the enrichment factor, the geo-accumulation index and the pollution index.
Figure 2:Evolution of enrichment factors in soils.
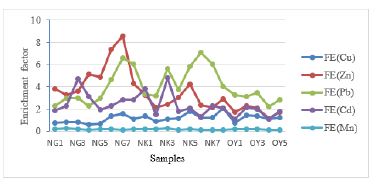
Enrichment Factor:The Enrichment Factor (EF) provides information on the increase in concentration of a chemical element in soils compared to a reference. The standard element used in this study is iron. The trace metals analyses have an EF > 0 in all samples. The EF in Copper varies from 0, 75 to 1, 58. The EF in Zinc varies from 1.16 to 8.58. The EF in Lead varies from 2.18 to 6.58. The EF in Cadmium varies from 0. 08 to 0.24 and finally The EF in Manganese varies from 0.08 to 0.24 in the studied soils (Table 6). Cd, Pb and Zn show EF values above unit. Figure 2 shows the evolution of enrichment factors in the soils.
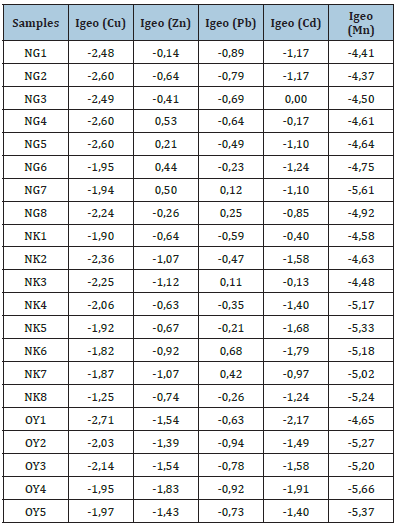
Geo-accumulation Index:Trace metals detected in soils have variable geo-accumulation indices. Table 5 presents the results of the geo-accumulation index (Igeo). Of the Trace Metallic Element analyses in the soils studied, Copper, Cadmium and Manganese show Igeo values below 0. Zinc and Lead show some Igeo values above 0. The Igeo in Copper varies -2.71 to 1.48. The Igeo in Zinc varies from -1.83 to 0.53. The Igeo in Pb varies from -0.92 to 0.68. The Igeo in Cd varies from -2.17 to 0.00 and finally The Igeo in Mn varies from -5.66 to -4.37 in the studied soils (Table 7). Figure 3 shows the evolution of enrichment factors in the soils.
Figure 3:Variation of the geo-accumulation index in soils.
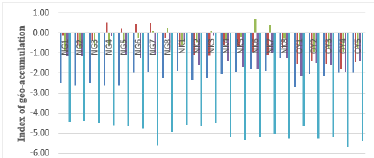
Table 7:I-geo in the studied soils.
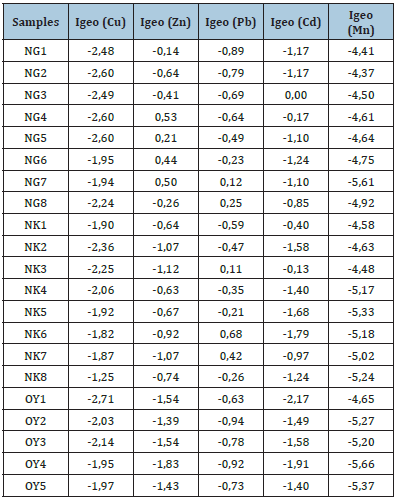
Igeo: Geo-accumulation Index; Cd: Cadmium; Cu: Copper; Mn: Manganese; Pb: Lead; Zn: Zinc. NG: Ngalan; NK: Nkolngok; OY: Oyack.
Pollution Index by metallic trace elements in soils:The Pollution Index (PI) was calculated in order to determine the toxicity of the soils of the different sites in the area. Indeed, the PI is a criterion that allows evaluating the global toxicity of a contaminated soil. The results show that the pollution index (PI) values in Ngalan soils vary from 0.17 to 0.32 depending on the site (Table 3). In Nkolngok soils, the PI values vary from 0.16 to 0.25. Finally, in the Oyak soils, the PI values vary from 0.13 to 0.15. All sampling sites have PI values below (Table 5).
Statistical analysis
A correlation matrix between TMEs (Cd, Cu, Zn, Pb), iron, manganese, Organic Matter (OM) and soil pH is performed. The Pearson correlation coefficients are also given and significant relationships are shown in bold (++ +perfect); (++acceptable); (+negatively perfect). Table 6 therefore presents the different possible correlations in the studied sites. Looking at Table 6, which is the result of the multivariate analyses, it can be seen that Cu, Pb and Zn are perfect correlated with each other for Ngalan site. Cd and Mn are perfect correlated with each other for Nkolngok. Cd, Mn and Fe are perfect correlated with for Oyak. The presence of one predicts the other.
It is therefore interesting to note that there is an acceptable correlation between pH and TMEs (Cd, Mn and Pb) for Nkolngok. It is also observed that pH is perfect correlated with Fe for Oyak. It is also noted that, pH is acceptable correlated with Cd, Mn and Pb for Nkolngok. We can therefore see that the presence of organic matter does not allow us to make predictions about the cause-andeffect relationships between the levels measured. We are under the influence of three very different sites (Table 8). The values of the EF are between 0.75 and 8.58 (Table 6). These results correspond moderate to high enrichment. The values of the enrichment factor higher than 1 reflect an anthropic origin in these elements. These contributions could come from the incineration of old tires and batteries, from the decomposition of household waste, from organic and chemical soil amendments, from fuels, from waste oils, from metal welding workshops. The correlations between the MTEs in the Ngalan and Nkolngok sites reflect common sources of anthropogenic inputs. These sources encountered are similar to those described in the soils of Yaoundé, Dschang and Ngaounderé by [15,50,55]. We noticed also that the concentrations of Cu and Cd do not dominate in soils when the pH conditions are very acidic [56].
The results show that metallic trace elements concentrations in soils vary depending on the metal element and the sampling site. The results are comparable to those of several authors that showed that total metallic Trace Elements (TME) levels in soils vary with soil type, metallic trace elements, and sources of contamination [57,58,59]. Zn is the metal element with the highest concentrations in the studied soils. High values of Zn concentrations in soil, compared to other elements, have also been reported by many authors [60]. Regardless of the element considered, the results show that the levels vary according to the sites and the rate of urbanization. The variation between horizons, within the same soil without any anthropogenic contamination, could be explained by several factors including textural differentiation, pH, organic matter content and iron and/or manganese content [61].
Conclusion
The results of the fieldwork show that in the vicinity of these lowlands, in addition to their colonization by the populations, various activities are carried out. According to these activities, the classification obtained distinguishes two classes of lowlands, namely: the class of intensely exploited sites (Ngalan and Nkolngok) dominated by agro-pastoral activities, garbage dumps, car garages, wood and coal factories and metal welding workshops, and the class of less exploited sites (Oyack and Nsen-Nlong) where only agriculture is practiced. The evaluation of the TME content shows a significant presence of Cd, Cu, Zn, Pb, Mn and Fe in the lowland soils. The calculation of EF and Igeo showed that the soils are enriched in TMEs. These TMEs would come partly from anthropogenic activities. Cd, Pb and Zn are slightly to moderately contaminating these soils.
Statistical analysis between TMEs, pH and OM allowed establishing positive and negative correlations between parameters. TME levels vary from lowland to another and are more concentrated in soils located near the road network, in garbage dumps and incineration sites, where activities such as agriculture, animal husbandry, metal welding and garages dominate. The soils of Ngalan and Nkolngok are the most impacted by metal pollutants. Those of Oyack and Nsen-Nlong do not present a great risk for the moment. In order to improve this work, research perspectives have been defined, in order to deepen the knowledge in the pedological and environmental field. For this purpose, it would be necessary to increase the number of samples and the depth to more than 40cm in order to determine the degree of contamination according to the pedological levels; To implement a similar study in other cities, and if there is pollution, to determine its precise origin in order to implement a global method of control and prevention.
References
- Tsegai D (2004) Effects of migration on the source communities in the volta basin of Ghana: Potential links of migration, remittances, farm and non-farm self-employment activities. University of Bonn, Economics and Technological Change, Germany.
- Bopda A, Awono J (2003) Urban and peri-urban agriculture in Yaoundé (Cameroon), Institutional Aspects. Final Report, p. 88.
- Nguegang P (2009) Urban and peri-urban agriculture in Yaoundé: Multifunctional analysis of a growing activity in a survival economy. Dissertation Thesis, Free University of Brussels, Belgium, p. 88.
- Lavigne DP, Boucher L, Vidal L (1995) Lowlands in humid tropical Africa: Farming strategies, agronomic constraints and development. In: Pichot JP, Sibelet N, Lacoeuilhe JJ, (Eds.), Fertility of the environment and farming strategies in the humid tropics, CIRAD, Montpellier, France, pp. 148-161.
- Gockowski J (1999) Intensification of horticultural production in the urban periphery of Yaoundé. In: Moustier P, Mbaye A, De Bon H, Guérin H, Pagès J (Eds.), Peri-urban Agriculture Sub-Saharan Africa, CIRAD, Montpellier, France, pp. 1-271.
- Bellenfant G (2001) Modeling the production of leachate in a household waste storage center: National Polytechnic Institute of Lorraine INPL, France, p. 492.
- Miquel M (2001) The effects of heavy metals on the environment and health. Parliamentary office for the Evaluation of Scientific and Technological Choices, Paris, France, pp. 23-24.
- Mathieu A, Baize D, Raoul C, Daniau C (2008) Proposal for regional references in ETM in soils: Their use in assessments. Environment, Risks & Health 7(2): 111-122.
- Baize D (1997) Total levels of metallic trace elements in soils. References and Interpretation Strategies. INRA Editions, Paris, France, pp. 1-410.
- Kouame IK, Gone DL, Savane I, Kouassi A, Koffi K (2006) Relative mobility of heavy metals from the Akouédo landfill and risk of contamination of the Continental terminal groundwater (Abidjan-Côte d'Ivoire). Africa Sciences 2(1): 39-56.
- Kao T, Khalid E, Abderrahim B (2007) Assessment of pollution in agricultural soils by wastewater from the city of Settat. Bulletin of the Institute of Sciences of Rabat 29: 89-92.
- Adam S, Edorh PA, Totin H, Koumoulou L, Aklikokou K (2010) Pesticides and heavy metals in drinking water, soils and sediments of the cotton belt of Gogounou, Kandi and Banikoara (Benign). International Journal of Biological and Chemical Sciences 4(4): 1170-1179.
- Dan-Badjo TA, Guéro Y, Dan LN, Tidjani AD, Ambouta KJ, et al. (2013) Assessment of soil contamination by metallic trace elements in urban and peri-urban areas of the city of Niamey (Niger). BioRessources Review 3(2): 82-95.
- Gong Q, Deng J, Xiang Y, Wang Q, Yang L (2008) Calculating pollution indices by heavy metal in ecological geochemistry assessment a case study in park Beijing. Journal of China University Geosciences 19(3): 230-241.
- Nguelieu CR (2017) Assessment of the risks of contamination with metallic trace elements (Pb, Cd, Zn) of urban market gardening sites in Yaoundé (Cameroon). Dissertation Thesis, University of Liege, Belgium, p. 64.
- Tehna N, Sababa E, Ekoa Bessa ZA, Etame, J (2019) Mine waste and heavy metal pollution in betare-oya mining area (Eastern Cameroon). Earth Sciences Research Journal 4: 167-176.
- Villiers JF (1995) Vegetation. In: Santoir C, Bopda A, (Eds.), South Cameroon Regional Atlas, ORSTOM, France, pp. 15-17.
- Segalen P (1967) The soils and geomorphology of Cameroon. ORSTOM, Bondy, France, pp. 137-187.
- EPA (1991) Removal program representative, sampling guidance. Soil, EPA 9360 1: 4-10.
- ISO (1993) Soils quality-sampling-part 2: Guidance on sampling techniques. ISO Standard 10381-3.1. Project of 06/04/93: 1-46.
- Ekoa Bessa AZ, Ngueutchoua G, Ndjigui PD (2018) Mineralogy and geochemistry of sediments from Simbock Lake, Yaoundé area (southern Cameroon): Provenance and environmental implications. Arab Journal Geosciences 11: 1-18.
- Simex S, Helz GR (1981) Regional geochemistry of trace elements in Chesapeake. Environmental Geology. 315: 32-33.
- Loska K, Wiechuła D, Barska B, Cebula E, Chojnecka A (2003) Assessment of arsenic enrichment of cultivated soils in southern Poland Polish. Journal of Environmental Studies 12(2): 187-192.
- Ekengele NL, Sadjo MS, Zame ZP (2016) Evaluation of the metal contamination of soils exposed to the incineration of car tires in the city of Ngaoundéré (Cameroon). Journal of Materials and Environmental Sciences 7(12): 4633-4645.
- Turekian KK, Wedepohl KH (1961) Distribution of the elements in some major units of the earth’s crust. Geological Society of America Bulletin 72(2): 175-182.
- Müller G (1969) Index of geo-accumulation in sediments of the Rhine River. Geology Journal 2: 109-118.
- Chon HT, Ahn JS, Jung MC (1998) Seasonal variations and chemical forms of heavy metals in soils and dusts from the satellite cities of Seoul. Environmental Geochemistry and Health 20: 77-86.
- Smouni A, Ater M, Auguy F, Laplaze L, El Mzibri, et al. (2010) Assessment of contamination by metallic trace elements in a mining area in eastern Morocco. Agriculture Notebooks 4(19): 273-279.
- Ye L, Lompo DJP, Sako A, Nacro HB (2020) Evaluation of the contents of metallic trace elements in soils subjected to the contribution of solid urban waste. International Journal of Biological and Chemical Sciences 14(9): 3361-3371.
- Sun Y, Zhou, Xie X, Liu R (2010) Spatial, sources and risk assessment of heavy metal contamination of urban soils in typical regions of Shenyang. J Hazard Mater 174(1-3): 455-462.
- Heepngoen P, Thoumazeau A, Renevier MS, Sajjaphan K, Gay F, et al. (2021) Relationships between physico-chemical, biological and functional approaches for soil quality assessment. A case study along a gradient of disturbance. European Journal of Soil Biology 104: 11.
- Baize D, Deslais W, Saby N (2007) Contents of eight trace elements (Cd, Cr, Cu, Hg, Ni, Pb, Se, Zn) in agricultural soils in France. Result of Data Collection at the National Level, Final Report, p. 84.
- Draszawka-Bozan B (2017) Effect of pH and soil environment. World News of Natural Sciences 8: 50-60.
- Baize D (2009) Metallic trace elements in soils. Geochemical background, natural pedogeochemical background and typical agricultural levels: Definitions and uses. Mail Environment INRA 57: 63-72.
- Karna RR, Luxton T, Bronstein KE, Redmon JH, Scheckel KG (2017) State of the science review: Potential for beneficial use of waste by-products for in situ remediation of metal-contaminated soil and sediment. Critical Reviews in Environmental Science and Technology 47(2): 65-129.
- Memento de l’agronomiste (1993) Ministry of cooperation and development. (5th edn), Horizon IRD, p. 1635.
- Moundjeu ED, Temgoua E, Tamfuh PA, Vounang JG, Kabiwa JPY, et al. (2021) Characteristics, fertility status and fertility capability classification of steep slope soils of the Dschang Cliff (Cameroon Western Highlands). Journal of Environment Protection Sciences 9(7): 164-179.
- Herold N, Schöning I, Michalzik B, Trumbore S, Schrumpf M (2014) Controls on soil carbon storage and turnover in German landscapes. Biogeochemistry 119: 435-451.
- Brady NC, Weil RR (2001) The nature and properties of soils. (14th edn), Pearson Prentice Hall, New Jersey, USA, pp. 621.
- Duxbury JM, Smith MS, Doran JW (1989) Soil organic matter as a source and sink of plant nutrients. In: Coleman DC, Oades JM, Uehara G, (Eds.), Dynamics of Soil Organic Matter in Tropical Ecosystem, University of Hawaii Press, Honolulu, USA, pp. 33-67.
- Cerri CEP, Bernoux M, Chaplot V, Volkoff B, Victoria B, et al. (2004) Assessment of soil property spatial variation in an Amazon pasture: Basis for selecting an agronomic experimental area. Geoderma 123(1-2): 51-68.
- Raymond, A, Wuana, FE, Okieimen (2011) Heavy metals in contaminated soils: A review of sources, chemistry, risks and best available strategies for remediation. International Scholarly Research Notices 2011: 20.
- Fardeau JC (2000) Bioavailability and mobility of potentially toxic elements. Concepts: Engineering-EAT, p. 14.
- Houot S, Currency P, Deschamps M, Benoit P, Bodineau G, et al. (2009) Composting and recovery by agriculture of urban waste. Agronomic Innovations 5: 69-81.
- Sababa E, Ndong BF, Tehna N, Kouamelan AN, Ndjigui PD (2018) Evaluation of metallic trace elements (Cr, As, Pb, Zn and Cd) in surface waters of the Lom watershed, East Cameroon: Impact of semi-industrial gold mining. Science, Technology, and Development 20: 1-10.
- Temgoua E, Ntangmo TH, Pfeifer HR, Njine T (2015) Contents of major elements and trace elements in the soils and some vegetable crops in the city of Dschang-Cameroon. African Crop Science Journal 23: 35-44.
- AFNOR (2005) Soil quality. Compendium of French Standards.
- Kabata P (2004) Soil-plant transfer of heavy metals-An environmental issue. Geoderma 122(2-4): 143-149.
- Getaneh W, Alemayehu T (2006) Metal contamination of the environment by placer and primary gold mining in the adola region of southern Ethiopia. Environmental Geology 50: 339-352.
- Temgoua E, Ngnikam E, Dameni H, Kameni GS (2014) Valorization of household waste by composting in the city of Dschang, Cameroon. Tropicultura 32(1): 28-36.
- Brignon, JM, Malherbe, L, Soleille, S (2005) The priority hazardous substances of the framework directive on water technical and economic data sheets. Final report, p. 64.
- Colin F, Le Guillou JF (1980) Research into the origin and concentration mechanism of heavy metals in urban sewage sludge, with a view to defining preventive methods. Ministry of the Environment/Soil Committee, p. 36.
- Keumean KN, Siaka BB, Gbombelé S, Nagnin S, Metongo B (2013) Concentration of heavy metals in sediments from the estuary of the Comoé River in grand-bassam (South-East of the Côte d' Ivory). Journal of Applied Biosciences 6: 4530-4539.
- Zhang W, Jiang F, Ou J (2011) Global pesticide consumption and pollution: with China as a focus. Proceedings of the International Academy of Ecology and Environment Science 1(2): 125-144.
- Oumar B, Ekengele NL, Balla OAD (2014) Assessment of the level of pollution by heavy metals in Lakes Bini and Dang, Adamaoua Region, Cameroon. Africa Science 10(2): 184-198.
- Rieuwerts JS, Thornton I, Farago ME, Ashmore MR (1998) Factors influencing metal bioavailability in soils: Preliminary investigations for the development of a critical loads approach for metals. Chemical Speciation & Bioavailability 10(2): 61-75.
- Baize D (2000) Total contents of "heavy metals" in French soils, general results of the ASPITET program. Mail Environment INRA 39: 39-54.
- Baize D (2009) Trace elements in soils and the risks of transfer to plants. The soil, pp. 102-105.
- Hodomihou NR, Feder F, Masse D, Agbossou KE, Amadji GL, et al. (2016) Diagnosis of contamination of peri-urban agrosystems in Dakar by metallic trace elements. Biotechnology, Agronomy, Society & Environment 20(3): 1-11.
- Baize D, Saby N, Deslais W, Bispo A, Feix I (2006) Total and pseudo-total analyzes of trace elements in soils: Main results and lessons from a national collection. Soil Study and Management 13(3): 181-200.
- Schoonover JE, Crim JF (2015) An introduction to soil concepts and the role of soils in watershed management. Journal of Contemporary Water Research & Education 154(1): 21-47.
© 2022 © Natanael T. This is an open access article distributed under the terms of the Creative Commons Attribution License , which permits unrestricted use, distribution, and build upon your work non-commercially.
 a Creative Commons Attribution 4.0 International License. Based on a work at www.crimsonpublishers.com.
Best viewed in


.jpg)


 Editorial Board Registrations
 Submit your Article
 Refer a Friend
 Advertise With Us
.jpg)


.jpg)


.bmp)
.jpg)
.png)
.jpg)


.jpg)


.png)

.png)


.png)


