
- About Us
- Information
-

The Author ensures that the research has been conducted responsibly and ethically with adherence to all relevant regulations. read more..
- For Authors
- For Reviewer
- Manuscript Guidelines
- Membership
- Publication Ethics
-
- Journals
- Reprints
- e-Books
- Videos
- Policies
- Contact Us
 COVID-19
- Submissions


Full Text
Environmental Analysis & Ecology Studies
Quality Characterization and Assessment of Coastal Water of Karachi, Pakistan
Asia Neelam*
Pakistan
*Corresponding author: Asia Neelam, Pakistan
Submission: June 28, 2021; Published: April 14, 2022

ISSN 2578-0336 Volume9 Issue5
Abstract
The study was undertaken to find out the possible pollution of Karachi coastline as it’s under the grip of multifarious pollution. Water quality was assessed using the parameters Biological Oxygen Demand (BOD5), Chemical Oxygen Demand (COD), Dissolve Oxygen (DO), Oil and Grease, Phosphate, Total Kjeldahl Nitrogen (TKJ), pH, salinity and Heavy metal (Lead, Arsani, Nikal). pH and salinity were recorded in the range of 7.2- 7.8 and 33-38% in all the targeted samples. Significant high value of COD and BOD5 recorded in all the samples especially Ghizri creek (306±0.8mg/l) and Hawskbey (1216±7.3mg/l). The concentration of heavy metals found in order of following Ni > pb > As. Showing that creek area has high amount of metal concentration that open sea. Permisible amount of Dissolved oxygen (DO) were recorded in all the samping area (4.1-5.3mg/l). The lowest amount were recorded in sea view (4.1±0.1mg/l). In cumulative results of water quality, the level of pH ranged between (7.8-7.2mg/l), highest value have been found in Paradise point (7.8±0.05). Concentration of oil and grease were detected in the range of (8.1 -10.6mg/l), with high value measured at Sandspit (10.6±0.02mg/l). The study showed the concentration of Phosphorus and Total Kjedal nitrogen (TKN) focus on the available nitrogen were in the range of (1.1-2.7mg/l) and (71-75mg/l) respectively. Highest amount of phosphus detected in the sample of Hawskbey (2.7±0.13mg/l) and TKN recorded in Ghizri creek site (75±0.7mg/l). The results justified the current situation of Karachi coastline responsible for the ecological imbalances and loss of biodiversity in that areas. To stop these imbalances administration should pass anti-pollution law for beaches. Installation of treatment plant to stop hazardous waste pollution will also be effective in this regard
Keywords: Coastline; Pollution; Creeks; COD and BOD5
Introduction
Pakistan endowed with the diversified and long coastal area which constitutes a key role in the economy of Pakistan. The coastal area of Karachi starting with Hub River outfall and ends with the Korangi creek. Land-based activities such as industries, agriculture and Oil spills from oil tankers and cargo ships have widely contributed to degrade the quality of sea water. According to the estimate Karachi city produce 300 million gallon water each day and this untreated wastewater entirely received by the coastal areas, creeks and mangrove system. The Movement of wind and tidal flushing are the two main factors to make the waste enter the open sea from Karachi harbor, korangi and Ghizri creek [1,2].
Coastal environment considers as the universally important ecosystem due to its biological richness [3]. As a matter of marine pollution and public health concern water quality of an open sea has now become an important issue all over the world. Rapid industrialization and discharge of untreated wastes along river system and coastal areas has brought a substantial increase in marine pollution [4]. Contamination of open sea water not only diminishes the ecosystem community, but they may interference the human activities, i.e. swimming, bathing and other recreation [5,6].
Municipal and industrial wastewater discharge from Layari and Malir rivers constitutes a constant polluting source. The heavy polluted discharge without any treatment is responsible for serious environmental implications, for instance, the spawning area for the fish’s nursery are critically affected by the toxic pollutants [7-9]. Azis et al. [10] reported the water quality of San Andres island that have been affected by the direct discharge of sewage water. He suggests the increase in nutritional enrichment of coastal water and microbial contamination by waste effluent. Kanu & Achi [11] find out the alarming pollution in Nigeria river due to agriculture and industrial runoff.
Heavy metal contamination in coast is a particular concern Jilani [12] reported the elevated levels of heavy metals (Zn, Mn, Fe, Cu, Ni and Pb) in Karachi costal water. She highlight the metal concentration was due to Malir and Lyari river. However, her finding suggest the fish Harbour of Karachi was more polluted compared with open sea. Studies conducting by Zaqoot et al. [13] shows the same result i.e. level of pollution decreased from the Karachi habour to the open sea. Alamgiir et al. [14] reported the quality of Korangi creek water he findout heavy metals level in following order Pb>Cu>Cr>Ni>Zn>As. The reflected update of water quality is alarming the concentration may deposit to the sediments or could affect the aquatic environment by bioaccumulation and bioassimilation. Estimation of heavy metal in west wharf Karachi fish harbor Estuary sediments indicates high metal concentration Pb 930- 1230mg/kg, Cd 987-1240mg/kg, Cr 428-706mg/kg, Zn 1260- 1410mg/kg and Hg 118-242mg/kg) [15]. Coastal area of china also encounter with heavy metal pollution scientist found evaluated amount of Fe, Cr, Cd, Ni, Mn and Pb. Further investigation reveals bioaccumulation of heavy metals on fishes and benthic bivalves in Laizhou Bay [16,17]. Assessment of heavy metal at Coast sediments of Aqaba Gulf Egypt states the presence and distribution of Fe, Mn, Zn, Ni, Co, Cr, Cu, and Cd. In the beach of the Sinai significant amount of Hg (14.938ng/g) measured. Samples collected from the coast of Egyptian Red Sea shows results in decreasing order Fe > Mn > Zn > Cr > Ni > Pb > Cu > Cd [18,19]. Previous studies supported that the coast of Karachi loaded with high organic pollutants and heavy metals concentration.
However, the effluent not only affecting the health, but also source environmental and socio-economical loses [20,21]. It has been found that the effluent not only progressively worse the water quality, but they may also responsible to the outbreak of acute infections and severe illness like dermatitis, Gastroenteristis issues and pulmonary illness [5,22-25]. Pollution in marine provides a favorable environment to compete and fill out. Shaheen et al. [2] reported the prevalence of Escherichia coli, streptococcus anginosus and Vibrio alginolyticus as a dominate species in the water of Korangi, Ghizri and Chinna Creek. Neelam et al., (2018) enlist the high incidence of Bacillus spp, Escherichia coli, Staphylococcus aureus and Pseudomonas aeruginosa. Janelidz et al. 2011 reported the prevalence of Vibrio bacteria, and Escherichia coli in black sea. In this assessment objective was to examine the pollution load through the selective parameters in the coastal environment of Karachi. We are hoping the study findings will help concerned authorities and regulation body to controlling the marine pollution by reduce and preserve the marine nature resource.
Material and Methods
Sample location
In this reaserch work samples are collected from the Costal area of Karachi. Presently the coast of Karachi is highly polluted. A total number of six location were selected for the assessment of pollution in open water or in creek water. All the samples sites are located in Figure 1.
Figure 1: Mape showing the study area.

Sample collection and analysis
Clean glass bottles of 1000ml were used to withdraw the samples. Salinity, pH and DO were analysis on site, the subsequent sample for further parameter analysis transported to the Institute of Environmental Studies, University of Karachi. Preservation of samples were done by the prescribe standard protocol [26].
The water sample of Coastal area were analyzed for Biological Oxygen Demand (BOD5), Phosphate, Chemical Oxygen demand (COD), Dissolved Oxygen, salinity, pH, Oil and grease, Total Kjeldahl nitrogen (TKN) and Heavy metal parameters (As, Pb and Ni).
pH and salinity
pH of the sample was measured by using ph portable meter (Model-220) and salinity was measured by using INOLAB WTW meter.
Determination of Total Phosphate
Total phosphate in the samples was determined by processing the filtered sample with concentrated 11N H2SO4 with 0.4gram of solid aluminum persulphate. Then the mixture were disgested in an autoclave at 15psi for half an hour.
After digestion the sample was filtered and treated with the mixture of reagent (H2SO4, antimony potassium tartarate, ammonium molybdate solution and ascorbic acid). Before the adding of this reagents the pH of filtered was Adjust to 7. The results of phorusphose were calculated by colored complex readed in Uv spectrophotometer at 750nm [27].
Determination of oil and grease
The method used to the determination of oil and grease in water is n-hexane method. A significant amount of sample were treated with HCl to acidified at pH2 and hexane used as solvent. The samples was kept in shaking water bath for overnight period. Next days by using separatory funnel hexane layer was separated and amount of oil and grease extracted in hexane was estimated by granimetric method [27].
Dissolved Oxygen Measurement
The amount of Dissolved oxygen in sea water were determined using HACH sension 156 multiparameter DO meter. It is noted by immersed the probe in sample to the mark depth and ensured that the sufficient sample movement across the probe sensing element done.
Determination of Total Kjeldahl Nitrogen (TKN)
Sampling digestion: An adequate amount of sample (50ml) was carefully transferd into Kjeldahl apparatus mixed with Mercuric sulphate and potassium sulphate solution. The sample in the flask allowed to heat on a low flame till it become colorless or pale yellow. The suspension of digested sample was made by the filling 30.0ml distilled water. After this sample is distilled by transferred to kjeldahl apparatus with 10ml sodium thiosuphate and NaoH. The sample was distilled and collected in Nessler’s tube containing 5ml boric acid solution. Finally, the distillate was allow to cool and diluted upto 50ml with distilled water.
Procedure of Titration: The samples after diluted procedure were titrated with 0.02N sulfuric acid follow by the few drops of mixed indicator (2 parts of 0. 2% Methyred and 1 part of 0.2% Methylene blue in 95% Ethanol) matching the end point against a blank containing the same volume of distilled water and boric acid solution and calculating by using the formula describe below [27].
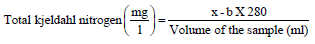
Where,
x = Volume of 0.02N H2SO4 ( Standard solution) added in titrating the water sample.
B = Volume of standard 0.02N H2SO4 used in titrating the blank.
Heavy metal analysis Parameters
In laboratory, Significant amount of sample were dried at constant weight to remove water. 5ml of dried sample was transferred to a pre-weighted china dish and digested with concentrated nitric acid under the fuming hood. The digestion was continoued till the colour of sample become transparent. 10ml of 2% HNO3 acid were added into the digest sample followed by deionized water. After this Sample was filtered through whatman filter paper of 0.45mμ pore size. Heavy metals such as As, pb and Ni in were detected using (Perkin Elmer-3100) Atomic Absorption Spectrophotometer [28].
Chemical Oxygen Demand (COD)
COD was determined by dichromate reflux method using HACH COD reactor. Sample of amount 2ml diluted was refluxed for 2 hour with H2SO4, 0.025N K2CrO4, Ag2SO4 and reagent and to find out the consumption of K2CrO4.The remining reagent was then titrated against standard 0.1N ferrous ammonium sulphate solution using ferroin indicator as per APHA [27].
Biological Oxygen Demand (BOD5)
300ml of samples kept in BOD bottles by adding 2ml of MnSO4 and Alkail-Iodide azide solution. Shake the bottle by inverting the content. Kept the bottles for 15 minutes to settle down the precipitation. To dissolved the precipitation 2ml of sulfuric acid (Conc) added in bottle. Withdraw 200ml sample in flask and titrated against 0.025N NaS2O3 by using 2-3 drops of starch solution as an indicator.
Statistic Analysis
Cluster analysis: Cluster analysis (Hierarchical clustering) was applied to identify and organized large different water quality parameters data into groups on the bases of the similarities, dissimilarities and characteristics [29]. Cluster analysis performed according to the Ward algorithmic method. Results are shown in the formed of dendrogram where procedures in the hierarchical clustering solution and values of the distances between clusters (squared Euclidean distance) are represented as a similarity measurement [30].
Result and Discussion
Coastal water is one of the important natural resource for any country. Previously a number of worst events have been hit on the coastal sites of Karachi which continuously deteriorate the quality of water. Effluent from industries and municipal sewage water accounts major pollution. According to the study of Mashiatullah et al. [31] in addition to the inorganic pollutant 1,500 tons of BOD are regularly dumped into the sea by industries. Lyari [1] Malir river are the two mainstream which dump industrial effluents and domestic sewerage.
Figure 2: Distribution of pH along coastal area.

Figure 3: Percentage of salinity in coastal water samples.

In this study all the samples were analyzed for the Biological Oxygen Demand (BOD5), Chemical Oxygen Demand (COD), Dissolve Oxygen (DO), Oil and Grease, Phosphate, Total Kjeldahl Nitrogen (TKJ), pH, Salinity and Heavy Metal (Lead, Arsani, Nikal). Table 1 states all the descriptive results of the targeted parameters. The pH and salinity of all the samples range between 7.2-7.8 and 33- 38% (Figure 2 & 3). The highest pH and salinity is recorded at Paradise point. The study conducted by Zaqoot et al. [13] reported 7.75 pH level of Ghizri creek due to the korangi industrial effluent. Same pH was reported by Mashitullah et al. [31] from the waste water of layari river (Figure 4). During the study highest BOD and COD were found in the samples of Ghizri creek (Figure 5 & 6), highest BOD accountes the organic decomposition of untreated sewage waste and COD value attributes the accumulation of toxic waste in Ghizri creek area (Figure 5 & 7). The permissible limit according to NEQs for being 200mg/L for industrial discharge and 80mg/L for domestic discharge, Whereas for COD the value is 400mg/L [32]. All the samples were recorded as an elevated value than permissible limit. It may be due to the fact that along with Ghizri and Korangi creek, coastal water body may also contaminate from the nearby catchment. Jin et al. [33] states that there is no direct relationship were present between COD and BOD in seawater samples.
Figure 4: Station wise varation of Heavy metals on different sample sites.

Figure 5: Station wise varation of Heavy metals on different sample sites.

Summary of metals analysis are deplicted in Table 1 reveals high amount of Pb in all the sampling sites and it may also be noted that among all the subjected heavy metals the concentration of Lead (Pb) are not in the permissible limit of NEQS (Figure 4). The lowest amount of Pb were recorded in site of Paradise (0.19±0.09) and higest in korangi creek (3.5±0.6mg/l) followed by sea view (7.5±0.05). These higest concetration of Pb is associated with the high pollution load in lyari and malir river dump into the open sea. Paradise which is far aways from these sites may have the reason of low Pb concentration in comparison to other sites. Study conducted in 2014 reported 0.001mg/l of lead at the site of Sandspit and in current research this level reached to 1.8mg/l [12] The possible source of pb in the water could be the fuel using to operate fishing vessel. Lead is a potential concern of aquatic environment. According to the Australia and New Zealand (2000) marine water quality guidelinethe concentration of lead should be 4.4μg/l for the spiece protection. Research finding highlight the accumulation of heavy metals in marine birds as they being consume fishes from creeks [32,34,35].
Table 1: Descriptive results of physico-Chemical parameters of Coastal water.

TKN : Total Kjeldahl Nitrogen (mg/l)
*indicates the Value is mg/l
Figure 6: Dissolve Oxygen level at different sample sites.

Figure 7: Concentration of COD estimated at coastal water samples.

Figure 8: Total Oil and Grease detecting in coastal water.

Oil pollution is one of the main contributors to enhance pollution in karachi sea. Currently coast of Karachi not seems to be highly polluted by oil and grease. In aquatic environment they are always unacceptable in any amount. Evaluation study shows about 15-20,000 tons of oil was unrestricted released annually into Karachi Harbour and adjacent water bodies connected with it through Manora channel (United Nation Economic and Social Commission for Asia and the Pacific, 1996). Oil film formatted above the water surface may reduce the amount of dissolved oxygen and affect the marine biota. The range of oil and grease detected in Karachi coast were (7.2 to 10.6mg/l) (Figure 8). The significant amount of petroleum in water bodies can cause an immediate rise in the BOD5 level due to the degradation of complex hydrocarbon compound in open sea. However the complexity and rate of biodegradation of hydrocarbon dependents on the composition of oil and petroleum products [36]. The results of Dissolved Oxygen (DO) comparatively low in all the samples of Karachi sea water. The lowest amount of DO were recorded in the sea view sample (4.2mg/l ) due to the high amount of organic load being discharged in that area from malir river and lyari river (Figure 6). Organic matter in the water body may also responsible for depletion of DO (Table 2).
Table 2: Mean characteristics of the group and sub-groups of sampling sites.

Figure 9: Phosphate concentration at different station.

Figure 10: Estimated concentration of Total Kjeldahl nitrogen at located samples.

Although the DO concentration of all the samples is under water quality standard (3.5mg/l) [12]. According to WHO guideline (2011) DO level greater than 6 indicates pollution and cannot be used as domestic purpose [37]. The highest DO recorded in the sample of Hawskey bay (5.3±0.05). Data accumulated on coastal dissolved oxygen indicated that the sea water of under observation area is well oxygenated. The Dissolved Oxygen value found along the Karachi coast was similar to the results found by Zaqoot et al. [13].
Organophosphate consider as a important phosphorus species in sea water. Nitrogen in the form of Nitrate is the primary form of fixed dissolved inorganic nitrogen assimilated by marine animals [38]. Ammonia and organic nitrogen is the cummulatively called Total Kjedal nitrogen (TKN). These both nutrient are responsible for enrichment. The concentration of Phosphorus and Total Kjedal nitrogen (TKN) focus on the available nitrogen were in the range of (1.1-2.7mg/l) and (71-75mg/l) respectively (Figure 9 & 10). Among all the samples Korangi creek has been identified for high amount of both the parameters in water. Highest amount of phosphus detected in the sample of Hawskbey (2.7±0.13mg/l) and TKN recorded in Ghizri creek site (75±0.7mg/l). Which represent the input and use of inorganic fertilizer in nearby area of Korangi and flushing of organic matter .In general, an excess of these nutrients leading to eutrophication and primary productivity of these sites [39,40].
Figure 11: Hierarchical dendogram of sampling location area.

The function of Cluster analysis (Hierarchical clustering) was applied to identify and organized large different water quality parameters data into groups on the bases of the similarities or common characteristics. Results are shown in a dendrogram (Figure 11) where procedures in the hierarchical clustering solution and values of the distances between clusters (squared Euclidean distance) are represented. Basically two graphs are formed in the dendrogram [41-43]. Group I comprises of 5 sites while group II comprises of a single site. In group I there are two Sub-groups , Group Ia and group Ib. Group Ia includes focus sites while group Ib comprises of a single site. Cluster of group II confirms the pattern with higest level of pH and lowest TKN. The sample loction belong to II represents the single sample and indicates high pollution load. The largest group of sampling location belong to sample location (4,6,2,3,5) ratify the highest level of TKN followed by COD. Ib correlated one sample site and indicates the significant amount of Pb, phosphorus and low oil and grease. Group of Ia attributed as site (4,6,2,3) high oil and grease, BOD, and COD.
Conclusion
The mentioned above changes indicates the alarming situation of water body that may contribute as a factor to deteriote the costa ecosystem. In the present case there is no apparent and the major source of industrial waste at the vicinity of sample collection sites. However, untreated domestic wastewater from the nearby settlement finds its way to these sites. The quality of untreated sea water is not high that could significantly affects the seawater quality.
The high metal pollution in the sea water may couse adverse affect on marine organism leads to effect food chain. Apart from the governmental steps public participation is important to take some hygenic steps and avoid littering on beaches as these water bodies are frequently crowded place on weekend and holidays. To stop these imbalances admistration should pass anti-pollution law for beaches. Installation of treatment plant to stop hazardous waste pollution will also be effective in this regards.
References
- Beg MAA, Mohammad SN, Yousuf Zai AHK (1975) Industrial effluents, their nature and disposal in Karachi region. Part 1: Survey of the Pollution Lyari River. Proc Pakistan Acad Science 12: 125-131.
- Shaheen A, Baig SA, Kazmi US (2016) Microbial flora isolated from polluted and non-polluted coastal waters of Karachi. Pak J Bot 48(4): 1703-1708.
- Costanza R, d’Arge R, de Groot R, Farber S, Grasso M, et al. (1997) The value of the world’s ecosystem services and natural capital. Nature 387(6630): 253-260.
- Sundaramanickam A, Sivakumar T, Kumaran R, Ammaiappan V, Velappan R (2008) A Comparative Study of Physico-Chemical Investigation along Parangipettai and Cuddalore Coast. Journal of Environmental Science and Technology 1(1): 1-10.
- Shuval H (2003) Estimating the global burden of thalassogenic disease-human infectious disease caused by wastewater pollution of the marine environment. J Water Health 1(2): 53-64.
- Fontenelle TH, José Antonio BN, Estefan MF (2015) Water quality along the Alagoas State Coast, Northeast Brazil: Advocacy for the coastal management. Journal of Integrated Coastal Zone Management 15(4): 559-567.
- Singh KP, Gupta S, Rai P (2014) Investigating hydrochemistry of groundwater in Indo-Gangetic alluvial plain using multivariate chemometric approaches. Environ Sci Pollut Res 21: 6001-6015.
- Kumar P, Kaushal RK, Nigam AK (2015) Assessment and management of Ganga river water quality using multivariate statistical techniques in India. Asian J Water Environ Pollut 12(4): 61-69.
- Bhutiani R, Khanna DR, Kulkarni DB, Ruhela M (2016) Assessment of Ganga river ecosystem at Haridwar, Uttarakhand, India with reference to water quality indices. Appl Water Sci 6: 107-113.
- Azis A, Jose Ernesto MP, Brigitte G (2017) Rapid assessment of coastal water quality for recreational purposes: Methodological proposal Patricia. Ocean & Coastal Management, pp. 1-9.
- Kanu I, Achi OK (2011) Industrial effluents and their impact on water quality of receiving river in Nigeria. J Appl Tech in Envir Sani 1(1): 75-86.
- Jilani S (2016) Present pollution profile of Karachi Coastal waters. Journal of Coastal Conservation 22(9): 1-8.
- Zaqoot HA, Shaukat HK, Abdul KA, Khadija Q (2009) Assessment of water quality in the coastal environment of Karachi Bordering Northern Arabian Sea. Journal of Flood Engineering 1(1): 5-19.
- Alamgir A, Moazzam AK, Shahid Shaukat S, Kazmi JH (2018) Impact of indiscriminate disposal of untreated effluents in Korangi creek, Karachi, Pakistan. Applied Water Science 8: 155.
- Nergis Y, Sharif M, Chaudhry AF, Hussain A, Butt AJ (2012) Impact of Industrial and Sewage Effluents on Karachi Coastal Water and Sediment Quality. The Middle East Journal 11(10): 1443-1454.
- Liu H, Guijian L, Zijiao Y, Meng G, Shanshan W, et al. (2019) Occurrence, potential health risk of heavy metals in aquatic organisms from Laizhou Bay, China. Marine Pollution Bulletin 140: 388-394.
- Liu J, Cao L, Dou S (2017) Bioaccumulation of heavy metals and health risk assessment in three benthic bivalves along the coast of Laizhou Bay, China. China Mar Pollut Bull 117(1-2): 98-110.
- Youssef DH, El Said GF (2011) Assessment of some heavy metals in surface sediments of the Aqaba Gulf, Egypt. Environ Monit Assess 180(1-4): 229-242.
- Younis AM, Ismail IS, Mohamedein LI, Ahmed SF (2015) Spatial variation and environmental risk assessment of heavy metal in the surficial sediments along the Egyptian Red Sea coast. Catrina The International Journal of Environmental Sciences 10(1): 45-52.
- Hussain Z, Chaudhry RM, Zuberi FA, Sharif Q (1996) Contaminants and the Soil Environment in Pakistan. Contaminants and Soil Environment in the Australasia-Pacific Region Dordrect 33: 1507-151.
- von Glasow R, Jickells TD, Baklanov A, Carmichael GR, Church TM, et al. (2013) Megacities and large urban agglomerations in the coastal zone: Interactions between atmosphere, land, and marine ecosystems. AMBIO 42: 13-28.
- Craun GF, Calderon RL, Craun MF (2005) Outbreaks associated with recreational water in the United States. Int J Environ Health Res 15(4): 243-262.
- Santoro AE, Boehm AB (2007) Frequent occurrence of the human-specific Bacteroides fecal marker at an open coast marine beach: Relationship to waves, Tides and traditional indicators. Environ Microbiol 9(8): 2038-2049.
- Bauer M, Hoagland P, Leschine TM, Blount BG, Pomeroy CM, et al. (2010) The importance of human dimensions research in managing harmful algal blooms. Front Ecol Environ 8(2): 75-83.
- Coldford JM, Schiff KC, Griffith JF, Yau V, Arnold BF, et al. (2012) Using rapid indicators for enterococcus to assess the risk of illness after exposure to urban runoff contaminated marine water. Water Res 46(7): 2176-2186.
- APHA (American Public Health Association) (1998) Standard methods for the examination of water and wastewater. 20th (edn), Washington DC, USA.
- APHA (2005) Standard methods for the examination of water and wastewater. 21st (edn), Washington DC, USA.
- FAO Report (1975) Manual method of aquatic environment research Part 1. method for detection, measurement and monitoring of water pollution.
- Wei M, Toth Z, Wobus R, Zhu Y (2010) Initial perturbations based on the Ensemble Transform (ET) technique in the NCEP global operational forecast system. Tellus 60A: 62-79.
- Otto M (1998) Multivariate methods. In: Kellner R, Mermet JM, Otto M, Widmer HM (Eds), Analytical Chemistry. Wiley-VCH, Weinheim, Germany.
- Mashiatullah A, Qureshi RM, Ahmed N, Khalid F, Javed T (2009) Physico-Chemical and Biological water quality of Karachu Coastal water. The Nucleus 46(1-2): 53-59.
- Shahzad A, Khan AM, Shaukat SS, Ahmed W (2009) Chemical pollution profile of Rehri Creek area, Karachi (Sindh). J Chem Soc Pak 31(4):
- Jin XL, Jing M, Chen X, Wang XR, Frank S, et al. (2009) A study on the relationship between COD and BoD in coastal seawater environment with a rapid BOD measurement system. Water Science and Technology 61(6): 3219-3223.
- Mansour SA, Sidky MM (2002) Heavy metals contaminating water and fish from Fayoum Governorate, Egypt. Food Chemistry 78(1): 15-22.
- Hadson PV (1988) The effect of metal metabolism uptake, disposition and toxicity in fish. Aquat Toxicol 11(1-2): 3-18.
- Zahed MA, Hamidi AA, Isa MH, Mohajeri L (2010) Effect of Initial oil concentration and dispersand on curde oil biodegradation in contaminated seawater. Bulletin Env con toxicology 84: 438-442.
- Herrojeet R, Rishi MS, Lata R, Dolma K (2017) Quality Characterization and pollution source identification of surface water using multivariate statistical techniques, Nalagarh Valley, Himachal Pradesh, India. Appl Water Sci 7: 2137-2156.
- Patey DM, Micha JA Rijkenberg, Peter J Statham, Mark C Stinchcombe, Eric P Achterberg, et al. (2008) Determination of nitrate and phosphate in seawater at nanomolar concentrations. Trends in Analytical Chemistry 27(2): 169-182.
- Beman JM, Kevin R Arrigo, Pamela A Matson (2005) Agricultural runoff fuels large phytoplankton blooms in vulnerable areas of the ocean. Nature 434: 211-214.
- Maier G, Nimmo Smith RJ, Glegg GA, Tappin AD, Worsfold PJ (2009) Estuarine eutrophication in the UK: Current incidence and future trends. Aquat Conserv Mar Freshw Ecosyst 19: 43-56.
- (2000) Australian and New Zealand guidelines for fresh and marine water quality. (Australia and New Zealand Environment and Conservation Council (ANZECC); and Agricultural and Resource Management Council of Australia and New Zealand (ARMCANZ): Canberra, Australia.
- Neelam A, Omm e Hany, Alamgir A (2018) Screening and characterization of coastal water quality at sandspit, Karachi, Pakistan. Journal of Chemical Biological and Physical Sciences 8(2):
- (1996) United Nation Economic and Social Commission for Asia and the Pacific (UNESCAP) Coastal Environment Management Plan for Pakistan, New York, United Nations, p. 233.
© 2022 © Asia Neelam. This is an open access article distributed under the terms of the Creative Commons Attribution License , which permits unrestricted use, distribution, and build upon your work non-commercially.
Editor In Chief


.jpg)


Signup for Newsletter

Quick Links
 Editorial Board Registrations
 Submit your Article
 Refer a Friend
 Advertise With Us
Our Recent Edition

.jpg)


Top Editors


.jpg)


.bmp)
.jpg)
.png)
.jpg)


.jpg)


.png)

.png)


.png)


Financial Support

Sponsors

Latest e-Books

Latest Video

 a Creative Commons Attribution 4.0 International License. Based on a work at www.crimsonpublishers.com.
Best viewed in
a Creative Commons Attribution 4.0 International License. Based on a work at www.crimsonpublishers.com.
Best viewed in