- Submissions

Full Text
Environmental Analysis & Ecology Studies
The Effect of the Sun’s Dynamics on Enso Phenomena
Ivanov OP*
Museum of Earth Studies MSU, Russia
*Corresponding author: Ivanov OP, Museum of Earth Studies MSU, Russia
Submission: May 27, 2021; Published: January 24, 2022

ISSN 2578-0336 Volume9 Issue4
Abstract
It is shown that surface temperature variations at equatorial latitudes depend entirely on the dynamics of the Hadley cell, which in turn depends on the dynamics of the Sun and its corona. The regional movement of thermal zones along the equator is due to the non-linear rhythm of the El Niño and La Niño events.
Keywords: Solar corona, Turboheating, Solar activity, Polar field, El Nino, La Nino
Introduction
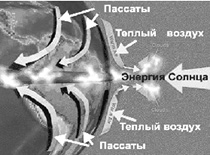
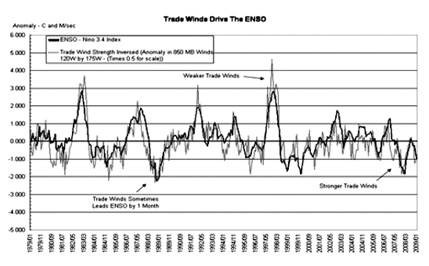
El Niño and La Niña (ENSO) events are associated with oceanic and atmospheric circulation patterns, which in turn affect weather and climate around the globe, causing droughts in some regions, hurricanes and heavy rains in others. That is why it is important to know the causes of this phenomenon. Until recently, it has been suggested that large-scale El Niño and La Niño (ENSO) events are free oscillations in the atmosphere-ocean system resulting from internal interactions in a complex system with many positive and negative feedbacks. It was not taken into account here that the internal interactions in the subsystems of any complex system require energy from an external source, in this case the sun. That is why one of the most relevant and at the same time causing bitter. The most controversial problem of modern geophysics is the impact of solar activity on the state of the ocean surface, the lower atmosphere and the weather of the earth. The active heat flow from the sun spins the atmospheric Hadley cells on both sides of the equator, while the relative cooling almost stops them and the dynamics of general convection slows down (Figure 1). The trade winds are important markers of Hadley cell activity. The inclination of the cells relative to the equator ensures the convergence of the trade winds to the convergence zone and the surge of waters to Indonesia along the equator during the La Niño period. The destruction of the trade winds during the weakening of the Hadley cells causes a reverse outflow of water masses to South America and the El Niño phenomenon (Figure 2). Thus, in order to understand the primary cause of the pulsations of the trade winds, we must to analyze the causes of pulsations of heat fluxes in the solar atmosphere, i.e., variations in solar activity [1-6].
Figure 1: Trade winds and the zone of ‘equatorial convergence’ [1].

Figure 2: The connection of trade winds with El Nino (in the opposite phase) .

Figure 3: Left shows the total coronal radiation power from 1938 to 1995 in W/sr. (left) and the course of temperature changes on the Earth (right) [3].

The Dynamics of the Sun’s External Systems
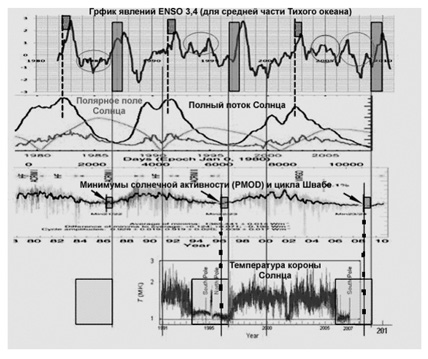
Since the satellite era, a number of other solar parameters. For example, variations in the temperature activity of the solar corona, the total intensity of the luminosity of the sun, variations in the speed of the solar wind, specificity of the magnetic fields of the sun, etc. The charts below (Figure 3) it can be seen that, taking into account the 11-year cycles, with the overall increase and power and radiation of the corona by almost (25%) in parallel there was an increase in temperature on Earth during the same period (ΔT=0.40C) (Figure 3). The challenge is to find out what other sun parameters affect variations in the flow of heat to the Earth’s surface. Below, (Figure 4) compares El Nino 3.4 (middle Pacific), evolution of terrestrial temperatures, floor flow, TSI, polar field and corona temperatures relative to each other. The diagram clearly shows that the turbocharged corona (bottom series) is activated in the minimum of the solar activity cycle (third on top of the series) according to PMOD data (beginning marked with lines with markers) and then launches the strongest ENSO, which in 11 months reach its maximum (top row with long rectangles) (Figure 4). It is the second most powerful phenomenon ENSO clearly associated with the maximums of the full flow of solar energy (second from the top series of data). Finally, the plots circled on the graph at the top are other even weaker ENSO events. The situation in circle E in 2005, according to NASA, is that with a only minimum strange you look like a solar maximum”. All other situations with the circle of am i show a connection with the magnetic polar field of the Sun. The activity of the solar wind was used to interpret the weak events of ENSO (Figure 5).
Figure 4: Here the top row is ENSO 3.4. It is easy to see that after each low in the Schwabe cycle, an El Niño event is triggered. Other maxima at ENSO are reached exactly at the maxima of the total flux at fixed intervals (gray small boxes) [5].

Figure 5: Shown are 27-day average solar wind speeds of 100km/s. To the left of the straight transverse line - reconstruction, to the right-directly measured values [6].

A fast solar wind blows from any non-asymmetric open flow, there is strong solar magnetic activity (e.g., Coronal Mass (CME) Emissions from flares) or from the sun’s polar coronal holes. The Max Planck Institute for Solar System Research (MPS) considers these storms to be associated with plasma flows from the coronals x holes, which is well recorded according to the AP magnetic activity index measurements.
Based on these situations, we can draw the following conclusions that El Nino events are triggered directly from three solar events:
i. Powerful coronal turbocharger when the temperature of the corona doubles, after a minimum of total flow and low solar activity;
ii. After each maximum of full flow;
iii. In the maximum of the polar floor I am the Sun (weak El Nino).
No answer, why when the polar floor changes I, on the one hand, a new solar cycle begins and the turbo heating of the corona is turned on, and on the other hand, the maximum in the solar cycle is reached, and then the solar activity decreases? However, it can be noted that the nature of the ENSO curve in (Figure 3) is characterized by strong non-linearity. There are no clear rhythms here, but there is a clear trigger showing that the ENSO 3, 4 zone in the middle of the Pacific ocean is influenced, Each of the parameters has its own corridor of variability, but their overlay creates a dynamically variable (chaos) pattern in the response of the atmosphere and hydrosphere.
References
- http://www.aos.wisc.edu/
- http://wattsupwiththat.com/2009/02/17/the-trade-winds-drive-the-enso/
- http://www.ngdc.noaa.gov/stp/SOLAR/solarda3.html
- http://science.nasa. gov/headlines/y2005/15sep_solarminexplodes.html
- http://www.mailmagazine24.com/environment-and-climate/01-2012/dynamic-solar-system-the-actual-effects-of-climate-change.html
- http://www.leif.org/research/files.html
© 2022 © Ivanov OP. This is an open access article distributed under the terms of the Creative Commons Attribution License , which permits unrestricted use, distribution, and build upon your work non-commercially.
 a Creative Commons Attribution 4.0 International License. Based on a work at www.crimsonpublishers.com.
Best viewed in


.jpg)


 Editorial Board Registrations
 Submit your Article
 Refer a Friend
 Advertise With Us
.jpg)


.jpg)


.bmp)
.jpg)
.png)
.jpg)


.jpg)


.png)

.png)


.png)


