
- About Us
- Information
-

The Author ensures that the research has been conducted responsibly and ethically with adherence to all relevant regulations. read more..
- For Authors
- For Reviewer
- Manuscript Guidelines
- Membership
- Publication Ethics
-
- Journals
- Reprints
- e-Books
- Videos
- Policies
- Contact Us
 COVID-19
- Submissions


Full Text
Environmental Analysis & Ecology Studies
Monitoring the Complex Dynamics of LULC Change of Tanguar Haor, a Ramsar Site in the Northeastern Part of Bangladesh
Md. Inzamul Haque1*, Md. Tariqul Islam2 and Sabina Islam3
1Department of Environmental Science and Geography, Islamic University, Bangladesh
2Department of Geography and Environment, Shahjalal University of Science and Technology, Bangladesh
3Department of Statistics, Shahjalal University of Science and Technology, Bangladesh
*Corresponding author: Md. Inzamul Haque, Lecturer, Department of Environmental Science and Geography, Islamic University, Kushtia-7003, Bangladesh
Submission: May 28, 2021Published: July 12, 2021

ISSN 2578-0336 Volume8 Issue4
Abstract
The bowl-shaped depressions between the natural levees of rivers, mostly found in the wetland of the north-eastern part of Bangladesh are locally known as Haor. This study has tried to find out the dynamics of land use/land cover (LULC) change of Tanguar Haor, a Ramsar Site of Bangladesh between 1989 and 2017. Satellite data from Landsat archive have been used to determine the LULC change and collected primary data through a questionnaire survey used to identify the factors and impacts of LULC change. Post-classification change detection techniques have been applied to evaluate the LULC change, and descriptive statistics are applied for qualitative analysis of primary data as well as other secondary data. The result summarizes that major LULC changes of Tanguar haor characterized by the alteration of the deep-water body to shallow water body. The expansion of shallow water bodies would not change the scenario alone as one-third of the shallow water parts are influenced by either vegetation or settlement within the time frame. Among the vegetation classes, agricultural land shows the maximum ascending trend. About one-third of every vegetation cover (reed Land, forested vegetation) of Tanguar Haor converted into agricultural land within the 28 years’ time frame. However, results also reveal that the wave of LULC changes has shifted its impact buffer from west to east throughout the observed years. More than 96% of people around Tanguar Haor are directly dependent on haor resources for their livelihood. Several important crops and vital natural vegetation of the haor basin like Bon Lobon, Hijol, Koroch, Nol, Gunji Kata, Dholkalmi, etc. are found seriously threatened because of imbalanced LULC change. The main reasons behind resource depletion and imbalanced LULC change are the overexploitation of haor resources driven by accelerated population growth, extreme poverty, and lack of proper education.
Keywords:Ramsar Site; Tanguar Haor, LULC Change, Dynamics, Factors, Impacts
Introduction
Bangladesh, one of the most active deltas of the world, possesses enormous wetland areas, out of which the principal ones are the rivers and streams, freshwater lakes and marshes including haors, baors, beels, and jheels. The bowl-shaped depressions (often tectonic in origin) between the natural levees of rivers in the north-eastern part of Bangladesh are locally known as Haors [1]. Haors are mostly found in the district of Netrokona, and the greater Sylhet districts-generally is known as the Haor Basin [2]. The Directory of Asian Wetlands identified the wetlands of the haor basin, including ten key sites of greater Sylhet and Mymensingh regions, as a wetland ecosystem of outstanding international importance [3]. Six of these key sites - Tanguar Haor, Pashua Beel and Gurmar Haor, Hakaluki Haor, Hail Haor, Kawadighi Haor, Baulai Haor - have been identified by Bangladesh Flood Action Plan (FAP) as of outstanding national and international importance [4]. Among these sites, Tanguar Haor which is also said to be part of the world’s largest geosyncline [5], is a unique haor system with bowl shape topography and uneven surface texture. The Haor fulfils at least three of the criteria established for declaring a wetland of internationally important, as adopted by the Montreux Conference of the Contracting Parties each of which alone is sufficient for proposing it as a Ramsar site [7]. It was declared as the second Ramsar site of Bangladesh after Sundarbans in 2000 by the Ramsar convention bureau [8].
The valuable landscape of Tanguar Haor faced a radical change in its form over the decades remarked by 40 percent of the total landscape went through a complete or partial shift in its original form. Apart form, only 30 percent of deep or perennial water bodies rest to use, high land or forested vegetation decreased by more than 50 percent, ephemeral shallow water bodies dominated more than 31 percent than before [8]. Swamp forests once common at the haor, have now become very rare due to clearing, cutting, and burning. Reed beds dominated by aquatic plants have been severely reduced because of the collection of fuel and thatch, and the conversion of marginal wetlands for agriculture [9]. Another serious listed environmental issue is natural regeneration, which became unknown in most of the places of Tanguar Haor [10- 12]. Several studies specified local dependency behind the rapid change as most of the people around the haor were directly or indirectly dependent on the haor based resources which ultimately hampering the socio-economic livelihood of the dependent people and vice versa [13,14].
LULC change study with the GIS-RS approach is not new in Bangladesh, several researchers e.g., [15,16] tried to assess LULC change focusing on the physical dimension and in a costeffective manner. But very few studies e.g., Haque et al. [7], have been conducted to identify the LULC change of Tanguar Haor in a spatiotemporal scale. Most of the studies on Tanguar Haor focused vastly on field surveys and in a qualitative manner. Physical and social status, major problems-prospects of the haor basins of Bangladesh were previously assessed focusing on an integrated management plan by NERP [17], under the Northeast Regional Water Management Project/FAP6. A qualitative study on Tanguar Haor was also conducted by Kabir et al. [12], which was a descriptive outlook of the physical and socio-economic state of the haor alongside with special focus on management and conservation issues. IUCN Bangladesh published several reports on Tanguar Haor mainly focused on Biodiversity (flora and fauna) and sustainable wetland management [11,13]. So, a comprehensive study focusing both on spatiotemporal LULC change (physical dimension) using GIS-RS and underlying socio-economic factors (socio-economic dimension) behind the change using field study hardly found in case of Tanguar Haor. Desalegn et al. [19], mentioned that only physical land cover change study with GIS-RS cannot evaluate the dynamics, causes, and impacts alone, therefore in-depth field study is a prerequisite for understanding the behaviour and response of LULC change.
Following the previous research gaps, the primary objective of this study set up to assess the complex dynamics of LULC change between 1989 to 2017 using four satellite images of 1989, 2001, 2010 and 2017. Subsequently, the study aims to identify the factors, causes, and impacts of LULC change by focusing on people’s perception and socio-economic function.
Materials and Methods
Study area
Figure 1:Geographic location of Tanguar Haor.

Tanguar Haor is situated in the north-eastern part of Bangladesh, between 25° 12ʹ 2.572ʺ and 25° 5ʹ 47.989ʺ north latitude to 90° 58ʹ 49.426ʺ and 91° 10ʹ 0.018ʺ east longitude. The total area of the haor is approximately 160 square kilometres including all geographic features and land use [5]. It covers two Upazilas of Sunamganj district (Tahirpur and Dharmapasha) and four unions (Uttar Bangshikunda, Dakshin Bangshikunda, Uttar Sreepur, Dakhsin Sreepur). Rather than considering the whole area of Tanguar Haor, this study has taken the core part comprising the perennial beels and its adjacent areas based on closest proximity purposively (Figure 1).
Sampling methods and data collection
Both primary and secondary data from different sources are used in this study. The details of data type and collection sources are presented in Table 1. Among the 46 identified villages by Sunamganj District administration, twelve villages of twelve mouzas in close proximity to Tanguar Haor was selected (Figure 1 & 2) based on the following criteria-
A. Proximity to the core area,
B. Peoples’ dependency on haor land use and resources,
C. Perception of the local community.
Table 1: Sources of data.

Figure 2: Sample household and survey locations.

After demarcating the study area, Simple Random Sampling (SRS) technique was followed to select the sampling unit. According to BBS (2011), the selected villages consist of 1252 household. 205 individual household were surveyed randomly from total household. The study found 6.27% margin of error (normal distribution 50%) within 95% confidence level following the standard sampling formula (Equation 1)

Where N = population size, z = z-score (z = 1.96 for a confidence level of 95%), e = margin of error, p = standard of deviation (0.5).
After determining the study area and household sample size for data collection, freeware satellite data covering the study area were downloaded from Landsat archive of United States Geological Survey (USGS) official website (earthexplorer.usgs.gov). To analyze the LULC change between 1989 and 2017, four satellite images of 1989, 2001, 2010, and 2017 had been considered. The acquired satellite dataset ensured satisfactory accuracy value and similar spatial resolution of multispectral bands (Table 2).
Table 2:Details of acquired satellite data.

Data processing
Preprocessing techniques including image-based radiometric, atmospheric calibration and several post-processing techniquessmoothing, aggregation, thresholding- were applied during various steps of analysis. Radiometric correction or calibration involved the conversion of the measured multispectral brightness or digital number (DN) values to top of atmosphere (TOA) reflectance units. Image-based radiometric calibration followed by two steps, firstly conversion of DN(Qcal) to radiance (Lλ) values and the next one is the conversion of radiance (Lλ) to reflectance (ρλ) values. The first step is based on maximal and minimal spectral radiance value for each band referred by Markham & Barker [6] based on the following formula (Equation 2). The second step followed by the Equation 3.
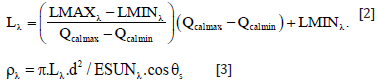
Where ‘ρλ’ is the planetary TOA reflectance, ‘Lλ’ denotes spectral radiance at the sensor’s aperture, ‘d’ represents Earth-Sun distance and ‘ESUNλ’ means exoatmospheric solar irradiance.
Dark object subtraction (DOS) was then applied for removing additive path radiance from the radiometrically calibrated image. Among the image-based methods, DOS is one of the most widely used methods for atmospheric correction which successfully applied in many Landsat studies [20] though the correction of these effects is not always necessary in remote sensing applications and has therefore often been ignored [21]. Thresholding was also applied as an important parameter during the different steps of image analysis e.g., vegetation indexing, change detection. The purpose of thresholding set to extract those pixels from some image which represent an object either text or other line image data such as graphs, maps [22]. Both global and adaptive thresholding methods have been used in this study to assess the change difference. Individual situations need threshold adjustment for more accurate delineation of vegetation cover and other LULC classes [23,24].
Classification method: Both supervised and unsupervised classification techniques had been applied to generate the classified maps of Tanguar Haor. The Maximum likelihood supervised classification method was applied to produce generalized LULC maps and in the meantime, unsupervised classification using the ISODATA self-iteration process was applied for in-depth classification of vegetation cover. Normalized difference vegetation indexing (NDVI) method was applied before unsupervised classification and change detection among different vegetation cover classes.
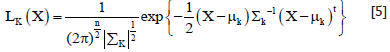
The first step of supervised maximum likelihood classification set to develop a classification scheme based on training sites created by using the area of interest (AOI) tool in ERDAS IMAGINE. Training site selection and signature generation were done serially. Afterwards, the supervised classifier classified the training pixels with the maximum likelihood of the corresponding class. If the likelihood LK is defined as the posterior probability of a pixel belonging to class k then LK is followed by the Equation 4.

Where P(k) is the prior probability of class K and P(X/k) denotes the conditional probability to observe X from class k or probability density function. Usually, P(k) is assumed to be equal to each other and ΣP(i)*P(X/i) is also common to all classes. Therefore, Lk depends on P(X/k) or the probability density function. For mathematical reasons, a multivariate normal distribution is applied as the probability density function. In the case of normal distributions, the likelihood can be expressed as follows (Equation 5) (Study Groups, JARS, 1996).
Four band composites (band 3,2,1), (band 4,3,2), (band 4,5,1), (band 5,4,3) had been generated during the classification process for better identification of different LULC classes. The whole classification process was operated with the reference of the observational survey and high-resolution Google Earth Pro image. An unsupervised classification method was also applied for detail classification of vegetation cover. This technique used the Normalized Difference Vegetation Index (NDVI) images to identify and classify the vegetation cover. NDVI had been calculated on a per-pixel basis as the normalized difference between Near Infra- Red (NIR) and RED channel (Equation 6).

Where NIR is the near-infrared band value for a cell and RED is the red band value for the cell. NDVI value close to ‘+1’ means denser and greener vegetation and ‘0>NDVI≤0.5’ means less green or other colored vegetation or dry leaf. ‘0’ means no vegetation and ‘0 to -1’ represent other land cover types (Rouse et. al., 1974). NDVI was calculated using ENVI 5.1 vegetation indexing tool. The NDVI images are exported to the ERDAS platform for detail unsupervised classification. This study uses the ISODATA algorithm rather than K-means as it allows the number of clusters to be adjusted automatically during the iteration by merging similar clusters and splitting clusters with large standard deviations [25]. The number of classes 6, convergence threshold 0.950, maximum iteration 10 and standard deviation 1 applied during the classification process. Among the well-identified six clusters, two clusters followed by the negative value, which was a clear demarcation that these clusters were not under any vegetation were ignored during final classification.
Accuracy assessment: The accuracy assessment procedure was executed followed by the procedure of Congalton [26]. Temporal satellite data (extracted from Google Earth Pro, Sentinel archive) used to assess the accuracy of the classified images. The total process has been done by comparing the reference image with the classified image with 150 sample points, created by SRS, and for every point, a class is assigned automatically. After selection, zero class values were deleted and finally, 86, 93, 104 and 89 valid random points have been generated for 1989, 2001, 2010 and 2017 image, respectively. The assessment result is summarized and quantified by using the error matrix.
LULC change dynamics analysis
This study used the post-classification approach to detect the complex LULC change dynamics of the study area following Ahmed [27]; Dewan & Yamaguchi [16]; Haque & Basak [9]. Postclassification change detection is conceptually one of the most empirical change detection techniques, which involves an initial, independent classification of each image, followed by a thematic overlay of the classifications [28-30]. AREA function of IDRISI SELVA was used to calculate and graphically represent the aerial change in spatiotemporal scale when change detection statistics (CDS) and Thematic Change Workflow tool of ENVI 5.2 was used to calculate the complex LULC change dynamics. CDS usually used to compile a detailed tabulation of changes between two classification images. For each initial state class (that is, each column), the table indicates how these pixels classified in the final state image. In the meantime, Thematic Change Workflow (TCW) had been applied to measure the change dynamics both statistically and thematically. It uses a standard from-to matrix to evaluate the change result. TCW is a pixel-based analytical technique that not only analyzes the change difference but also calculates the critical conversion of each land cover both temporally and spatially. An optional cleanup process was initiated to smoothen the output change difference images applying Kernel size 3 and aggregate minimum size 6.
Factor and impact analysis
Figure 3:Qualitative analysis flowchart.

Qualitative assessment techniques were followed to identify and discuss the factors and impacts of LULC change. Various social and environmental factors of LULC change of Tanguar Haor had been identified based on the household questionnaire survey, secondary data, field observation, and previous literature review. In some cases, this study ranked the perception of the local community based on a checklist (developed by literature review and field observation) to find out the critical factors and impact areas of LULC change. Following the method of Briassoulis [31], two key factors are considered for an in-depth evaluation of LULC change in Tanguar Haor. The analysis method is presented in Figure 3.
Result and Discussion
Image classification
Four land cover classes (Deep Water, Shallow Water, Vegetation- Settlement, and Fallow Land) were taken in the count during the development of a standard supervised classification scheme for Tanguar Haor. As Tanguar Haor consists of a small land area having a small amount of population, so it was quite impossible to identify the distinguish settlement class with such low-resolution images. Most of the rural settlements are mixed with vegetation cover and cannot be identified differently. The classification scheme is represented in Table 3. The resultant output of supervised classification is illustrated in Figure 4.
Table 3: Supervised classification scheme.

Figure 4: Maximum likelihood supervised LULC maps of Tanguar Haor.

Figure 5:NDVI maps of Tanguar Haor.

Figure 6:Unsupervised classification of NDVI images.

The result of the analysis of vegetation indices is presented in Figure 5. The figure produces a thematic presentation of the characteristics of vegetation cover over the years in the study area. The NDVI values follow a relatively increasing trend which denotes that the intensity of vegetation is in increase.
The result of the unsupervised classification of each NDVI images is presented in Figure 6 which shows three vegetation classes alongside with fallow land class. The classes were verified based on field survey and high-resolution aerial photographs from Google Earth Pro. Four types of vegetation cover were identified-
A. Forested Vegetation (FV)
B. Agricultural Land (AL)
C. Reed land (RL)
D. Fallow Land/Open Pasture (FL)
During final classification, focusing on the prior knowledge and literature review the highest cluster values were considered as the forested vegetation, the next cluster which consists of class value less than the vegetation cluster but greater than the rest ones had been considered as agricultural land. The third cluster possesses very lower positive values but greater than ‘0’ were identified as reed land. And the final cluster which exhibits ‘0’ value but not having any negative values considered as fallow land class. From the graphical output, it is evident that, agricultural land follows an increasing trend and forested vegetation experiences a decreasing trend.
The results of the accuracy assessment for each individual year were satisfactory. The total accuracy accounted for 1989, 2001, 2010 and 2017 are 84.88 percent, 86.02 percent, 85.58 percent, and 85.39 percent respectively with kappa coefficient value of 0.79, 0.80, 0.78, and 0.76. Conditional Kappa value for each category of different years was also higher except the value of SW in 2001, 2010, 2017, and the value of fallow land in 1989.
LULC change dynamics of Tanguar Haor
Spatiotemporal change in aerial magnitude: The result of this change analysis is imported in both image and attribute table format. The area image file represents how the intensity of the LULC magnitude distributed spatially (Figure 7). The analysis shows the intensity of shallow water increases rapidly. The most dominating pixels, shown as the light green colour in 1989, became orange in 2017, which results in a gradual increase in the homogeneous pixel area. The thematic expression also signifies that the aerial magnitude of the pixels in the northern part decreased from 1989 to 2017. Overall summary of Figure 7 concludes that the aerial magnitude of all other parts has declined except the middle part of Tanguar Haor. In the meantime, the statistical diagram (Figure 8) summarizes that the DW part of the study area has been decreased by around 15 sq.km within the observed years.
Figure 7: Aerial magnitude of Tanguar Haor in 1989 and 2017.

Figure 8:Temporal change in aerial magnitude of LULC classes.

The degradation rate seemed maximum in recent years. In the meantime, the SW advanced slowly and the rate of advancement was higher within 1989 and 2001. FL declined significantly within 1989 and 2001 when the change of DW and SW is also rapid. The diagram of temporal change of VG-ST interpreted that the land cover class increased dramatically within 1989-2001 but dropped down within 2001 and 2010. The rapid increase (1989-2001) is possibly characterized by excessive human migration after the 1990s and the opposite trend (2001-2010) is characterized by vegetation loss possibly due to anthropogenic factors.
Figure 9: Magnitude and trend of change in vegetation (1989-2017).

As supervised classification cannot separate the vegetation classes, the temporal change in the aerial magnitude of the vegetation cover is assessed separately (Figure 6). Figure 9 shows all vegetation LULC classes showing a positive trend, among all the classes, the red line represents AL showing the highest magnitude of change.
The AL changes by around 10 sq. km in the observed years, in the meantime all other vegetation covers e.g., RL, FV, and FL are showing relatively small changes in magnitude. Gains in RL were evident between 1989 and 2001, 2010 and 2017. A negligible loss of RL is observed between 2001 and 2010, but the overall change shows a positive value (2.8 sq. km). The maximum increase in AL (9.81 sq. km) is taken place between 1989 and 2001, 5.59 sq. km of AL gained between 2001 and 2010 and almost a similar amount of AL has been degraded or lost between 2010 and 2017. The overall gain of AL is 9.43 sq. km. FL is increased by 3.42 sq. km between 1989 and 2001 and decreased by 1.2 sq. km in the next 9 years. km. The FV lost several between 1989 and 2010, around 5 square km of FV is lost during this time.
LULC change detection statistics: The results of the CDS analysis are represented in Table 4-8 in matrix format. The result finds that 42.61 percent of DW, 24.38 percent of SW, 66.50 percent of FL and 13.64 percent of VG-ST have been converted within 1989 and 2001. Most of the DW bodies are converted to SW and the converted SW bodies further replaced by either vegetation or settlement (VG-ST). The result summarizes that half of the total area of the fallow land and one-fourth of the DW or perennial water is converted or degraded within 1989 and 2001. In the meantime, the ephemeral SW and vegetation with settlement (VG-ST) have been emerged rapidly (Table 4).
Table 4:Change statistics among different LULC between 1989 and 2001.

The next nine years after 2001 experienced a different pattern of change. The continuous advancement of VG-ST cannot last long. Due to a continuous increase in ephemeral SW bodies about 5.5 sq.km (20.19%) of VEG-ST have been replaced. The degradation of DW is decreased to some extent but not stopped at all. Around 4 sq.km. (15%) of the total VG-ST land cover became FL which is a clear demarcation of vegetation loss within this period (Table 5).
Table 5:Change statistics among different LULC between 2001 and 2010.

The recent change scenario between 2010 and 2017 followed by the previous 9 years’ trend, the rate of emergence of ephemeral SW from DW became rigorous. More than half of the DW bodies have been converted to SW in recent years. Due to the continuous degradation of the perennial beels, Tanguar Haor continuously loses its water holding capacity during the monsoon and facing significant water stress during drier months. Due to the increase in the SW parts VG-ST again started to increase by overlapping the SW parts. The replacement of VG-ST by FL signifies the degradation of vegetation cover and an increase in anthropogenic influence (Table 6).
Table 6:Change statistics among different LULC between 2010 and 2017.

The CDS analysis between 1989 and 2017 calculates that more than 75 percent of the DW part characterized by large perennial beels and lakes is converted to SW lands or semi-inundated or inundated RLs. A mass amount of vegetation lost in the higher grounds as 41 percent of the vegetation cover is converted to FL. In the meantime, 43 percent of the FL is converted to the VG-ST LULC which evaluated the human intervention and construction of settlements in the FL’s. The increase of settlement is higher than the decrease of vegetation; the aftereffect is the net increase in VG-ST LULC. The human intervention in SW parts is also clearly noticeable from the resultant table. Around one third of the SW parts were influenced by the VG-ST cover and that is a clear demarcation of anthropogenic influence in the shallower parts of the water cover (Table 7).
Table 7:Change statistics among different LULC between 1989 and 2017.

Table 8:Percent change statistics among different vegetation cover between 1989 and 2017.

The CDS analysis was also applied to determine the change statistics within different vegetation cover classes between 1989 and 2017 (Table 8) which summarizes that every vegetation cover is showing a positive change of increment. The row ‘others’ is the junk land cover category which is ignored during analysis. As shown in table 8, the most dominant vegetation cover of the study area is AL. The analysis found that about one-third of every vegetation cover has been converted into AL in 28 years. The AL is changed by 86 percent (15.32 sq. km) which has become vivid evidence of increasing human intervention in Tanguar Haor. Besides that, FL and AL are continuously changing to FV which is mixed up with the human settlement. This is another evidence of continuous human interruption in watershed areas. The image difference result illustrates that the difference in pixels coded RL between two images is greater than any other category. But it is also clearly identified that RL is significantly converting into either AL or FL.
Spatiotemporal dynamics of LULC classes: TCW analysis helps to understand the change dynamics both spatially and temporally. The result of the TCW analysis is presented in Table 9 and Figure 10. Among all, nine classes have been identified as the valid transition class. The most common transition that takes place within 28 years is the conversion of DW to SW (10.75%). In the view of spatial dimension, it is evident that the changing process between DW and SW switch its location and trend year by year. The change seems momentous in the middle and western sites covering Amtarpur, Nichintapur, Golabnagar, and Hatapatan between 1989 and 2001. After 2001, the wave of change is started to shift its location slowly from west to east. Most of the DW bodies changed to SW between 2010 and 2017 in the eastern part of the total landscape covering Moazzampur, Lamagaon, Jagadishpur, Maindiata, and Purba Rangachhara. The result of the change dynamics also reveals that the second most dominant transition between LULC is SW to VG-ST (6.82%).
Table 9: Statistical (from-to) change dynamics of Tanguar Haor between 1989 and 2017.

Figure 10: Thematic (from-to) change dynamics of Tanguar Haor (1989-2017).

A major part of this conversion took place between 2010 and 2017. The class conversion mainly occurred in the north-western part of Tanguar Haor when the class transition between DW-SW is shifted from west to east. A significant class change is also observed from VG-ST to FL (5.61%) and FL to VG-ST (4.01%). The transition from VG-ST to FL denotes a meaningful increase in bare surface and decline in forested vegetation which can be described by various anthropogenic influences. Most of this transition happened within 2001-2017. On the other hand, the transition from FL to VG-ST means a significant increase in settlement, which mostly happened between 1989 and 2001.
Factors influencing LULC change of Tanguar Haor
The most probable factors influencing LULC are population pressure, poverty, commercial and overexploitation of resources, increasing expansion of agricultural activities and overuse of forest resources, increasing siltation caused by degradation, disturbance in watershed areas, lack of awareness, and conflict over haor. Focusing on all the factors by following a systematic approach mentioned in Fig. 3, this study has identified three major factors behind imbalanced LULC change in Tanguar Haorexcessive population growth, dependence on haor resources and unsustainable agricultural practices.
Excessive population growth: Population growth and density were calculated using available population data (BBS, 2011). It is found that (Figure 11) the smaller areas (Indrapur, Binodpur, Shibpur, Hatpatan, and Nichintapur) are more populated and the population growth rate is also high in these places. Maindiata experiences the most significant increase whereas the population decreases significantly in Binodpur of Purba RangaChhara. The field survey finds that due to extensive population pressure and limited land, the local people are out-migrating from Binodpur to Joypur, Maindiata, and Paschim RangaChhara.
Figure 11: State of population of the study area.

A linear trend line is drawn by using available population data and projected population data (Figure 12), which illustrates a significant increase in population throughout the years. It is inferred that the population of the study area will become almost double within the next 37 years.
Figure 12:Decadal population trend.

This study also tries to find out the evidence of the overwhelming population by comparing the local and national annual population growth rates (Figure 13). The comparison evaluates that the annual population growth rate of Tanguar Haor was close to the national average between 1981 and 1993, but the scenario dramatically reversed after 1990. The average national population growth rate has been decreased to 1.6 between 1993 and 2011 but increased to 2.5 near Tanguar Haor.
Figure 13: Local vs national population growth.

Dependence on haor resources: Peoples in and around Tanguar Haor are very poor. Besides that, due to the lack of education and awareness, they never understand the importance of sustainable use of resources. A study by BCAS in 1997 reported that almost all the households around Tanguar Haor are fully or partially dependent on the haor resources, and multiple uses of these resources are very common. About 95 percent of the people reported dependency (occupational) with the haor, though there is a significant change in management practice (from leasing to government-managed resources) [14]. Based on dependency characteristics, the study has divided the locals’ dependency into three categories- income dependence, fuel dependence, food, and nutrition dependence.
During the field survey, about 96 percent of the people have claimed about their direct income dependency on haor (Table 10). The dependency become maximum during the drier months and minimum during monsoon. Due to excessive population pressure, the income dependency of the residents creates a serious threat to the haor resources.
Table 10: Income dependency on haor resources.

(Source: Field Survey 2017).
The scarcity of cooking fuel is another major cause behind the extinction and degradation of various swamp forests and reed land resources. Large-scale deforestation takes place in the haor for many years only due to over-dependency in swamp forest-based fuel (wood). In terms of the source the of actual collection, 72 percent of the fuel supplies are still from the haor swamp forests, 83 percent are grass and reeds, 67 percent is cow dung [14]. The field survey finds that 50 percent of respondents use only wood, and more than 80 percent of the cases are dependent on wood for cooking purposes. Around 30 percent of people having cows as livestock, use dry cow dung as the main fuel. The relatively rich people buy jute sticks from the market and use it as the secondary fuel for cooking. Table 11 provides an overview about the fuel dependency of the residents around Tanguar Haor.
Table 11: Main source of cooking fuel of the respondents.

(Source: Field Survey 2017).
Living below the poverty line, most of the respondents opines that they do not have the ability to buy extra nutritious food (besides rice) for their family. Sometimes it is hard to manage three square meals per day. Being fertile, Tanguar Haor able to fulfil their rice demands throughout the year. They have to cultivate paddy in the middle to higher grounds locally known as ‘Kanda’. But to assure the basic food demand of an increasing number of people they are pushed to cultivate on the lower grounds which usually more vulnerable to flash floods. Excessive paddy cultivation may make the agricultural land infertile for other vegetables and crops which are essential to fulfil the nutrition demand of the local people.
Impacts of LULC change on Tanguar Haor
Focusing on the available literature and field survey this study has identified seven key areas which are affected by imbalanced LULC change. The sectorial impacts have been ranked based on locals’ perceptions presented in Table 12. The Respondents have provided their perception based on their socio-economic values and practical knowledge. About 70 percent of the respondents identify at least four impact areas when around 40 percent of respondents opine about five impact areas and 20 percent of respondents figure out six major impact areas of LULC change.
Table 12: Ranking of major impact areas of LULC change in Tanguar Haor.Main source of cooking fuel of the respondents.

(Source: Field Survey 2017).
About 50 percent of the respondents detect fish habitat as the first-ranked impact area and 44.4 percent as the second-ranked area. In the meantime, bird species has been ranked the first order by 30 percent of respondents and second order by 19.5 percent of respondents. Agriculture is the third weighted ranked area based on the response. It is also identified as the first-ranked area by 20 percent of respondents and second-ranked area 11 percent of respondents. As most of the respondents have been involved with agricultural activities, the impact of LULC change on agriculture become a growing concern among the respondents. Plant species, soil, water bodies, and weather/climate were reported as the fourth, fifth and sixth weighted impact area, respectively. Degradation of water bodies is identified by the respondents as one of the least impact areas as the respondents do not consider water bodies as the vulnerable approach but as a beneficial approach [28-34].
This study also identifies the impact of LULC change on different plant (tree/shrub) species in and around Tanguar Haor based on locals’ frequency of response. 20 major plant species are listed which became abundant in Tanguar Haor after 1990. According to the respondents, among those species 7 species are still available, 5 species are vulnerable, 6 nearly extinct and 2 completely extinct. Table 13 lists the major/tree shrub species status affected by LULC change in Tanguar Haor.
Table 13:Major tree/shrub species status (based on availability) of the study area.

(Source: Field Survey 2017).
Conclusion
Tanguar Haor is one of the largest and important freshwater reservoirs in Bangladesh. Its main identity is its perennial water covers e.g., beels. This study monitors and evaluates the change dynamics of Tanguar Haor spatiotemporally. Alongside the water cover, this study also emphasizes other land cover features e.g. vegetation (agricultural, reed land, forested land), fallow land which supports to sustain the greater haor ecosystem. The study reveals that about 70 percent of the perennials beels have been degraded which never restored naturally. Most of the degraded deep-water bodies converted to ephemeral shallow water which attracts the hungry locals to practice agriculture near the water. The analysis uncovers the overwhelming increase in agricultural land, as more than 30 percent of all vegetation cover (reed land, forested vegetation) transformed into agricultural land within the selected time frame. It is also evident that the intensity of LULC change shifted from North West to the North-Eastern part of Tanguar Haor.
As most of the perennial beels e.g., Hatirgata, Bharbheria, Chotainna, Rowa, Lechuamara, Rupaboi, etc. are located in the middle and North-Eastern part of the haor basin, those perennials beels are seriously threatened. The qualitative analysis concludes that increasing human intervention in the major watershed areas loosens the soil adhesion and increases the rate of siltation which converting the natural landscape into agricultural heaven which inspires inner migration causes further damage in the integrity among the haor resources and resisting the natural regeneration. Many important plant species namely Bon Lobon, Hijol, Koroch, Nol, Gunji Kata, Dholkalmi, etc. and agricultural crops e.g., Mustered, Pepper, Mongol, Shalboro, Wheat, Tishi, etc became vulnerable due to dominance of single crop (paddy) cultivation. The findings of this research can be a cost-effective attribute for further monitoring and restoration of natural resources as well as can contribute to the national conservation strategy. A Similar study using higher resolution satellite data and complex geostatistical models can result in better insights and open a doorway to further investigation about the interrelation among the factors of LULC change.
Acknowledgement
The authors are grateful to Ministry of Science and Technology, Government People’s Republic of Bangladesh to grant National Science and Technology (NST) fellowship to accomplish this study.
References
- Brammer H (2012) Physical Geography of Bangladesh. (1st edn), The University Press Ltd., India, pp. 1-548.
- Rasheed KS (2008) Bangladesh: Resource and environmental profile. AH Development Publishing House, India.
- Scott DA (1989) A directory of Asian wetlands. IUCN-International Union for Conservation of Nature. Gland, Switzerland.
- Bennett S, Scott D, Karim A, Sobhan I, Khan A, et al. (1995) Chapter 3: Interpretive Description of the Region's Wetlands. Wetland Specialist Study, Northeast Regional Water Management Plan, Bangladesh Flood Action Plan 6. Bangladesh Water Development Board, India.
- Alam ABMS, Chowdhury MSM, Sobhan I (2012) Biodiversity of Tanguar Haor: A Ramsar Site of Bangladesh. Volume I: Wildlife, IUCN-International Union for Conservation of Nature, India, pp. 1-248.
- Davis TJ (1994) The Ramsar Convention Manual. A Guide to the Convention on Wetlands of International Importance, Especially as Waterfowl Habitat. Ramsar Convention Bureau, Gland Switzerland.
- Markham BL, Barker JL (1986) Landsat MSS and TM post-calibration dynamic ranges, exoatmospheric reflectances and at-satellite temperatures. EOSAT Landsat Technical Notes 1(1): 3-8.
- Bevanger K, Datta AK, Eid AT, Shirin M (2001) Tanguar Haor Wetland Biodiversity Conservation Project-An Appraisal. NINA Project Report 16, p. 1-39.
- Haque MI, Basak R (2017) Land cover change detection using GIS and remote sensing techniques: A spatio-temporal study on Tanguar Haor, Sunamganj, Bangladesh. The Egyptian Journal of Remote Sensing and Space Science 20(2): 251-263.
- RIS (2012) Information Sheet on Ramsar Wetlands.
- Alam ABMS, Badhon MK, Sarker MW (2015) Biodiversity of TH: A Ramsar Site of Bangladesh Volume III: Fish. IUCN-International Union for Conservation of Nature, India, pp. 1-216.
- Kabir M, Amin S (2007) Tanguar Haor, A diversified freshwater wetland. Academic Press and Publishers Library, India.
- Sobhan I, Alam ABMS, Chowdhury MSM, Rahman A, Sobhan I, et al. (2012) Biodiversity of TH: A Ramsar Site of Bangladesh, Volume II: Flora. IUCN Bangladesh, India, pp. 1-236.
- Ali DF (2014) Wetland biodiversity a case study of Tanguar Haor.
- Haque AKE, Kazal HM (2008) Rich Resources, Poor People The paradox of living in Tanguar Haor. Technical Report, p. 1-33.
- Dewan AM, Yamaguchi Y (2009) Land use and land cover change in greater Dhaka, Bangladesh: Using remote sensing to promote sustainable urbanization. Applied Geography 29(3): 390-401.
- Rasul G, Thapa GB, Zoebisch MA (2004) Determinants of land-use changes in the Chittagong Hill Tracts of Bangladesh. Applied Geography 24(3): 217-240.
- (1993) NERP (Northeast Regional Water management Project/FAP6). Wetland Resources Specialist Study. Canadian International Development Agency (CIDA), India.
- Desalegn T, Cruz F, Kindu M, Turrión MB, Gonzalo J (2014) Land-use/land-cover (LULC) change and socioeconomic conditions of local community in the central highlands of Ethiopia. International Journal of Sustainable Development and World Ecology 21(5): 406-413.
- Song C, Woodcock CE, Seto KC, Lenney MP, Macomber SA (2001) Classification and change detection using Landsat TM data: When and how to correct atmospheric effects? Remote Sensing of Environment 75(2): 230-244.
- Jensen J (1996) Introductory digital image processing: A remote sensing perspective.(2nd edn), Prentice-Hall Inc, USA, pp. 1-316.
- Devi HKA (2006) Thresholding: A pixel-level image processing methodology preprocessing technique for an OCR system for the Brahmi Script. Ancient Asia 1: 161-165.
- Liu Y, Liang G, Saha PK (2012) A new multi‐object image thresholding method based on correlation between object class uncertainty and intensity gradient. Medical physics 39(1): 514-532.
- Ji L, Zhang L, Wylie B (2009) Analysis of dynamic thresholds for the normalized difference water index. Photogram Eng Remote Sens 75(11):1307-1317.
- Wang R (2016) Unsupervised Classification-Clustering.
- Congalton RG (1996) Accuracy assessment: A critical component of land cover mapping. Gap Analysis.
- Ahmed B (2011) Urban land cover change detection analysis and modeling spatio-temporal growth dynamics using remote sensing and GIS techniques: A case study of Dhaka, Bangladesh. Erasmus Mundus Program, NIMS - MSc Dissertations Geospatial Technologies, pp. 1-151.
- Almutairi A, Warner TA (2010) Change detection accuracy and image properties: A study using simulated data. Remote Sensing 2(6): 1508-1529.
- (2012) Bangladesh Bureau of Statistics. Bangladesh population and housing census 2011, India.
- BCAS (1997) Demographic and Socio-Economic Survey, Final Report, National Conservation Strategy Implementation Project 1. Bangladesh Centre for Advanced Studies, Ministry of Environment and Forest, GOB, India.
- Briassoulis H (2009) Factors influencing land-use and land-cover change. Land Use, Land Cover and Soil Sciences- Land Cover, Land Use and the Global Change, p. 1-7.
- Jensen JR (2005) Introductory digital image processing: A remote sensing perspective. (3rd edn), Pearson Prentice Hall, USA, pp. 505-512.
- Rouse Jr J, Haas RH, Schell JA, Deering DW (1974) Monitoring vegetation systems in the Great Plains with ERTS. Proceedings of the Third Earth Resources Technology Satellite- 1 Symposium, USA, pp. 301-317.
- Study Groups, JARS (1996) Chapter 11 Image Processing-Classification.
© 2021 © Md. Inzamul Haque. This is an open access article distributed under the terms of the Creative Commons Attribution License , which permits unrestricted use, distribution, and build upon your work non-commercially.
Editor In Chief


.jpg)


Signup for Newsletter

Quick Links
 Editorial Board Registrations
 Submit your Article
 Refer a Friend
 Advertise With Us
Our Recent Edition

.jpg)


Top Editors


.jpg)


.bmp)
.jpg)
.png)
.jpg)


.jpg)


.png)

.png)


.png)


Financial Support

Sponsors

Latest e-Books

Latest Video

 a Creative Commons Attribution 4.0 International License. Based on a work at www.crimsonpublishers.com.
Best viewed in
a Creative Commons Attribution 4.0 International License. Based on a work at www.crimsonpublishers.com.
Best viewed in