
- About Us
- Information
-

The Author ensures that the research has been conducted responsibly and ethically with adherence to all relevant regulations. read more..
- For Authors
- For Reviewer
- Manuscript Guidelines
- Membership
- Publication Ethics
-
- Journals
- Reprints
- e-Books
- Videos
- Policies
- Contact Us
 COVID-19
- Submissions


Full Text
Environmental Analysis & Ecology Studies
Assessment of Heavy Metal Pollution in Sediments of Silver River, Southern Ijaw, Bayelsa State, Nigeria
Kieri IBS, Ekpete OA and Edori OS*
Chemistry Department, Nigeria
*Corresponding author: Edori OS, Chemistry Department, Nigeria
Submission: March 10, 2020Published: February 9, 2021

ISSN 2578-0336 Volume7 Issue5
Abstract
The concentrations of heavy metals in sediment of Silver River were determined using atomic absorption spectrophotometer. The result indicated the presence of heavy metals at different concentrations. The concentrations of the heavy metals showed that Fe>Mn>Zn>Cu>Ni>Cr>Pb>Cd>Hg. The mean concentrations of the measured metals in mg/Kg were Cd (2.638±0.900), Pb (6.004±1.368), Cr (6.228±1.752), Ni (6.570±1.102), Cu (8.754±2.386), Zn (15.320±3.486), Fe (219.593±22.641), Mn (54.172±51.645) and Hg (0.006±0.005). All the concentrations of the heavy metals examined when compared with those of average value of heavy metals in shale showed that all the metals were lower than their corresponding world average values except Cd. Contamination factor index analysis of the sediment heavy metals burden showed that the sediment was polluted with Cd, contaminated with Cu, Zn and Cr and uncontaminated with Pb, Fe, Mn and Hg, Ni. Thus, showing that despite the heavy oil discharges from artisanal refining practices, the sediment is yet to be contaminated. The obtained values are yet to implicate anthropogenic input sources of heavy metals into the river. However, frantic effort should be put in place to curb input sources into the river.
Keywords: Sediment;Pollution; Silver river;Heavy metals; Contamination
Introduction
The presence of heavy metals in any environment resulted from natural and anthropogenic
causes and are able to accumulate in the sediment strata of rivers, which results in negative
environmental consequences for immediate dwellers within the area and the attendant
quality of the water [1]. The fact about the toxicity and carcinogenic characteristics of heavy
metals and other health effects associated with them has been documented [2]. Heavy metals
may not constitute or pose risk to the environment when they are present in quantities that
are within natural acceptable values [3]. Heavy metals are found naturally in the earth’s crust.
Due to disintegration and breakdown of rocks, they are transported from the topsoil through
runoffs and deposited at the bottom sediment. Apart the release of heavy metals into the
river through natural causes, there exist also the input of heavy metals into the sediment
through human activities namely urban growth, mechanization, transportation and energy
production [4]. Another aspect of heavy metals distribution within the aquatic environment
which is not given adequate consideration is runoffs from storm water. Studies have shown
that the rainstorm water traversing the surface of soil carries along it transport path heavy
metals that have originated from diversity of normal human activities that is accompanied
with wear and tear of material, corrosion, roof run-off and fuel combustion products [5].
In the Niger Delta Region of Nigeria, one of the major routes of pollution is the petroleum
and its allied companies. Added to the sophistry of oil production is the present proliferated
artisanal refining that has taken over the different waterways of the region. The unapproved
production of refined petroleum products is associated with the generation of waste
which are discharged into the environment without following laid down rules [6]. The
petrochemical and oil industries are the major sources of pollution [7]. The introduction
of waste into the aquatic environment without the necessary approach or ways to remove
contaminants has the potential to increase the value of heavy metals above the natural value
and thus lead to accumulation of heavy metals in sediment and tissues of water dwelling
animals [8]. Increased levels of heavy metals in both water and sediment portends danger to the surrounding environment and have negative transfer effect
on human well-being through food channels [9]. The information
on the pollution status of any aquatic environment is a function of
the contamination or pollution of its sediment, which is the final
repository of contaminants or pollutants in any waterbody [10,11].
The retained or accumulated heavy metals in the sediment can be
re-suspended back to surface water based on ecological disorders
or turbulence that may occur and therefore causing harmful
effect on the ecosystem [12]. This study was done to examine the
concentrations of heavy metals in sediment of Silver River, an
important commercial river for the Southern Ijaw people of Bayelsa
State, Niger Delta, Nigeria.
Materials and Methods
Collection of sediment samples
Sediment samples were collected from the surface using plastic trowel and immediately transferred to plastic cellophane bags and then put into ice chest containers. They were transferred to the laboratory immediately. The samples were collected between the Enewari community in the northern axis, through Fonibiri, Opuama and ended at Akamabobou in the southern axis. These are associated with intensive oil spills, local refining operations, sewage disposal, agricultural discharges from runoffs and local industries (Figure 1).
Figure 1: Map of southern ijaw showing silver river.

Preparation of sediment samples
Sediment samples were air dried in the laboratory to constant weight. The dried samples were macerated to fine powder using mortar and pestle. The macerated samples were sieved with a 2mm mesh. Stones and hard objects were removed without being crushed. The samples were then ready for further processing for heavy analysis.
Digestion of sediment samples
Precisely, 3g of the finely pulverized sediment samples were placed in digestion vials to which 20ml of aqua regia mixture (3:1 v/v of HNO-3 and HCl) was added and heated over steam bath to a clear solution. Thereafter, 20ml of deionized water was added and the heating continued for 5 minutes. The mixture was filtered with whatman filter paper in to 50ml sample bottle. The content was made up to 20ml mark and stored in the freezer at 4 °C.
Determination of heavy metals in sediment samples
The concentrations of heavy metals in the sediment samples were done using atomic absorption spectrophotometer. Quality check was done by comparing the values obtained with those of standard reference materials after every ten measurements of the samples.
Determination of Contamination Factor, Pollution Load Index, Contamination Degree and Modified Contamination Degree
The contamination factor of the individual metals in sediment was calculated from the formula adopted from the work by Edori and Kpee (2017) as:
CF=Cm/Cb
Where CF is the contamination factor, Cm is the concentration of metal measured in sediment and Cb is the background concentration of the metals in sediment. The background values were obtained from the work of Turekian and Wedpohl [13], being the average crustal value of each metal in shale.
Pollution load index was calculated using the formula
Pollution Index (PI) = n√(Cf1 X Cf2 X Cf3 X… X Cfn),
Contamination degree (CD) and modified contamination degree were calculated using the formula of Hakanson (1980)
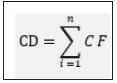
and the modified contamination degree as
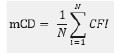
The PLI, CD and mCD were then interpreted based on intervals of contamination and pollution provided for each of the assessment indices (Hakanson, 1980).
Result and Discussion
The concentrations of heavy metals in sediment samples are given in Table 1.
Table 1:Concentrations of heavy metals in sediment samples in the different stations in silver river.

Cadmium (Cd)
In the sediment, the values ranged from 1.6942-3.842mg/Kg as against the 0.3mg/Kg, the average value in shale. The values obtained in the sediment samples in the present work were higher than the values observed in sediments of Lake Asejire, Nigeria [14] and those of Wu et al. [15] in two plateau Reservoirs in China. Cd is very vital in the monitoring of aquatic environment; this is due to its toxicity to aquatic flora and fauna. Cd is a known human carcinogen and when it is extensively dispersed in water environment, it has the capacity to bioaccumulate in fishes, aquatic plants, and the sediment. Bottom dwelling species such as crabs, mollusk, crustaceans, and fish accumulate Cd in their tissues at different [16,17].
Lead (Pb)
The concentrations of Pb in the sediment samples were within the range of 4.6941-7.8911mg/Kg. this value is lower than the average value of 85mg/Kg in shale. The observed sediment concentrations of Pb in the present work disagrees with the findings of Shanbehzadeh et al. [18] where Pb concentrations in sediment was found to be in the range of 141±4.0-270±0.5mg/L and those of Wu et al. [15] in sediments obtained from Hongfeng and Baihua Reservoirs, Yunnan-Guizhou Plateau in Southwest China, but disagrees with the values observed in both sediment from Ikpoba and Ekpan Rivers in Warri Delta State, Nigeria, impacted with crude oil pollution by Owamah [19]. Pb like Cd is known to be poisonous and carcinogenic in nature. It has not been known to possess any important physiological characteristics in animal or plant system, but rather acts as an inhibitor of many regular systems in humans. Elevated levels of Pb in humans is poisonous and may possibly cause severe disease in animals [20] or a condition known as plumbism [21]. Negative effects of Pb to marine or freshwater plants and animals namely algae, benthic invertebrates, and embryos and fingerlings of freshwater fish and amphibians comprise loss of sodium, reduction in performance capacity, development difficulties, and irregular growth of algae [22].
Chromium (Cr)
The values of Cr obtained in the sediment ranged from 4.0321- 8.321mg/Kg as against 90mg/Kg in world average shale value. Cr values obtained in sediments of the Silver River were lower than those of the Tembi River, Iran as observed by Shanbehzadeh et al. [18]. Cr as a metal is a known low mobile element. This characteristic if very pronounced when there is moderate oxidizing and reducing conditions at pH values that is close to 7. Sources of Cr in both terrestrial and aquatic environment, principally arise from production of steel and other alloys, chrome plating, and pigment production and paint.
Nickel (Ni)
The concentrations of Ni in sediment samples ranged from 5.1163-7.7842mg/Kg, which were lower than the average of 68mg/Kg value in shale. Sediment Ni concentrations in Silver River as observed were lower than the values observed by Decena et al. [23] in urban river in the Philippines, where concentration values were found to be as high as 12.08 to 98.07mg/Kg. Ni is commonly exist bound to organic components of soil or sediment and in acidic or neutral conditions, it becomes readily mobile and available to plants and animals [24]. The sources of Ni in the Silver River might be from wood burning, crude oil combustion, agricultural discharges and domestic effluents and discharges. This observation is in consonance with the observation of Purushothaman and Chakrapani [25] in Ganga River Sediment, India.
Copper (Cu)
The concentrations of Cu in the sediment of the river varied from 6.1474-11.9132mg/Kg respectively. The average value for soil and sediment in shale for Cu is 45mg/Kg. The sediment values of Cu in this river (Silver River) as observed were very low when compared with the values of Cu observed in Mangonbangon River, an urban city in the Philippines, where values ranged from 29.40- 217.06mg/Kg [23]. This metal is vital for the appropriate growth of the plants. This is due to the fact that it is part of several enzymes and proteins [24]. Source of Cu in the environment arise from electrical installations, roofing sheets, and manufacturing of alloys, colour pigmentation, household cooking implements, and [26] and the application of fertilizers, growth inducers and pesticides in both plant and animal farms [23].
Zinc (Zn)
Sediment concentrations of Zn in the sampled stations varied from 10.712-19.1419mg/Kg. these values were below the average concentration of Zn in shale, which is 95mg/Kg. Sediment values of Zn from the Silver River is lower than those of [23] in Mangonbangon River in the Philippines, where value range was between 76.83-263.63 mg/Kg and those of Sivakumar et al. [27] in South East Coast of Tamilnadu, India, whose values ranged from 26.8-48.8 mg/Kg. Zn is an indispensable metal for animal and human body metabolism. It is present in food and water as salts or as organic complexes [28]. Fertilizers, sewage The main sources of Zn pollution in the environment are zinc fertilizers, sewage slurry and mining operations. Other sources of Zn in water include runoffs from settlements, drainage or discharges of mine wastes and public sewages discharge systems (Damodharan, 2013). It is difficult to experience Zn poisoning in humans, although rare cases have been reported and it rarely accumulates in human body. Zn activates enzymes, but exceeded levels of Zn affects bone growth, development and functioning of reproductive organs. Its action in water plants is a function of the water hardness, concentration of dissolved oxygen and temperature. Zn is very important in the physiologic and metabolic developments of several plants and animals. Zn toxicity is associated with signs of diarrhea, bloody urine, liver and kidney failure and anemic conditions [29].
Iron (Fe)
The values of Fe observed in the sediment varied from 189.1783- 243.469mg/Kg as against the 47200 mg/Kg in the world average value in shale. The values of Fe obtained in the sediment samples from the Silver River in the present research is higher than those of Owamah [19], in sediments of Ijana River, Warri contaminated with spilled petroleum, but lower than those of Sivakumar et al. [27] in Tamilnadu, India. Fe is a known abundant metal in the earth’s crust. The chief sources of natural Fe in water system are weathering of rocks, erosion or runoffs and decaying parts of plants, but large quantity or levels of Fe in a river ecosystem resulted from largescale anthropological activities like urban-industrial discharges of effluents, metropolitan solid waste releases, building of structures, destruction of waste and agro-based activities [26].
Manganese (Mn)
In the sediment samples, the values of Mn ranged from 16.0171- 127.184mg/Kg as compared to the average value in shale, which is 850mg/Kg. Sediment concentrations of Mn in the silver River are lower than those of Sivakumar et al. [27] in South East Coast of Tamilnadu, India, Decena et al. [23], in Mangonbangon River in the Philippines, those of Montalvo et al. (2014), in Palizada River, Mexico and those of Kpee et al. [30] in Andoni Rvers, Rivers State, Nigeria. Mn is a crucial metal for both living organisms. Deficiency of Mn in animals can possibly lead to serious skeletal and reproductive defects in higher animal e.g. (Homo sapiens) [31]. Mn sources in the environment arise from electronic and electrical constituents or parts and plastics pigments [32], which when carelessly discharged into the environment decays and releases it to the river system [33].
Mercury (Hg)
The concentrations of Hg in the sediment phase of the river varied within the range of 0.0021-0.0121 mg/Kg as against 1.4mg/ Kg in world average value in shale. The values of Hg observed in sediments in the present work agrees with the findings of Ogamba et al. [34] in a similar Niger Delta environment, but lower than the values observed in in bottom sediments of the Odra River in parts of Poland and Germany by Boske et al. [35] and those of Medrano et al. [36] in San Juan River, Mexico. Hg sources in water environment can either result from natural or artificial (man-made) causes which may include deposition from the atmosphere, manufacturing developments, quarrying activities and runoffs from agricultural lands. Hg in sediment can as a complex inorganic compound or in elemental form and becomes very poisonous when it exists as methyl mercury [36].
Contamination Factor of Heavy in Sediments of Silver River
The contamination factor of the individual heavy metals in Sediment samples were as follows; Cd varied from 5.647-12.807, Pb varied from 0.054-0.093, Cr was between 0.070-0.448, Ni was between 0.075-0.114, Cu varied between 0.137-0.265, Zn varied between 0.106-0.201, Fe varied between 0.004-0.005, Mn varied from 0.015-0.022 and Hg varied from 0.0008-0.0022. These values when compared to the intervals of contamination and pollution intervals and interpretations as proposed by Lacatusu [37] revealed that the sediment was in the range of severe pollutionvery severe pollution with Cd, but uncontaminated with Pb, Fe, Mn and Hg, Ni in station 1 and Cr in stations 2 and 3. The sediment was moderately contaminated with Cr in station 1. The level of contamination of sediment with Cu and Zn varied from very slight contamination slight contamination (Table 2). The pollution load index, contamination degree and modified contamination degree of the heavy metals are given in Table 3. The pollution load index (PLI) obtained from the river varied from 1.231-1.336. All the sediments from the stations examined fall within the range of 1.1-2.0, which is classified in the category of slight pollution with heavy metals. This observation is higher than the observation of PLI by Mortuza & Al Misned [38] in sediments from Red Sea coast of Jizan, Saudi Arabia, where PLI values were as low as 0.06 and those of Mandeng et al. [39] in sediments collected from two divisions in a river in Abiete-Toko gold region, Southern Cameroon, but either lower, within the range or higher than the values observed in sediments from different stations in two notable streams (Strzyza and Oliwski Streams), which flows into the Baltic Sea, Poland [40].
Table 2:Contamination factor of heavy metals in sediment samples from different stations in silver river.

Table 3:

Conclusion
The present stages of the concentrations of the examined heavy metals in sediment samples in the Silver River were generally lower than established world average values in shale except that of Cd. Despite the fact that the concentrations of the metals were within values that do not presently show stressed sediment environment, except for Cd concentrations, yet the environment require constant monitoring to avert sudden rise in general heavy metal content in the sediment, looking at the present activity that is within the area [45].
References
- Demirak A, Yilmaz F, Levent TA, Ozdemir N (2006) Heavy metals in water, sediment and tissues of Leuciscus cephalus from a stream in southwestern Turkey. Chemosphere 63: 1451-1458.
- Acosta JA, Arocena JM, Faz A (2015) Speciation of arsenic in bulk and rhizosphere soils from artisanal cooperative mines in Bolivia. Chemosphere 138: 1014-1020.
- Bing H, Zhou J, Wu Y, Wang X, Sun H, et al. (2016) Current state, sources, and potential risk of heavy metals in sediments of Three Gorges Reservoir, China. Environmental Pollution 214: 485-496.
- Xia F, Qu L, Wang T, Luo L, Chen H, et al. (2018). Distribution and source analysis of heavy metal pollutants in sediments of a rapid developing urban river system. Chemosphere 207: 218-228.
- Nour HE, El Sorogy AS, Abdel WM, Almadani S, Alfaifi H, et al. (2018) Assessment of sediment quality using different pollution indicators and statistical analyses, Hurghada area, Red Sea coast, Egypt. Marine Pollution Bulletin 133: 808-813.
- Ekpete OA, Edori OS, Kieri BSI (2019) Assessment of heavy metals concentrations in surficial water of Silver River, Southern Ijaw, Bayelsa State, Niger Delta, Nigeria. Journal of Basic and Applied Research International 25(4): 186-193.
- Mitra A, Mondal K, Banerjee K (2010) Concentration of heavy metals in fish juveniles of Gangetic Delta of West Bengal, India. Journal of Fisheries and Hydrobiology 5: 21-26.
- Lu Y, Yin W, Huang LB, Zhang GL, Zhao YG, et al. (2011) Assessment of bioaccessibility and exposure risk of arsenic and lead in urban soils of Guangzhou City, China. Environmental Geochemistry and Health 33: 93-102.
- Uluturhan E, Kontas A, Can E (2011) Sediment concentrations of heavy metals in the Homa Lagoon (Eastern Aegean Sea): Assessment of contamination and ecological risks. Marine Pollution Bulletin 62(9): 1989-1997.
- Schleiss AJ, Franca MJ, Juez, C, De Cesare G (2016) Reservoir sedimentation. Journal of Hydraulic Research 54: 595-614.
- Agarwal A, Singh RD, Mishra SK, Bhunya PK (2005) Ann-based sediment yield river basin models for Vamsadhara (India). Water research 31 (1): 95-100.
- Ekpete OA, Edori OS, Kieri BSI (2019) Assessment of heavy metals concentrations in surficial water of Silver River, Southern Ijaw, Bayelsa State, Niger Delta, Nigeria. Journal of Basic and Applied Research International 25(4): 186-193.
- Turekian KK, Wedepohl KH (1961) Distribution of elements in some major units of the earth’s Crust. Bulletin of Geology Society of America 72(2): 175-192.
- Jenyo OA, Oladele AH (2016) Heavy metals assessment in water, sediments and selected aquatic organisms in Lake Asejire, Nigeria. European Scientific Journal 12(24): 339-351.
- Wu G, Wang G, Wu J, Fu Q, Liu C, et al. (2014) Sources of heavy metals in surface sediments and an ecological risk assessment from two adjacent plateau reservoirs. PLoS One 9(7): e102101.
- Marcus AC, Edori OS (2016) Assessment of contamination status of Bomu and Oginigba Rivers, Rivers State, Nigeria, using some trace metals and Callinectes gladiator as indices. Chemical Science International Journal 17(4): 1-10.
- Sindayigaya E, Cauwnbergh RV, Robberecht H, Deelstra H (1994) Copper, zinc, manganese, iron, lead, cadmium, mercury, and arsenic in fish from Lake Tanganyika, Burundi. Science and Total Environment 144(1-3): 103-115.
- Shanbehzadeh S, Vahid DM, Hassanzadeh A, Kiyanizadeh T (2014) Heavy metals in water and sediment: A case study of Tembi River. Journal of Environmental and Public Health 1: 1-5.
- Owamah HI (2013) Heavy metals determination and assessment in a petroleum impacted river in the Niger Delta region of Nigeria. Journal Petroleum and Environmental Biotechnology 4: 1.
- Nwineewii JD, Edori OS, Onochukwu PUG (2018) Concentration, ecological risk and enrichment factor assessment of sediments from the New Calabar River, Rivers State, Niger Delta, Nigeria. Journal of Applied Science and Environmental Management 22(10): 1643-1647.
- Edori OS, Edori ES (2012) Effect of automechanic works on lead and iron in two mechanic villages in port harcourt, rivers state Nigeria. Journal of Applied Science and Environmental Management 16(4): 317-321.
- Freda J (1991) The effects of aluminum and other metals on amphibians. Environmental Pollution 71: 305-328.
- Decena SCP, Arguelles MS, Robel LL (2018) Assessing heavy metal contamination in surface sediments in an urban river in the Philippines. Polish Journal of Environmental Studies 27(5): 1983-1989.
- Loska K, Wiechuła D, Korus I (2004) Metal contamination of farming soils affected by industry. Environment International 30: 159-165.
- Purushothaman P, Chakrapani GJ (2007) Heavy metals fractionation in Ganga River sediments, India. Environmental Monitoring and Assessment 132(1-3): 475-480.
- Pandey J, Singh R (2017) Heavy metals in sediments of Ganga River: Up- and downstream urban influences. Applied Water Science 7:1669-1678.
- Sivakumar S, Chandrasekaran A, Balaji G, Ravisankar R, et al. (2016) Assessment of heavy metal enrichment and the degree of contamination in coastal sediment from South East Coast of Tamilnadu, India. Journal of Heavy Metal Toxicity and Diseases 1(2): 1- 8.
- WHO (2011) Guidelines for drinking water quality (4th Edn), WHO Press, Switzerland.
- Duruibe JO, Ogwuegbu MC, Egwurugwu JN (2007) Heavy metal pollution and human biotoxic effects. International Journal of Physical Sciences 2(5): 112-118.
- Kpee F, Edori OS, Okotume SC (2019) Geo-accumulation and ecological risks of heavy metals in sediments of Andoni River, Rivers State, Niger Delta, Nigeria. International Journal of Research and Scientific Innovation 6(8): 197-202.
- Sivaperumal P, Sankar TV, Viswanathan NPG (2007) Heavy metal concentrations in fish, shellfish and fish products from internal markets of India vis-a-vis international standards. Food Chemistry 102: 612-662.
- Yisa J, Jimoh T (2010) Analytical studies on water quality index of River Landzu. American Journal of Applied Sciences 7(4): 453-458.
- Amadi AN (2012) Quality assessment of Aba River using heavy metal pollution index. American Journal of Environmental Engineering 2(1): 45-49.
- Ogamba EN, Ebere N, Izah SC (2017) Heavy metal concentration in water, sediment and tissues of eichhornia crassipes from Kolo Creek, Niger Delta. Greener Journal of Environmental Management and Safety 6(1): 1-5.
- Boszke L, Sobczyński T, Głosińska G, Kowalski A, Siepak J, et al. (2004) Distribution of mercury and other heavy metals in bottom sediments of the middle odra river (Germany/Poland). Polish Journal of Environmental Studies 13(5): 495-502.
- Medrano MR, Barbosa JMA, Reyes LH, Hernández RA, Acuña AK, et al. (2010) A preliminary study of the distribution and mobility of mercury in water and sediments from the San Juan River watershed, Nuevo Leon Mexico. Journal of Chilean Chemical Society 55(4): 486-490.
- Lacatusu R (2000) Appraising levels of soil contamination and pollution with heavy metals. European Soil Bureau Research Report 4: 393-402.
- Mortuza MG, Al Misned FA (2017) Environmental contamination and assessment of heavy metals in water, sediments and shrimp of Red Sea Coast of Jizan, Saudi Arabia. Journal of Aquatic Pollution and Toxicology 1(1): 1-8.
- Mandeng EPB, Bidjeck LMB, Bessa AZE, Ntomb YD, Wadjou JW, et al. (2019) Contamination and risk assessment of heavy metals, and uranium of sediments in two watersheds in Abiete-Toko gold district, Southern Cameroon. Heliyon 5(10): 1-11.
- Wojciechowska E, Nawrot N, Walkusz M, Matej ŁK, Pazdro K, et al. (2019) Heavy metals in sediments of urban streams: Contamination and health risk assessment of Influencing factors. Sustainability, 11(3): 1-14.
- Cheng Q, Wang R, Huang W, Wang W, Li X, et al. (2015) Assessment of heavy metal contamination in the sediments from the Yellow River Wetland National Nature Reserve (the Sanmenxia section), China. Environmental Science and Pollution Research 22(11): 8586-8593.
- Moslen M, Ekweozor IKE, Nwoka N (2018) Assessment of heavy metals pollution in surface sediments of a tidal creek in the Niger Delta, Nigeria. Archives of Agriculture and Environmental Science 3(1): 81-85.
- Fiori FC, Rodrigues APC, Santelli RE, Cordeiro RC, Carvalheira RG, et al. (2013) Ecological risk index for aquatic pollution control: A case study of coastal water bodies from the Rio de Janeiro State, southeastern Brazil. Geochimica Brasiliensis 27(1): 24-36.
- Cheng Q, Wang R, Wang H (2012) Investigation of the heavy metal contamination of the sediments from the yellow river wetland nature reserve of Zhengzhou, China. Iranian Journal of Public Health 41(3): 26-35.
- Islam MS, Ahmed MK, Raknuzzaman M, Habibullah AMM, Masunaga S, et al. (2015) Metal speciation in sediment and their bioaccumulation in fish species of three urban rivers in Bangladesh. Archives of Environmental Contamination and Toxicology 68(1): 92-106.
© 2021 Edori OS. This is an open access article distributed under the terms of the Creative Commons Attribution License , which permits unrestricted use, distribution, and build upon your work non-commercially.
Editor In Chief


.jpg)


Signup for Newsletter

Quick Links
 Editorial Board Registrations
 Submit your Article
 Refer a Friend
 Advertise With Us
Our Recent Edition

.jpg)


Top Editors


.jpg)


.bmp)
.jpg)
.png)
.jpg)


.jpg)


.png)

.png)


.png)


Financial Support

Sponsors

Latest e-Books

Latest Video

 a Creative Commons Attribution 4.0 International License. Based on a work at www.crimsonpublishers.com.
Best viewed in
a Creative Commons Attribution 4.0 International License. Based on a work at www.crimsonpublishers.com.
Best viewed in