
- About Us
- Information
-

The Author ensures that the research has been conducted responsibly and ethically with adherence to all relevant regulations. read more..
- For Authors
- For Reviewer
- Manuscript Guidelines
- Membership
- Publication Ethics
-
- Journals
- Reprints
- e-Books
- Videos
- Policies
- Contact Us
 COVID-19
- Submissions


Full Text
Environmental Analysis & Ecology Studies
Application of GIS for the Spatial Correlation Analysis of Air Pollution and Green Space Distribution in Tabriz City
Naghmeh Mousakhani1, Bakhtiar Feizizadeh2* and Ali Mohammad Khorshiddoust3
1Department of Remote sensing and GIS, Iran
2Institute of Environment, Iran
3Department of Climatology, Iran
*Corresponding author: Bakhtiar Feizizadeh, Institute of Environment, Iran
Submission: May 11, 2020Published: December 21, 2020

ISSN 2578-0336 Volume7 Issue4
Abstract
Urbanization and population growth in Tabriz over the years and the presence of environmental pollution in the city introduced green space and its expansion as one of the most important factors in the reduction of pollutants. Various functions of the green spaces necessitate spatial distribution analysis in Tabriz city. In this regard, the green spaces of Tabriz, a part of the city’s image, are considered as a respiratory lung and play an effective role in the urban landscape and beauty, undermining the effects of contaminations and distribution of pollutants as well as air quality of the city. Accordingly, paying attention to the issue of air pollution and the analysis of distribution of the concentration of each pollutant particles (NO2s, SO2s, PM10, O3, CO) in developing countries like Iran with increasing number and size of cities and population rapid availability in the main and old places of the city provide awareness of the main sources of air pollution. In this research, the Sentinel 2A Satellite image was used to identify the green space zones. First, the required bands (2,3,4 and 8) were corrected geometrically and then, by applying texture algorithm (Glcm Contrast 0), the vegetation of Tabriz city was identified and classified. To check the accuracy of the classification, the kappa coefficient and the total accuracy (nearly one) were calculated. On the other hand, data from the six air pollution monitoring stations of Tabriz were used and the parameters were sampled and analyzed for 24 hours. All the data were collected from 2006 to 2016 and using the IDW method, the concentration map of each particle distribution was prepared. Finally, the analysis of the maps was performed using the Zonal Statistic function. Results from the analysis of the maps and remote sensing algorithms indicate that the spatial distribution of green spaces in the ten districts of Tabriz has not followed the pattern of air pollution. In most polluted areas of the city, the use of green spaces is not appropriate and there is a direct relationship between the distribution of green spaces and air pollution. The center and west districts of Tabriz are the main sources of air pollution where the distribution of green spaces is asymmetric.
Keywords: Urban environment;Pollution mapping; Sentinel 2A Satellite image;Classification;Interpolation; Tabriz
Introduction
The quality of the climate in high populated areas and urbanization is basically due to the lack of parks Escourrou[1]. High population density, especially in large cities, population growth, large buildings and urban transport modes create unpleasant conditions for humans. In addition, urban areas are affected by concrete fabric[2]. and this trend has a new representation in developing and third world countries. The growing trend of cities has created an abnormal environment and establishment of the new urban green spaces seems essential in recent years. Urban green space, as an important part of urban ecosystems, perform various functions such as cleaning of the atmospheric pollutants, establishing recreational space for residents, etc.[3,4]. Ecologists, economists, social scientists, and planners consider the city’s green spaces as private and open public spaces in urban areas covered mainly by vegetation and are used as direct functions (for example, active or inactive recreational areas) or indirect functions (a positive impact on the urban environment). Green spaces in urban systems include parks, gardens, and planting along the streets. Green space can be classified into three levels: 1- regional level, 2- city level and 3- neighborhood level. It is necessary to preserve the suitable open spaces and maintain communication between open spaces to make them suitable for the urban sustainability at any level Karade et al. [5]. In addition, urban green spaces play an important role in solving various environmental problems, including loss of biodiversity, water pollution, soil erosion and cooling of the temperature (thermal islands) [6,7].
Because of the rapid urbanization in developing countries, urban managers and planners encounter problems in providing basic services such as green spaces and water supply, transportation, and primary health care centers etc. In the urbanization process, urban green space coverage has not been sufficiently responsive to meet the needs of the people due to growth of population and expansion of construction industry Cetin [8]. The green spaces are areas with natural or handmade plantings. They are expanding by the city’s development mainly of gardening and the environment. GIS plays a key role in the user analysis of green space lands [8].Evaluation of the urban green space is an important measure for the environment and can provide the basis for planning and optimization. From the point of view of quantitative analysis, the urban green space of each country has its own indicators for quantifying which can be used to measure the health of urban ecosystem related to the urbanization process[9,10].Green space can be one of the most important ecological functions of urban green space in protecting the environment, biodiversity, reducing air pollution as well as noise pollution, tempering the air, shading and microclimate adjustment, helping to calm flood currents and increasing water quality, creating permeability levels for water absorption, and creating opportunities for historical and environmental studies Scottish [10]. In most discussions, it has been emphasized that the parks and urban green spaces are very important solutions for improving the quality of urban social life Girarde [11].
On the other hand, air pollution is considered as one of the main management challenges in Iran and rapid urban growth in recent decades has been done in a way that it is considered proportional to the urban space and infrastructure required by cities and as a result failure in the service distribution system is seen. Providing fair access to the green space is an important urban-centric policy goal WHO [12].The urban environmental assessment conducted by European environment agency shows that urban green space can eliminate environmental hazards and promote health (EEA 2015). The quality of urban air is considered as a health concern, since people in the world who live in urban areas were45% in 2014 and this value can reach 66% by 2050 [13]. Dust or suspended particles are solid that has not only human but also natural origin [14,15]. In developing countries, environmental pollution and human exposure to dust or suspended particles have increased significantly over the past decade [16].
Urban green space plays an effective role in landscape, city beauty, cleanliness, air conditioning, attenuating the effects of pollution and prevention of unplanned construction as well as distribution and rest. Standard per capita in green space is considered as one of the indicators of development in countries. World Health Organization recommends a minimum of 9 square meters of green space per person and a desirable per square foot of 50 square meters. These statistical values are consistent with UGS standards. The relationship between sustainable cities and better health, key health indicators for monitoring the progress and success, value added indicators for health indicators and data reports through mutual issues (such as equity of stakeholders, policymaking, and climate change), number of green plants and green space available in cities and towns. Urban areas can be a link between the World Health Organization’s UGSvalues with social and environmental dissatisfaction [17-19]. Proper vegetation and green space play a vital role in absorbing air and produce oxygen therefore adjusting the temperature and create a good urban landscape. According to a study by Gorbani [20] in an area of one square mile, 28 percent of the smoke density was decreased. In an urban treeless area, average 850m/g dust in a day (annual average) and in the city side of country due to the green space, the amount of dust was less than 100mg per day.
In Iran, the proposed per capita of the city-level parks and green spaces is over 8 square meters according to the Ministry of Housing and Urban Development. However, this rate varies among Iranian cities due to weather conditions, climatic characteristics, and access to water. Thus, increase in the concentration of pollutants has become a great challenge in the management of metropolises like Tabriz. Information on the spatial distribution of pollutants contamination in the city allows metropolitan managers to take appropriate measures for the reduction of the risk to areas and for the improvement of urban air quality using green space. GIS, as the main geographic analytical technology, is widely utilized to identify the rules governing the interaction between humans and the environment. Therefore, it is necessary to carry out research to measure the quantity and quality of urban spaces and conduct environmental studies including distribution estimation of air pollution and identification of pollution centers by spatial urban green space distribution using different scientific approaches.
Case Study
Introducing the studied area of Tabriz
The case study with an area of 250590km2 is in the center of East Azerbaijan province which is in the northwest of Iran. This city is bounded by Mount Einali on the north, Tabriz Plain on the west and the Sahand Mountain on the south. It has cold and long winters and due to the presence of western mountain range, which prevents the penetration of humid Mediterranean air into Iran, the rainfall is mostly snow and generally the short spring separatesthe summer and winter seasons in the area.A survey of the results of air pollution monitoring stations shows that Tabriz air pollution is mainly due to suspended pollutants less than ten Microns, Carbon Monoxide, Ozone, Nitrogen Dioxide and sulfur dioxide. To examine the air quality of Tabriz city, the data was obtained from the six air pollution monitoring stations of Tabriz and the geographical coordinates of the monitoring stations are shown below. Being industrial city to have good air quality, the creation and expansion of green spaces is very important (Figure 1;Table 1).
Table 1: Location of the air pollution monitoring stations in Tabriz.

Figure 1: Location of the studied area in Tabriz city of Iran and air pollution monitoring stations.

Distribution of Tabriz industrial use
Tabriz is considered as one of the most important industrial hubs in Iran due to concentration of large manufacturing industries such as chemicals, machinery and equipment, Tabriz Refinery, Iran Bearing, Iran Tractor Manufacturing, Industrial and Machining Groups, food, textile, leather and shoes. Improper distribution of urban spaces ultimately leads to environmental anomalies and management problems. The closer the use of green spaces to urban facilities and equipment, the higher the score will be. In the figure below, distance from industries is considered relative to green space use showing that the distance of 1000 has high score and the green space closer to industries obtains high score (Figure 2).
Figure 2: Map of distance of industrial use in 20 zones of Tabriz.

Materials and Methods
In this study, a DEM height digital model map was prepared as the boundary layer of the masked city. Sentinel 2A satellite image was downloaded using Snap Software (for Sentinel 2a images) and geometric corrections were performed on bands 2, 3, 4 and 8 with10- meter spatial resolution. The satellite image cloud saturation was near zero and no atmospheric correction was required. The purpose of geometric correction is to compensate the deviations, so that the corrected shape can be adapted to the map[21]. For object-oriented classification and whole-image precision calculations, eCognition Developer 9.0 software and for obtaining texture functions, the command of the GLCM based contrast was used and the Gaussian fuzzy function was employed for forming the green space class. To perform accurate classification, precise and high kappa coefficient was obtained. By using the 24 hours environmental monitoring stations data of Tabriz (10 years period), the distribution process of pollutants (NO2, SO2, O3, CO, PM10) was identified by IDW method as atmospheric contaminants that can pollute plants and challenge the natural environment. The results of this statistic were mapped to transform an image so that it can be consistent on a system and eventually overlapped the images and maps in GIS as a spatial analyzer. Image processing and surveying of the maps were done, spatial correlation analysis of the maps was performed, and the results were obtained.
Object oriented classification and introducing top rule sets
Rule set in data mining literature is a set of definitions of data rules that are used to evaluate data and can be applied in two levels:
a) On the surface of the visual objects created by segmentations
b) At the pixel level in the images
Among the processing methods, object-oriented image processing is more accurate due to the use of spectral information and texture and content information in the classification process. In object-oriented analysis of images, the main unit of image processing is the shape of the objects or segments or parts of the image[16]. High-resolution OBIA classified images can provide detailed information about different land uses in urban areas. As an initial step in the object-based approach, segmentation is performed by selecting the optimal values for the main parameters of scale, shape, and compression. Different combinations of these parameters are used to find appropriate values[22,23]. Segmentation is the first and most important step in image classification of individual image units[24]. Segment means a group of neighboring pixels within an area whose similarity (such as numerical value and texture) is most important common criterion[25]. In order to combine the spectral and shape features, in this research multiple segmentation was performed as one of the most successful algorithms. Image segmentation within the OBIA framework was proven. As stated above, on bands 2, 3, 4 and 8 of Sentinel 2A image the required processes performed were segmented by eCognition Developer 9.0 software. For obtaining the best results in each classification, at first, the appropriate parameters of scale, shape, and compression p were selected, and by applying the GLCM texture function, the best rule set described in the software and the appropriate fuzzy function (Gaussian) were chosen. The following figure shows an example of segmentation of the studied area.(Figure 3).
Figure 3: Main image display and segmentation at scale 40, coefficient 0.6, and compression 0.4.

Classification using GLCM Contrast 0
In this method, bands 2,3,4and 8 with coefficients 1.1.1.1 were used in multiple segmentation. The parameters of scale, shape, and compaction were 0.4,0.6 and 40, respectively. The applied threshold in smaller range was equal to 1000 for the areas under vegetation in mentioned index. A part of the green space classification of the studied area is shown as follows(Figures 4&5).
Figure 4: GLCM-based contrast function in object image processing.

Figure 5: Vegetation classification map with GLCM Contrast 0.

GLCM texture functions
The occurrence of the GLCM gray surface matrix is a tabulation that shows the number of different combinations of pixel gray levels in a scene. The matrix of different events emerges from each spatial relationship. For obtaining the unchangeable direction, the sum of all 4 directions (0-degree, 1 degree, 45 degrees, 90 degrees and 135 degrees) was calculated before the estimation of texture. Vertical direction shows 0-degree angle. 91-degree angle indicates horizontal direction in software. The texture was calculated after selecting all the pixels of an image object. In addition, to reduce the boundary effects, the pixels that have direct boundary with the object (surrounding pixels with distance of 1) are considered (ECognition software guide).
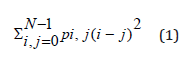
GLCM contrast
Contrast is the opposite of homogeneity. In the image, it is a measure of the local invariant magnitude that is enhanced exponentially by increasing i-j. In the following relation, the component i is the row number, j is the column number, Pi,jis the natural value in cell i and j and N is the number of rows or columns.
Using fuzzy operators in object-oriented classification
The fuzzy set theory used to eliminate data ambiguity is a new concept in which membership degree can be considered between 0 and 1[25]. Compared to binary theory which has two values of zero and one in which one pixel should be assigned to one of these two classes, fuzzy theory allows a pixel to be assigned to the multiple classes based on the membership degree[2,26]. In addition, it is an object-oriented classification method based on the fuzzy algorithm that makes the achievement of high accuracy possible as compared to the object-oriented classification without using fuzzy algorithm.
Fuzzy function (Gaussian)
The Gaussian fuzzy function is a function that assigns the input values as normal distribution between zero and one. In order to implement this function in numerical value under the Midpoint heading, it is necessary to normalize the input data between zero and one based on it and in this case, Midpoint is considered one and normalizes the larger and smaller values to zero symmetrically (Figure 6).
Figure 6: Gaussian fuzzy function curve.

Evaluation of classification accuracy
Accuracy is usually used to express the degree of “accuracy” of a classification result Dongmei et al. [27]. In order to evaluate the accuracy of the classified maps, by matching classified maps with field reality maps from field studies, error matrix was formed. Classification accuracy indicates the level of confidence in the extracted map [28]. Error matrix compares the class of the relationships between the reference data and the results obtained from the classification in square form that has rows and columns as number of classes whose accuracy is evaluated according to it[6] and the overall accuracy, user accuracy and the kappa coefficient are specified.
Total accuracy
Total accuracy is one of the simplest parameters of accuracy that does not require complex calculation operations and the overall accuracy is the average of the accuracy class that indicates the ratio of correctly classified objects to the sum of known objects. Overall classification accuracy in the land use maps extracted from satellite images should be over 85% [29] and it is computed as follows:
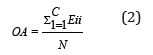
Where C is number of classes, N is total number of known objects, Eii is error matrix of diagonal members, and OA represents the total accuracy of classification.
User accuracy
It is obtained from subtraction of the number of correctly classified objects in each category by the total number of objects in that category (whole row) as followings:
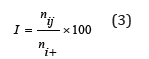
Where i: user accuracy in percent, nii: number of correctly classified segments in each class, and ni+=total number of segments that are correctly and incorrectly classified.
Kappa coefficient
It is a discrete multivariate technique that is statistically used to determine the fundamental difference of error matrix in the accuracy evaluation. The kappa coefficient, which evaluates classification accuracy relative to a random classification, varies between zero and one in which zero depicts the completely random classification and one indicates quite correct classification and if k is negative it means that the classification is weak. The kappa index is calculated as follows:
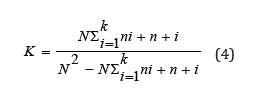
n: number of rows in the matrix, nii: number of observations in ith row and ith column on the original diameter, n+i: total observations in ith row and ith column and N is the whole observation.The following table shows that the total accuracy is 0.96 and the kappa coefficient is 0.92. (Table 2).
Table 2: Results of the evaluation of the accuracy of the green space land use classification (vegetation).

Inverse Distance Weighted (IDW)
IDW is an interpolation method that estimates cell values by averaging the sample data values within the range of each cell. In this method, the value of a quantity is obtained in points with known coordinates using the same value in other points with known coordinates [30]. The model assumes that if the known data distance from the unknown point increases, it is necessary to reduce the weights by distance. For this reason, weighing is considered based on the inverse distance[31].To use this method in the current research, several parameters have to be defined as follows:
Histogram analysis
Assessment of the data distribution after sampling helps in selecting the interpolation method. For this purpose, the histograms of the samples are plotted. The histogram provides a description of the data. The skewness represents the distribution or symmetry of the sample. The skewness coefficient for symmetrical distribution is zero and the coefficient for normal distribution is 3. If the data distribution is not normal, the following conversions can be used for the normalization[31-35].
Box-Cox conversion: This conversion is based on the following formula:
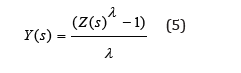
If λ≠0, the samples are assumed to be a combination of several phenomena. For this type of data, the variances depend on the mean. Thus, it helps to make the variance of the samples more uniform across the study area.
Logarithmic conversion: When λ=0 it is not used to convert the Cox box; the following formula is used.
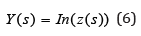
When Z(s) is 0, ln is a natural logarithm. A logarithmic conversion is used for the distribution with skewness and low sample size. If this is the case, then this conversion can uniform the variance distribution and bring the data closer to the normal distribution[31].
Power
In this method, if high power is used, the impact of the distance from the points will be increased significantly. In that case every pixel will receive the most impact from its adjacent locations. If power is reduced, the impact of farther points will increase[36-40].
Search radius
There are two fixed and variable states in this case. In the fixed state, the radius of the search interval is constant and in the variable case, the number of points for estimating the value of each used point is determined and the search continues in this situation until it finds the number of points needed for the estimation. For air pollution distribution in other points of the city, the air pollutants (NO2, SO2, PM10 and O3 and CO) of the plants that can be a factor impacting the air quality were sampled for 24 hours and the dispersion maps of each pollutant were analyzed from the average of that pollutant concentration in each station (all data were from 2006 to 2016). In this method, the wind direction effect was considered angle (227) and the distribution of each particle was normalized and appropriate power of each parameter was calculated using the optimize software. The maximum number of neighbors was considered 15 and the minimum number was considered as 10. Obviously, the best values for this should depict low error for each parameter(Figure 7).
Figure 7: shows the distribution maps of Tabriz air pollutants related to particles NO2, SO2, PM10, O3 and CO. Zoning of changes in atmospheric pollutant concentration in Tabriz monitoring stations, A) Zoning of changes in mean carbon monoxide particle concentration in Tabriz monitoring stations, B) Zoning of changes in mean nitrogen dioxide concentration in Tabriz monitoring stations, C) Zoning of changes in mean ozone particle concentration in Tabriz monitoring stations, D) Zoning of changes in mean sulfur dioxide particle concentration in Tabriz monitoring stations and E) Zoning of changes in mean suspended particles concentration in Tabriz monitoring stations O3 and CO in relation to the distribution of green space in the map of 10 zones in Tabriz.

Zonal statistic
Zonal functions are functions that compute the statistical analysis of a variable in the range of one or more zones and outputs are displayed as a layer. This method performs statistical calculations for a zone based on the values of the other layers. Each map of the contamination distribution was examined by matching the vegetation map extracted in the zonal analysis. The following maps show spatial correlation analysis of particles NO2, SO2, PM10(Figure 8).
Result and Discussion
This paper has investigated the annual mean changes in concentration of each particle at different stations and manifests that SO2,NO2 and O3 have the highest concentration in zone 8 (Figure 8). The spatial distribution of green space does not follow the air pollution pattern. It should be noted that this zone of Tabriz has a population of 29384 and per capita of green space reaches 0.007 square meters and its area is 218.93. Since these particles arise from the combustion of fuels in higher degrees, domestic and commercial heat installations, inner city workshops, especially vehicles, and given the centrality and importance of this region, high traffic and intensification of the traffic and pollution, having old neighborhoods and old textures, different types of trees, there is no direct relationship between green space and air pollution ratio. Airborne CO particles due to incomplete combustion of fuel and industrialization of urban communities and lack of organization of the transportation system, the highest concentration has been reported in zones 6 and 7 (Figure 8).
Figure 8: Spatial correlation analysis of atmospheric pollutants in Tabriz, A) Spatial correlation analysis of carbon monoxide pollutants in Tabriz, B) Spatial correlation analysis of nitrogen dioxide particle in Tabriz; C) Spatial correlation analysis of ozone particle in Tabriz; D) Spatial correlation analysis of sulfur dioxide particle in Tabriz and F) Spatial correlation analysis of suspended particles in Tabriz.

In zone 6, the green space per capita is 1.5 square meters and its area is153397.20. Obviously due to the industrialization and the placement of industrial uses in this green space area,the plants do not have better performance compared to the other areas despite high green area values. In zone 7, per capita of green space is 0.26 square meters in terms of population and its total area is 41199.28, with the largest industrial centers including tractor manufacturing, petrochemical, refinery and thermal power plants that have no direct relationship between air pollution and the distribution of green space. PM10 suspended particles also show the highest concentrations in Tabriz region 3 and 1, which per capita of green space in the zone 3 equals 10.09 square meters relative to population ratio and area of 22501.82 green space indicates a low green area in this district.Tabriz district 1 has no exception and has a small green area of 10701.24 depicting that no distribution of air pollution pattern is followed in the green space distribution and also proximity to downtown, lack of green space as well as forest parks and lack of vegetation appropriate for suburb and intra-regional dust infiltration from Iraq, Syria, etc., it can be noted that all these factors exacerbate airborne particles contamination effective during storms and high winds. The central part of Tabriz which has low vegetation areas and western areas due to the factories producing pollutants are one of the most polluted hot spots in Tabriz.
Distribution of green space in these areas has been registered with the highest concentration at the Namaz Square Station and Railroad Station as the most important air pollution centers in Tabriz. One of the new problems of air pollution in Tabriz is wind and increase of concentration of air pollutants from southwest of Tabriz. Nowadays, more attention is paid to plants as part of air pollution in cities because plants absorb carbon dioxide and convert it to oxygen during carbon photosynthesis process. Also, during the photosynthesis process, the leaves of trees absorb chemicals such as ammonium nitrogen oxides produced in the air as part of sulfur dioxide and ozone, which are part of the pollution and fog and greenhouse effects problems. Leaves of trees with absorption and retention of dust and other suspended particles reduce the amount of dust and other airborne particles by 75% and has a significant impact on improving the air quality. The following table shows List of green spaces per capita in 10 zones of Tabriz[40-50] (Table 3).
Table 3: List of green spaces per capita in 10 zones of Tabriz.

References
- Escourrouon G (1991) Climate de la villa. pp. 35-65.
- Tso B, Mather PM (2001) Classification methods for remotly sensed data. Taylor and Francis, London.
- Lee AC, Maheswaran R (2011) The health benefits of Urban green spaces: a review of the evidence. J Public Health 33(2): 212-222.
- Parente C (2016) Assessment of multiresolution segmentation for extracting greenhouses from WORLDVIEW-2 imagery. International Archives of the Photogrammetry, Remote Sensing & Spatial Information Sciences XLI-B7: 145-152.
- Karade RM, Satish KV, Salma Z (2017) The role of green space for sustainable landscape development in urban areas. International Archive of Applied Sciences and Technology 8(2): 81-84.
- Lillesand T, Kiefer RW, Chipman J (2014) Remote Sensing and image interpretation. Open Journal of Geology 8(2):
- Manulan Y (2003) Sustability analysis of urban green space system based on GIS. Enshede, Netherlands.
- Cetin M (2015) Using GIS analysis to assess urban green space in terms of accessibility: case study in kutahya. IntJ Sust Dev World Ecd 22(5): 420-424.
- Saeedikhah A (2004) Examination of urban facilities and equipment (post, telecommunication, fire station) and their location in the old and new fabric of Mashhad city. University of Sistan and Baluchestan, Iran.
- Scottish R (1987) Information natural heritage trends. London.
- Girarde (1992) EEA two-third of all Europeans now reside in towns or Cities, Boston, USA.
- WHO Regional office for Europe 2013 Health 2020 (2013) A European policy framework and strategy for the 21st
- Abhijith KV, Kumar P, Gallagher J, Nabola A, Baldauf R, et al. (2017) Air pollution abatement performances of green infrastructure in open road and built-up street canyon environments-a review. Atmospheric Environment 162: 71-86.
- Gantiva JAF, Barajas DEP, Rajabifar A (2017) Methodological proposal for measuring urban green space per capita in a land-use cover change model: Case Study in Bogota, pp. 1-19.
- Rupprecht CDD, Byrne JA (2014) Information urban green space: comparison of quantity and characteristics in Brisbane, Australia and Sapporo, Japan. Plos One 9: e99784.
- Rai PK (2016) Biomagentice monitoring through roadside plants of an indo-burma hot spot region. Elsevier, p. 196.
- Yan G (2003) Pixel based and object-oriented image analysis for coal free research. pp. 15-97.
- Mensah CA (2015) Sustaining urban green spaces in Africa: a case study of kumasi metro police, Ghana. University of Birmingham, England.
- Tiran J, Kallay T, Szuppinger P (2018) Baseline study on the status quo of regional UGS governance and European good practices, pp. 1-67.
- Gorbani R (2015) Principles and basics of urban planning.
- Alavi Panah SK (2003) Application of remote sensing in earth sciences.
- Aguilar MA, Aguilar FJ, Lorca AG, Guirado E, Betlej M, et al. (2016) Assessment of multiresolution segmentation for extracting greenhouses from worldview-2 imagery. International Archives of the Photogrammetry, Remote Sensing & Spatial Information Sciences, p. 41.
- Neubert M, Herold H, Meinel G (2008) Assessing image segmentation quality-concepts, methods and application. Object-Based Image Analysis, pp. 769-784.
- Huang L, Ni L (2008) Object-oriented classification of high-resolution satellite image for better accuracy, proceedings of the 8th international symposium on spatial accuracy assessment in natural resources and environmental science, Shanghai, China, pp. 211-218.
- Feizizadeh B (2007) Comparison of basic and object- oriented pixel methods in land use mapping. Tabriz University, Iran.
- Safaian A, Khoda KL (2010) Land use mapping using fuzzy classification, case study of three areas of kabtarahang, razan-ghahavand and khajein-talkhab in Hamedan Province. pp. 95-114.
- Dongmei H, SHoujue XU, Jinqqi S, Suling L, Wei S, et al. (2017) Accrue assessment model for classification result of remote sensing image based on spatial sampling. Journal of Applied Remote Sensing 11(4): 046023.
- Anderson JR, Hardy EE, Roach JT, Witmer RE (1976) Land cover classification system for use with remote data. pp. 80-85.
- Anderson JR, Hardy EE, Roach JT, Witmer RE (1976) A land use and land cover classification system for use with remote sensor data, pp. 1-28
- Hutchinson MF (1993) On thin plate splines and kriging. In: Tarter, Lock (Eds.), Computing science and statistics. Interface foundation of North America, USA, pp. 104-113.
- Abdulwajid M, Mehmood K, Shakoor A, Qalib A (2016) Evaluation different interpolation techniques in GIS for ground water quality mapping. Department of Agricaltural Engineering.
- Valizadeh KKH, Khorrami B (2018) Principles and concepts and analysis of digital earth models. University of Tabriz Publications.
- Adinlofi C, Suarez CGP, Carinanos P (2014) Relation between visitors behaviour and characteristics of green space in the city of Granada, south-eastern spain. CABI 13: 534-542.
- ECognition software guide.
- Europpean environmental agency.
- Ferreira BL, Demiguel E (2005) Geochemistry and risk assessment of street dust in Luanda, angola: a tropical urban environment. Atmos Environ 39(25): 4501-4512.
- Iran Statistics Center (2016) Excerpts of the year 2016 country census.
- Larson LR, Jenning V, Cloutier SA (2016) Public parks and wellbeing in urban areas of the United States. PlosOne 11: e0153211.
- Lovell ST, Taylor JR (2013) Supplying urban ecosystem services through multi-functional green infrastructure in the United States. Lands Ecol 28: 1447-1463.
- Nero BF (2017) Urban green space enhance carbon sequestration and conserve biodiversity in cities of the global south case of Kumasi, Ghana.
- Ngom R, Gosselin P, Blais C, Rochette L (2016) Type and proximity of green spaces are important for preventiny cardiovascular morbidity and diabetes- a cross-sectinal study for Quebec, Canada. Int J Environ Res Public Health 13(4): 423.
- Rai PK, LS (2014) Dust capturing potential and air pollution to lerance in dex (APTI) of some roadside tree vegetation in Aizawl, Mizoram, India: an India Burma hot spot region. Air Qual Atmos Health 7(1): 93-101.
- Rai PK (2013) Environment magnetic Studies of particulates with special reference to biomagentice monitoring using roadside plant leaves. Atmos Environ 72: 113-129.
- Santiago L, Verdejo OJC, Santiago BR, Melendez AEJ, Garcia MDC (2014) Access and underuse of ecological amenities in urban parks of the rio piedras Watershed. Ecol Soc 19(1): 26.
- (2012) World health indicators of sustainable cities in the context of the rio+20un conference on sustainable development WHO Geneva, Switzerland.
- Zendehdel (1994) Studies and planning of tourism in East Azerbaijan. Management and Planning Organization Publications of East Azerbaijan Province. Iran.
- Lisetskii F, Borovlev А (2019) Monitoring of emission of particulate matter and air pollution using Lidar in Belgorod, Russia. Aerosol and Air Quality Research 19(3): 504-514.
- Pomortseva O, Kobzan S, Yevdokimov A, Kukhar M (2020) Use of geoinformation systems in environmental monitoring. Easy Chair, p. 6.
- Tuzin B, Leeuwen E, Rodenburg C, Peter N (2002) The pulsar effect. Paper presented in 38th International, Planning Congress on Planning with Peaks, Glifada, Athens, Greece, pp. 32-39.
- Lissland TM, Kiefer RW (2001) Remote sensing and Image Interpetation. In: Wiley J (Ed.), (4th edn), Andsons inc, ISBN: 0471255157, London, UK, p. 736.
© 2020 Bakhtiar Feizizadeh. This is an open access article distributed under the terms of the Creative Commons Attribution License , which permits unrestricted use, distribution, and build upon your work non-commercially.
Editor In Chief


.jpg)


Signup for Newsletter

Quick Links
 Editorial Board Registrations
 Submit your Article
 Refer a Friend
 Advertise With Us
Our Recent Edition

.jpg)


Top Editors


.jpg)


.bmp)
.jpg)
.png)
.jpg)


.jpg)


.png)

.png)


.png)


Financial Support

Sponsors

Latest e-Books

Latest Video

 a Creative Commons Attribution 4.0 International License. Based on a work at www.crimsonpublishers.com.
Best viewed in
a Creative Commons Attribution 4.0 International License. Based on a work at www.crimsonpublishers.com.
Best viewed in