
- About Us
- Information
-

The Author ensures that the research has been conducted responsibly and ethically with adherence to all relevant regulations. read more..
- For Authors
- For Reviewer
- Manuscript Guidelines
- Membership
- Publication Ethics
-
- Journals
- Reprints
- e-Books
- Videos
- Policies
- Contact Us
 COVID-19
- Submissions


Full Text
Environmental Analysis & Ecology Studies
Developing Composite Urban Respiratory Health Index for Lucknow Municipal Corporation
Ganesh Y*, Singh RB, Pandey BW and Aakriti G
Department of Geography, India
*Corresponding author: Ganesh Yadav, Department of Geography, India
Submission: June 01, 2020Published: November 30, 2020

ISSN 2578-0336 Volume7 Issue4
Abstract
The Composite Urban Respiratory Health Index (CURHI) is a flexible tool for presentation of data related to respiratory health. This facilitates visual presentation and provides statistical insight into respiratory health profile of a particular geographical unit. Ambient air pollution in the urban environment is a major health issue. This is more acute in the developing country like India. Combined with other socio-economic and health related parameters, there appears a composite picture of vulnerability across different geographic units. Lucknow being one of the worst affected cities by air pollution, grapples with the same sort of issue due to its varied health related indicators’ performance. This study attempts to present a combined respiratory health related picture across all the wards of Lucknow Municipal Corporation. This sheds light upon the intra-urban variability of data on international standards. This would be helpful in understanding the gaps in respiratory health profile in an urban area and provide critical insight in urban planning in sustainable ways.
Keywords: CURHI, Health Indicators, Ambient Air Pollution
Introduction
Urban Ambient air pollution is a severe environmental challenge mostly found in high concentration in the low- and middle-income countries [1,2]. Studies in Indian cities, particularly large cities revealed that ambient air pollution concentrations are at alarming levels. This can be a cause of serious health complications. In the recent years, megacities, particularly in Asia have witnessed a monumental growth but it is accompanied by surface temperature change, air pollution and serious health issues [3-15]. Many Indian cities including Lucknow are facing the similar situation [6,7,16-21]. Severe exposure of air pollution is associated with a range of health effects i.e. from minor physiologic symptoms to mortality and morbidity from respiratory and cardiovascular diseases which are chronic in nature [8,22-26].
The Composite Urban Respiratory Health Index (CURHI) provides a suitable approach for identification, selection, calculation and presentation of respiratory health related information. The output is useful for decision makers, health workers, program managers and academic researchers to understand the gaps and address them in the selected pockets of urban areas. This will have positive impact on change assessment, consequent program intervention and overall urban improvements [27]. The basic idea of composite Health Index is developed by a series of conferences commissioned by Centre for Health Development, WHO [28]. CURHI is a specific index that denotes the respiratory health of people living in a particular areal unit. This index has been developed by combining eight important indicators that are crucial for a respiratory health. Higher the value of the index, higher the standard of respiratory health in that particular area. Likewise, lower value of CURHI denotes the lower level of respiratory health. These indicators have been chosen on the basis of certain criteria i.e. availability of data, reliability, applicability and flexibility of data. This method of calculating CURHI has been taken from approach used by the Human Development Index (HDI).
The Study Area
Lucknow is the capital city of the Uttar Pradesh, which is located along 26o52’ N and 80o 56’ E at 120 m above sea level in the middle of Gangetic plain [10]. The Gomti River, a tributary of Ganges, meanders through the city. The city is surrounded by Barabanki, Unnao, Raebareli, Sitapur and Hardoi districts in the east, west, south and north directions respectively. The city has population close to 2.8 million and is fact pacing other cities due to rapid rate of industrialization and commercialization (Census of India, 2011). The climatic year in the city is divided into three distinct seasons i.e. summer (March-June), monsoon (July-October) and winter (November-February). For better administration, city is divided into 110 wards (Census of India, 2011) (Figure1).
Figure 1: (a) Location of the study Area in India and Uttar Pradesh, (b) Ward boundaries in study area of Lucknow.

Indicators and Rationale for Selection for the Index
While selecting indicators for CURHI, few major criteria are applied based on the major theme of this research i.e. air pollution, health and environment. So, indicators must be related to the topic. Based on the theme, six domains comprising of eight indicators were selected and composite index was calculated (Figure 2). PM10 is taken as the first indicator and it has been given 30 percentage weighted ratio in the final calculation of CURHI. The rationale for choosing PM10 is that data was available for each month since 2008, hence the observation period is long. This pollutant has also been very high in comparison to the NAAQS and WHO standards by more than 8-10 times. Thus, reliability, range, long period and spatial distribution are major criteria while choosing it as the first indicator for CURHI [29-34].
Figure 2: Domains and indicators used for calculation of CURHI.

The second indicator is population density, which is a very important factor that denotes the pressure of population upon the resources available on a geographical space. Besides, it shows congestion of settlements in general and people in particular. The major rationale for choosing this indicator is that closely-knit settlements and dense population distribution also indicate the dense human activities and resulting to more dust generation and potential health impact. It accentuates the process of spreading the contagious diseases and infection that are risk factors to health. Percentage of slum population is the third indicator. Slum is generally characterized by dirty streets, unauthorized occupation of land particularly roadside, along dumping sites, beside the railway tracks, unhealthy living style, poor drains, shanty colonies and people are engaged in works of informal nature. Unhygienic conditions in slums are a potential risk factor for health and therefore slums are potential locations for disease outbreaks. Added to this is the poor nutritional status and low capacity in terms of financial strength to cope against the diseases and associated risk factors. Literacy rate is the fourth indicator for CURHI. Being an indicator of Human Development Index also, it is an important indicator to know the levels of awareness regarding the pollution and its potential health impact. The fifth important indicator is road density and it is expressed in length/km2.
Since vehicles are mobile in nature and it is very difficult to track their movement in different wards. This opens the scope for road density to be taken as an indicator. Higher the road density, higher the probability of traffic movement, nevertheless it is not necessary that high road density will always indicate high traffic volume. Looking at this point from probability lenses, there is very high likelihood that traffic volume is high because roads are constructed for smoother mobility and as city gets denser, more roads are constructed to cater the volume of traffic. These roads include small length roads and big roads i.e. state highways and national highways. The data for road density is available according the zones and average value for each ward is obtained by dividing the density of road in a zone to the number of wards in that zone. Since health is another pillar of this research, number of hospitals in the city is the sixth important indicator. Both private as well as public hospitals have been included in the total number of hospitals. Since ward wise data for all hospitals is not available, it becomes a daunting task to get the final number. There are two different lists of private and public hospitals supplied by National Urban Health Mission (NUHM), Lucknow and Lucknow Nursing Home Association.
By locating them on google maps, the final figure of total number of hospitals from each ward is obtained. Total park area in each ward is reflective of available green space essential to maintain individual and environmental health. From the data on park area for each zone, ward wise park area is calculated by dividing the total park area in each zone to number of wards in each zone. Thus, area of park in each ward is just the average value, rather than the exact figure. Primary garbage collection is the last important indicator of CURHI. Open dumping of garbage pollutes the air and infects respiratory system severely. Open dumping also clogs internal drainage system of the city and slows down the flow. This creates severe clogging and festering which results into pollution of air.
Data Sources
Table 1: Sources and nature of data.

Conceptuality, validity, sensitivity, specificity, feasibility, reliability, sustainability, understandability, timeliness, and flexible have been kept in mind while selecting the indictor as well as data set. Data for PM10 is taken from UP Pollution Control Board from 2008 to 2017 from all seven stations across the city. The annual average from 2008 to 2017 have been averaged to get cumulative annual average in µg/m3. Interpolation techniques is used to assign readings to the surrounding wards in such manner as no ward is left unserved, more less in circular fashion. Data for population density is taken Census of India, 2011 for each ward of the city. Percentage of slum population for each ward is taken from Rajiv Aawas Yojana Slum Free city program, 2012. Data for literacy rates is taken from Census of India, 2011. Road density data for each ward is taken from Lucknow Municipal Corporation (LMC), 2015. Data of hospitals is generated by combining two different lists of hospitals one each for Private and government hospitals. Government hospitals number is given by NUHM Lucknow, Government of Uttar Pradesh, 2013-14. Private hospitals’ number is released by Lucknow Nursing Home Association, 2016. Both of numbers are combined and placed on google maps to get the exact location, based on which a ward wise dataset is prepared. This hospital data excludes private clinics and quacks and counts only the major hospitals with significant beds and health infrastructure. The source for park area is again LMC which provides the zone wise park areas in hectares and average park area for each ward is obtained. Lastly, ward wise primary garbage collection figures are taken again from LMC by averaging out share of each ward from the respective zone (Table 1).
Methodology of Calculating CURHI
The methodology for calculating CURHI is similar to that of calculating Human Development Index (HDI) by UNDP and UHI (Urban Health Index) by WHO [35,36]. The 1st step is selecting an indicator. It is important to select the indicator that would do justice to the CURHI, though data availability is an important consideration as well. Selecting the domains such as population, pollution, health and income is the first step. Nested within the domains are indicators such as PM10, density, literacy rates, etc. (Figure 2). The 2nd step is to select geographical unit of analysis. There are six zones in Lucknow, but the vastness of zones makes them less relevant for analysis. Hence wards, that are 110 in total, seem significant and most suitable unit for intra-urban study. It is desirable to select the wards of city, as these are most relevant administrative and geographical units. The 3rd step is to collect data and arranging them in excel sheet in three different sets.
First set comprise of raw data according the ward numbers. This has to be done by putting area code and area name before entering values for each indicator. The second set of data is arranged as per ascending or descending order. One difficult challenge is the changing nature of boundaries of wards before each election which is the limitation of selecting these wards. The third important step is to collect data and arranging them in excel sheet in three different sets. First set comprise of raw data according the ward numbers. The second set of data is arranged as per ascending or descending order. It is necessary to reverse the values of indicators, which have inverse relation with CURHI. The third set of data is prepared by applying the formula for the standardization once all sets are ready, CURHI is calculated. Standardization of indicators is the next step to neutralize the scale effect of various indicators. The following set of formula is applied:
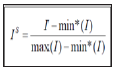
Here, I is the value of an indicator for a unit. while max (I) is maximum value of same indicator and min*(I) is the minimum value of same over all units, minus a small value or alternatively chosen value. The I S is the standardized value of I that will satisfy 0<I S≤1. HDI has designated the min*(I) and max(I) as “goalposts” for better statistical understanding [35,36].
In different situation min* can be zero as this would be more interpretable. There are some considerations for choosing the min*(I), i.e. the min*(I) must be less than minimum of the observed distribution of the index to make I S strictly positive (that is, > 0). Secondly, min*(I) should be defensible for decision related considerations. The I S is unaffected by the choice of min*(I), albeit, it influences the ranking/order for some units. Thus, 0.01 has been subtracted from each min*(I) to keep value higher than zero and lower than 1. Once the standardized values are obtained for all units of each indicator (8), the next step is to calculate final CURHI. CURHI of all indicators is obtained by getting the geometric mean of the standardized values by using the following formula:
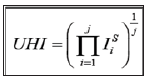
Here, j is the number of standardized indicators. The applicability of geometric mean for the purpose of the UHI or CURHI facilitates that a given fractional change in any indicator has the same potential effect on the final output or geometric mean. This is regardless of the indicator’s range. Lastly, mapping and analysis of CURHI values involves application of GIS program and vector data of the boundaries of wards. ArcGIS software is used to create polygons and making choropleths using CURHI attribute data for each ward. The joining of CURHI result data with shape file data program and append the CURHI result with the same is done after that, followed by making choropleth maps based on CURHI values and categorize them in to five classes based on quintile rule i.e. examining the 10 percent upper unit and 10 percent lower units.
Results and Analysis
Figure 3: Annual Average (2008-2017) PM10. Source: Uttar Pradesh State Pollution Control Board (2017).

By looking at PM10 concentration, it can be inferred that almost all locations city shows the average annual (2008-2017)183 ug/m3 and above which is in general beyond the WHO and NAAQS limits. Some locations have values as high as 230 ug/m3 such as ward no 76, 93, 94, 34, 96, 100 in the central zone, 90, 109, 105, 107 in north central area, ward no 6 in north eastern area, and ward no 4 and 15 in the south western area. All together nearly 40 wards have average annual concentration of 230 ug/m3 and nearly 80 wards have values ranging from 180 ug/m3 to 230 ug/m3. The maximum particulate matter pollution is visible in the central wards which is primarily due to dense locality and concentration of commercial hubs. This is accentuated due to the least concentration of vegetation cover. Some peripheral location such as ward number 6 has the maximum level due to Chinhat industrial location. The ward number 30 and the nearby area has the high concentration due to Khursi industrial area. The western and west central part has Talkatora industrial location causing high concentration of PM. The southern ward number 16 has the Sarojni Nagar Industrial belt on Kanpur-Lucknow Road (Figure 3).
Density ranges from minimum 12 persons/km2 to maximum 1,531 persons/km2. Depending upon the representational point of view, there are five categories i.e. below 100, 100-200, 200-300 and above 400. While 46 wards have population density below 100 persons/km2, followed by 100-200 and above 400 with 26 and 18 wards respectively. There are only 18 wards with density value more than 400 and it is to be noted that they are clustered in the central part of the city. This cluster of high density coincides with the old city of nawabs. Most notable wards are 13, 45, 46, 79, 86, 89, 93, 94, 95, 97, 100, 104, 107, 110 (Figure 4).
Figure 4: Population density. Source: Census of India, 2011.

Majority of slum population is concentrated in the central as well as eastern and south- eastern part of the city. Only three wards i.e. 14, 67, 110 have over 8- per cent of slum population. Ward numbers 1, 7, 10, 31, 68, 82, 94, 98, 107 have the slum population ratio between 60 to 80 per cent. The most slum free wards are located in the north, north-eastern and north western region of the city but in general, there is maximum 56 wards that have slum population’s share less than 20 per cent and the rest 54 wards have slum population share 20 per cent and above (Figure 5). Literacy rate is categorized into 5 levels across the wards which are below 75, 75-80, 80-85, 85-90 and 90 per cent and above. The lowest literacy is found in the north-west and central wards. The central wards are characterized by 75 to 80 per cent literacy rate. Altogether, 65 wards are having literacy rates lower than 85 per cent, they are mostly located in the central and north-western parts of the city, which are also the old city inhabited by lower-middle class. The high rates are found in 48 wards clustered in the south and north-eastern parts of the city dominated by the richer educated section of the society (Figure 6).
Figure 5: Percentage of slum population. Source: Rajiv Aawas Yojana Slum Free City Program 2012, Lucknow.

Figure 6: Literacy rates in percentage. Source: Census of India, 2011.

Figure 7: Road density. Source: Lucknow Municipal Corporation, 2015

Figure 8: Number of public and private major hospitals. Source: NUHM Lucknow, 2013 and Lucknow nursing home association, 2016

Majority of wards are having road density between 8-13km/km2. The maximum road density above 18 is mainly concentrated in the central wards while the lowest road density is found in the southern part of the city having density value, that is, below 8 kms. Thus, the centrally located wards have the highest road density whereas the peripheral wards are having the least road density (Figure 7). As far as hospitals are concerned, the peripheral wards have the dispersed distribution while the central part has the predominantly clustered distribution. The identical distribution of population density and hospitals can be observed. This is also an indicator of good access to health care facilities (Figure 8). The distribution pattern of park area shows that north-western wards have lowest concentration whereas the southern and eastern wards have average park area of more than 3 hectares. The northern wards have average ward area between 2-3 hectares. The central wards have relatively lesser average area under parks that is 1-2 hectares. It is to be noted that majority of green spaces and big parks built by successive governments are primarily located in the eastern part i.e. Gomti Nagar area along river Gomti. The southern part is relatively newly developed and has extensive green cover.
Figure 9: Average park area. Source: Lucknow Municipal Corporation, 2015

Figure 10: Primary garbage collection. Source: Lucknow Municipal Corporation, 2015

Wards having more area under parks are relatively developed in terms of infrastructure in comparison to other wards of the city (Figure 9). The access to better sewage disposal and garbage collection has contrasting results depending upon status of the region as urban/per-urban/slum or other. While some wards have access to garbage disposal, others are totally devoid of the facility. Location such as wards number 29, 36, 40, 45 are posh localities and come under Gomti Nagar township which is newly developed with all the amenities. This location is in the central-eastern and eastern direction. Wards dominated by slums and poor income households without municipal corporation services shows lackadaisical attitude in garbage collection (Figure 10). Based upon the eight indicators, CURHI is developed and respective values are plotted on to the various wards using choro-chromatic map. The darker shade shows the high value while the light shade represents shows the lower value, that is, lower standard of respiratory health.
Figure 11: Composite urban respiratory health index in Lucknow municipal corporation.

There is large variability in results as range of CURHI varies from low of 0.05 to high of 0.60 and above. Based on the concentration, six classes have been developed namely very low, low, lower medium, medium, high and very high. Of the total 110 wards, majority of the (65) wards are under lower to very low level and 13 wards are under medium level whereas, only 22 wards are under high to very high level. This implies that majority of locations are having low standard of respiratory health (Figure 11). The spatial pattern of CURHI reveals that the centrally located wards have the least denoting poor state of respiratory health. The peripheral wards of western, eastern and south-west areas of the city which are primarily high-density industrial clusters with high concentration of air pollution have lower values denoting low status of respiratory health. The wards adjoining to these locations are having the medium to low values, particularly in the northern and the southern wards. This is due to high pollution levels but relatively favorable health related infrastructure and positive demographics and these are the wards of having the high standard of living, have good income status and people can avail benefits of municipal services.
Of the total, 20 percent or 15 wards have fairly good respiratory health indicators while merely 7 wards (19, 20, 21, 36, 40, 42, 88) have highest values and hence represent best quality respiratory health status indicators. It is important to understand that all 7 wards have the positive indicators i.e. lower concentration of PM10 since the last decade, maximum area under parks, maximum number of hospitals, proper garbage collection, low population density, high literacy rates, lower ratio of slum population and lower road density. This is to note that CURHI is just a composite index of 8 indicators and majority of them have data dating back to 2011 census to 2015 LMC reports. Thus, synchronization of data is missing. It would have been much better if all related data were sourced from the same year to give a more reliable picture of the respiratory health status, albeit this is still very useful in understanding the complete picture how health indicators are working on the ground and how much pollution is influencing the health dynamics across the urban spatial units.
Conclusion
It is important to note that classification of CURHI into six classes is based on obtained values by applying the highest and the lowest decile rule but if the findings were compared on international standard HDI scale, all very high CURHI (0.60 and above) would be treated as medium outcome. Surprisingly, there are only 7 wards in this category. The rest wards would fall into lower low level or in other words, 94 per cent wards have low standard of respiratory health if compared on the HDI scale globally. This is also very useful to understand the priority areas where urban planners, health experts and municipal administration can work in coordination to make urban environment sustainable and urban life livable.
References
- Zhang T, Chen Y, Xu X (2020) Health Risk Assessment of PM2.5-bound Components in Beijing, China during 2013-2015. Aerosol Air Qual Res 20: 1938-1949.
- Zhou X, Strezov V, Jiang Y, Yang X, He J, et al. (2020) Life cycle impact assessment of airborne metal pollution near selected iron and steelmaking industrial areas in China. Aerosol Air Qual Res 20: 1582-1590.
- Şahin ÜA (2020) The effects of covid-19 measures on air pollutant concentrations at urban and traffic sites in istanbul. Aerosol Air Qual Res 20: 1874-1885.
- Grover A, Singh RB (2016) Monitoring spatial patterns of land surface temperature and urban heat island for sustainable megacity: A case study of Mumbai, India using Landsat TM data. Environment and Urbanization Asia 7(1): 1-17.
- Grover A, Singh RB (2020) Urban Health and Wellbeing. Springer 33-61: 103-149, 151-177.
- Barman SC, Kumar N, Singh R, Kisku GC, Khan AH, et al. (2010) Assessment of urban air pollution and it’s probable health impact, journal of environmental biology © Triveni Enterprises, Lucknow (India) 31(6): 913-920.
- Burman SC, Singh R, Negi MPS, Bhargava SK (2008) Ambient Air Quality of Lucknow City (India) during use of Fireworks on Diwali Festival. Environ Monit Assess 137(1-3): 495-504.
- Haque, Senaul, Singh RB (2017) Air pollution and human health in Kolkata, India: A case study, Climate 5(4): 77.
- Kumar M, Singh RB, Pravesh R, Kumar P, Tripathi DK, et al. (2017) Urban growth dynamics and modeling using remote sensing data and multivariate statistical techniques, Current Science.
- Pandey P, Khan AH, Verma AK, Singh KA, Mathur N, et al. (2012) Seasonal trends of PM2.5 and PM10 in ambient air and their correlation in ambient air of Lucknow City, India. Springer Science 265-270.
- Singh RB (2006) Sustainable Urban Development, Concept Publishing Company, New Delhi, India. p. 431.
- Singh RB (2015) Urban Development challenges, risk and resilience in Asian mega cities sustainable urban future of emerging Asian mega region, Springer, Tokyo, p. 488.
- Singh RB (2001) Urban sustainability in the context of global change, Science Pub., Inc., Enfield (NH), USA and Oxford & IBH Pub., New Delhi, India. p. 282.
- Singh RB, Grover, Aakriti (2015) Analysis of urban heat island (UHI) in relation to Normalized Difference Vegetation Index (NDVI): A comparative study of Delhi and Mumbai. Environments 2: 125-138.
- Singh RB, Grover, Aakriti (2014) Remote sensing of urban microclimate with special reference to urban heat island using Landsat thermal data. Geographica Polonica 87(4): 555-568.
- Prasad D, Sanyal S (2016) Air quality and its effect on health: A Geographical perspective of Lucknow city, space and culture, India, pp. 51-64.
- Verma AK, Saxena A, Khan AH, Sharma GD (2015) Air pollution problems in Lucknow City, India: A Review. Journal of Environmental Research and Development 9:
- Balakrishnan K, Dhaliwal RS, Shah B (2011) Integrated Urban-Rural Frameworks for Air Pollution and Health-Related Research in India: The Way Forward. Environmental Health Perspectives 119(1): A12-A13.
- Horaginamani SM, Ravichandran M (2010) Ambient air quality in an urban area and its effects on plants and human beings: A Case Study of Tiruchirappalli, India. Kathmandu University Journal of Science Engineering and Technology 6(2): 13-19.
- Ghose MK, Paul R, Banerjee RK (2005) Assessment of the status of urban air pollution and its impact on human health in the City of Kolkata, Environmental Monitoring and Assessment. Springer 108: 151-167.
- Kandilkar M, Ramachandran G (2000) The causes and the consequences of particulate air pollution in Urban India- A synthesis of Science. Energy and Environment 25: 629-684.
- Mohamad Jamil PAS, Mohammad Yusof NAD, Karuppiah K, Rasdi I, Jalaludin J, et al. (2020) Malaysian traffic police in highly populated areas: Is it safe working outdoors on a daily basis? Aerosol Air Qual Res 20: 2003-2011.
- Rajput S, Arora K, Mathur R, Pandey BW (2020) Environmental psychology and health care cost: understanding the well-being level of Delhi residents. In: Sharma V, Chandrakanta (Eds.), Making Cities Resilient. The Urban Book Series Cham. Springer. Springer Nature Singapore Pte Ltd 2020.
- Pandey BW, Mishra H, Pathak UK (2019) Planning for healthy and sustainable urbanization: A case study of national capital territory, Delhi. In: Sharma VR, Chandrakanta (Eds.), Making Cities Resilient, The Urban Book Series.
- Wang H, Lindgren HW, Lofgren KT, Rajaratnam KJ, Marcus JR, et al. (2012) Age-specific and sex-specific mortality in 187 countries, 1970-2010: A systematic analysis for the Global Burden of Disease Study 2010. Lancet 380(9859): P2071-P2094.
- Enger ED, Smith BF (2000) Environmental science: A study of interrelationships (7th edn), McGraw-Hill, Boston, USA.
- WHO (2014) The Urban Health Index: A handbook for its calculation and use. World Health Organization Center for Health Development. WHO, Kobe, Japan.
- Rothenberg R, Weaver SR, Dai D, Stauber C, Prasad A, et al. (2014) A flexible urban health index of small area disparities. J Urban Health 91(5): 823-835.
- Census of India (2011) Ward wise Literacy Rates in Lucknow Municipal Corporation. Census of India, Lucknow, India.
- Census of India (2011) Ward wise Population Density in Lucknow Municipal Corporation. Census of India, Lucknow, India.
- Lucknow Municipal Corporation (2015) Final Report: Revised City Development Plan for Lucknow City 2040, Lucknow, India.
- Lucknow Nursing Home Association (2016) List of members from different private hospitals, Lucknow, LNHA, India.
- NUHM Lucknow City (2013) Program Implementation Plan in Lucknow City, National Urban Health Mission. Urban Health Initiative, Lucknow, NUHM, India.
- Rajiv Aawas Yojana (2012) Slum Free City Plan of Action in Lucknow. RAY, Lucknow, India.
- UNDP (2013) Human Development Report 2013. The Rise of The South: Human Progress in a Diverse World. Technical Notes. UNDP, New York, USA.
- Uttar Pradesh State Pollution Control Board (2017) Data of Various Pollutants from 2008 to 2009 of Lucknow city. Uttar Pradesh State Pollution Control Board, Lucknow, India.
© 2020 Ravi Sharma. This is an open access article distributed under the terms of the Creative Commons Attribution License , which permits unrestricted use, distribution, and build upon your work non-commercially.
Editor In Chief


.jpg)


Signup for Newsletter

Quick Links
 Editorial Board Registrations
 Submit your Article
 Refer a Friend
 Advertise With Us
Our Recent Edition

.jpg)


Top Editors


.jpg)


.bmp)
.jpg)
.png)
.jpg)


.jpg)


.png)

.png)


.png)


Financial Support

Sponsors

Latest e-Books

Latest Video

 a Creative Commons Attribution 4.0 International License. Based on a work at www.crimsonpublishers.com.
Best viewed in
a Creative Commons Attribution 4.0 International License. Based on a work at www.crimsonpublishers.com.
Best viewed in