
- About Us
- Information
-

The Author ensures that the research has been conducted responsibly and ethically with adherence to all relevant regulations. read more..
- For Authors
- For Reviewer
- Manuscript Guidelines
- Membership
- Publication Ethics
-
- Journals
- Reprints
- e-Books
- Videos
- Policies
- Contact Us
 COVID-19
- Submissions


Full Text
Environmental Analysis & Ecology Studies
Study on Pretreatment of Dissolved Pollutants in Heavy Oil Wastewater
Pei Jiang1,2*, Xiaoping Xu1, Hanpei Yang3, Hanfei Cheng2, Gaochuan Zhang2 and Xueyu Wei1
1School of Architecture and Civil Engineering, China
2MCC Huatian Engineering and Technology Corporation, China
3College of Environment, China
*Corresponding author: Pei Jiang, School of Architecture and Civil Engineering, Anhui, China
Submission: December 13, 2019;Published: January 13, 2020

ISSN 2578-0336 Volume6 Issue4
Abstract
Heavy oil wastewater is characterized by small oil-water density difference, serious emulsification, poor biodegradability, high salinity, a high-water temperature, and high viscosity, making the handling of heavy oil wastewater quite difficult. Based on the investigation of the on-site water quality and original treatment of an oilfield, the main approaches to heavy oil wastewater treatment have difficulty in meeting the required standards. In this study, raw water is pre-flocculated. The results show that treatment with aluminum poly aluminum sulphate as the flocculant has the best effect, and the chemical oxygen demand (COD) removal rate can reach 66% when the dosage of poly aluminum sulphate is 500mg/L. The dosage is further verified by its zeta potential, and the COD removal rate is the highest. The coagulation mechanism of poly aluminum ferric sulfate is also analyzed. The three-dimensional fluorescence spectrum of the supernatant treated by coagulation under different pH conditions indicates that the organic matter in the water sample is mainly fulvic acid in the ultraviolet range, and a small amount of protein. The complexation mechanism of poly aluminum ferric sulfate to dissolved organic matter (DOM) in raw water was verified by analyzing the characteristics of the flocs.
Keywords: Heavy oil sewage; Dissolved organic matter; Flocculation; Zeta potential; Three-dimensional fluorescence spectrum
Introduction
China has abundant heavy oil resources, with an annual output of more than 30 million tons of heavy oil, and more than 100 millionm3 of heavy oil wastewater. In general, heavy oil wastewater is reinjected underground, after preliminary physical and chemical treatment (including oil-water separation, flotation, and filtration) [1]. Owing to a water content of 90%, a large amount of heavy oil wastewater (nearly 2×10⁸m3/a in China) is partially or completely discharged into the surface water after secondary treatment [2]. For a long time, only the non-polar oil in the water was controlled by the government, and little attention was paid to the production of dissolved organic matter in the water. Heavy oil wastewater is rich in soluble refractory organics such as petroleum hydrocarbons, aromatic hydrocarbons, aniline, nitrobenzene, phenols, and their derivatives [3-5]. These substances are highly toxic and have microbial activity. Discharge of wastewater into the environment can lead to a series of environmental problems, including water, soil, and even atmospheric pollution [6-9].
As one of the most effective heavy oil wastewater treatment methods [10-13], the flocculation method has advantages of high treatment efficiency and low corrosion effects on equipment [14-17]. In this study, the effluent from an oilfield wastewater treatment plant was used as an experimental object. The effluent included Poly Aluminum Chloride (PAC), Poly Aluminum Ferric Chloride (PAFC), Poly Aluminum Silicate (PSAF), and Poly Ferric Sulfate (PFS). The removal effects of four different flocculants on the dissolved pollutants in heavy oil wastewater were investigated, along with the mechanisms of flocculation [18-22]. At the same time, the characteristics of the flocs were investigated, and the complexation mechanisms of flocculants on dissolved organic matter (DOM) in raw water were verified. Through the pretreatment research on flocculation, the dissolved pollutants in the experimental water were effectively removed, and the load of the subsequent treatment process was reduced. This research achieved good experimental results; the effluent of the heavy oil sewage treatment workshop was upgraded to the level of the standard, and the improvement has a demonstrable effect.
Experimental Materials and Methods
Experimental instruments and materials
Table 1:

Experimental Instruments: HORIBA MAX Fluorescence Spectrophotometer, American Horticulture Group; Nicolet 5700 Smart Fourier Infrared Spectrometer, Thermo Nicolet, USA; Maerlen Zetasizer Nano Z Zeta Potentiometer, Malvern Tester, UK; Vario EL III Element Analyzer, Elementar, Germany; HITACHI S-4800 field emission scanning electron microscope, Hitachi, Japan; BRUKER QX QUANTAX400 energy spectrum analyzer, Bruker, Germany. Experimental materials: The experimental water was taken from an oilfield wastewater treatment plant. The basic water quality indicators are shown in Table 1. The reagents used were analytical-grade reagents.
Experiment and analysis method
The COD was measured by the potassium dichromate method. The fluorescence spectrum was measured by a HORIBA MAX fluorescence spectrophotometer. The photomultiplier voltage was 700V, the instrument light source was a 150W xenon lamp, the monochromator was diffraction grating, and the excitation and emission slit widths were both 5nm the excitation wavelength scanning range was 220-400nm, and the emission wavelength scanning range was 280-550nm. The infrared spectrum was measured by a Nicolet 5700 intelligent Fourier infrared spectrometer. The water sample was dried in a desiccator. A measured weight of 300mg of chromatographically pure KBr was placed into a quartz crucible and ground into a blank. The background value of the blank sample was determined by infrared spectroscopy, and the residual solid after drying was a small amount. After adding 300mg of chromatographically pure KBr, it was evenly pressed and compressed. The time-wavenumber range was selected from 400 to 4000cm-1, to detect the infrared spectral characteristics of each component. The Zeta potential analysis was performed using a Maerlen Zetasizer Nano Z tester. Water was used as the dispersed phase during the test. The pH of the solution was not required to be tested before the test. An LC-10ATVP gel chromatography instrument (Shimadzu, Japan) employed 0.45µm membrane filtration before sample testing and used ultrapure water for the measurement. The reaction column was selected from the TSK G4000PWXL column, manufactured by the Toshiba Corporation of Japan.
The column temperature was set to 40℃, and the flow rate was 0.05ml/min. The detector was a differential refractive index detector (RID), and the reference material was sodium polystyrene sulfonate. The molecular weights were determined as 106, 194, 615, 1500, 3930, 12140, 23520, 62100, 116300, 454000, 895000, and 125800Da. The obtained materials were analyzed by the Vario EL III elemental analyzer to determine levels of C, H, O, N, and S. The elemental composition was determined by a scanning electron microscope (SEM), i.e., a HITACHI S-4800 and an energy spectrum analyzer (EDS), i.e., a BRUKER QX QUANTAX400.
Result and Discussion
Coagulant screening
Five settlements were set in beakers; 200ml of water alone, and 200ml of water mixed with 500mg/L PAC, 500mg/L PAFC (poly aluminum chloride iron), 500mg/L PSAF (iron), and 500mg/L PFS, respectively. They were stirred at a speed of 120r/min, i.e., a quick stir, for 60s. Then, they were slowly stirred for 10min at a speed of 40r/min. For precipitation, they were left to stand for 30min, and then the supernatant was analyzed. The results are shown in Figure 1.
Figure 1: Comparison of treatment effects of different coagulant sedimentation.

It can be seen from Figure 1 that after the same concentration of flocculant is added to the settled effluent, the respective abilities to remove COD from the solution, from large to small are: PFS>PAC>PSAF>PAFC, all of which are cationic mixed. The coagulant, which acts on the negatively charged colloidal particles in the water, mainly functions as an electric neutralization and bridging element. This can be seen from the change in the zeta potential of the supernatant after coagulant treatment (Table 2), in which PFS and PAC are added. After adding PAFC, the zeta potential is positive, indicating that the three agents are excessive. The absolute value of the zeta potential of the supernatant treated by PFS is the largest, indicating that the PFS is more excessive than the other coagulants, causing the colloidal particles in the solution to be adsorbed. After adding more PFS, the organic matter in the water is further adsorbed, i.e., PFS can remove even more organic matter.
Figure 2: Effect of the dosage of Poly Ferric Sulfate (PFS).

Table 2 Flocculation treatment of water enthalpy potential for raw water and Poly Aluminum Chloride (PAC), Poly Aluminum Ferric Chloride (PAFC), Poly Aluminum Silicate (PSAF), and Poly Ferric Sulfate (PFS)
Table 2:

A large number of studies on PFS were conducted by Japanese scholars in the 1970s. They proposed that the chemical formula of PFS can be expressed as: [Fe2(OH)n(SO4) 3-n/2]m, where n=0.5-1.0 and m=f(n). It is believed that [Fe(H2O)6]3+, Fe2(H2O)73+, and Fe3(H2O)23+ are the main hydrolyzed forms of PFS in solution. Taiwan scholar Cheng et al. [23] studied PFS and found that PFS formed a large and dense Fe(OH)3 colloid during coagulation, which was compared with other coagulants for turbidity, color, and organic matter. The removal rate was higher, and the residual components in the supernatant were lower.
Effect of poly ferric sulfate dosage
In the experiment, 100, 200, 300, 400, and 500mg/L of PFS were added to a beaker containing 100mL of settled water, respectively. The mixture was stirred for 60s at 120r/min, and then was slowly stirred for 30min at 40r/min. The precipitate was allowed to stand for half an hour, and the supernatant was taken for analysis. The analysis results are shown in Figure 2.
It can be seen from Figure 2 that the COD removal rate increases when the PFS dosage is less than 200mg/L. When the dosage increases to 200mg/L, the COD removal rate reaches the highest value. When the PFS dosage exceeds 200mg/L, the COD removal rate appears to decrease with the increase of dosage, owing to excessive dosage. The colloid in the sewage appeared to stabilize again. It can be seen from Figure 3 that as the PFS dosage increases, the supernatant zeta potential changes from a negative value to a positive value. This is caused by the neutralization effect of the PFS on the DOM in the sedimentation effluent when the dosage is greater than 200mg. Following that, the absolute value of the zeta potential increases, causing the repulsion between the charged colloids to increase. Then, re-stabilization occurs when the dosage is increased to 500mg/L, which is basically consistent with the change of the COD.
Figure 3: The zeta potential of the supernatant under different dosages of PFS.

Effect of pH on flocculation performance of poly ferric sulfate
To study the effects of pH on the flocculation performance of PFS, the initial pH of each of the three beakers containing 100mL of settled water was adjusted to 6.00, 7.00, and 8.00 with 2% Hydrochloric Acid (HCl) and 2% Sodium Hydroxide (NaOH), respectively. Then, 200mg/L of PFS was added and stirred at a rate of 120r/min for 60s, followed by slowly stirring at 40r/min for 30min. The precipitate was allowed to stand for half an hour, and the supernatant was taken for analysis. The results are shown in Table 3. Table 3 Basic water quality indicators of different pH coagulation supernatants
Cheng et al. [23] studied the removal of DOM by PFS coagulation precipitation. Their study showed that when PFS is added to a DOM solution, the hydrolysis of the PFS component and the negatively charged DOM will occur simultaneously. A neutralization-based complexation reaction also occurs, and the two reactions will compete for the PFS component in the solution. The specific reactions are as follows:
Hydrolysis reaction:
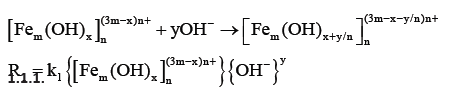
Complexation reaction:
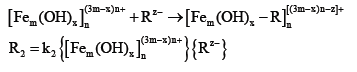
Combined with the change of the zeta potential of the floc and Equations 1 and 2, it can be inferred that when the raw water is pH=6.00, the organic matter in the PFS coagulation water is mainly carried out by the electric neutralization mechanism. The same appears true for water with pH=7.0 and pH=8.00. Similarly, under neutral or alkaline conditions, the PFS added to the water rapidly hydrolyzes and forms colloidal precipitates, reducing the electrical neutralization ability of the PFS. However, the adsorption complexation of colloidal precipitates (flocculating flocculation) becomes the main mechanism of coagulation and ensures the removal of DOM by PFS coagulation and sedimentation under the pH condition.
Three-dimensional fluorescence analysis of coagulated supernatant
Figure 4 Three-dimensional fluorescence spectra of coagulation supernatants under different pH conditions; (a) pH=6.00, (b) pH=7.00, (c) pH=8.00. Figure 4 shows the threedimensional fluorescence spectra of the coagulation supernatant under different pH conditions. By comparison, it can be found that the fluorescence peaks of the coagulated supernatants under the three pH conditions are basically the same. The organic substances in the water samples are mainly in the ultraviolet range. For fulvic acid and a small amount of protein, the fluorescence peak intensity of the supernatant is lower than the fluorescence peak intensity at pH=8.00 when pH=6.00, because the humus is an acidic group containing a carboxyl functional group and a phenolic functional group. A porous polymer material having a flexible structure. In general, as the pH changes, the acidic groups in the structure of the organic macromolecule and the configuration of the molecule itself undergo some changes. Studies have shown that humic molecules exhibit a linear stretch structure in neutral and alkaline pH conditions, and a curly agglomerated state in acidic pH conditions. When the humus is linearly stretched, more fluorophores are exposed to the solution, enhancing the fluorescence intensity [24]. When the structure is curled and agglomerated, the fluorescence intensity is weakened.
Figure 4:

Floc characteristics study
Figure 5: Comparison of infrared spectra of each component after sedimentation of effluent into Ferric Sulfate; (a) Sedimentation effluent, (b) Supernatant lyophil and (c) Sediment.

Fourier infrared spectroscopy: The solid powder sample obtained by the lyophilization of the supernatant and the sediment after the treatment with the ferric sulfate was tested to obtain the Fourier infrared spectrum, which was then compared with the Fourier infrared spectrum of a material obtained by freeze-drying the raw water. The result is shown in Figure 5.
It can be seen from Figure 5 that at 1141.3cm-1, the infrared spectra of the supernatant and the sediment are sharper than that of the raw water. This is caused by hydration, i.e., the additional residual moisture in the freeze-dried raw water. In addition, the infrared spectrum of the sediment has a peak at 3169cm-1 as compared to the raw water freeze-dried product, owing to the hydroxyl stretching vibration of the iron hydroxy complex.
Scanning electron microscope - energy spectrum analyzer (SEM-EDS) analysis: The SEM-EDS was tested on the solid powder sample after the raw water and the ferric sulfate treatment, and the supernatant was freeze-dried. The results are shown in Figure 6. It can be seen from Figure 6 that both the raw water and the PFS-treated supernatant lyophile include fluffy and porous structures (which are DOM), whereas the sediment is hard, and the needles are covered with a fluffy piece. According to a study by Shilpi Verma [25], this is because PFS mainly removes organic matter in an aqueous solution by adsorption-complexation-coil flocculation under this condition, which is consistent with the above-mentioned analysis of the PFS complexation mechanism.
Table 4 shows the results of EDS analysis of the raw water, supernatant, and sediment dry matter. It can be seen from Table 4 that the elemental compositions of the raw water and supernatant are basically the same, and the percentages of the components are not significantly different, indicating that the residual organic and inorganic substances in the supernatant are of the same type. The C mass percentage in the sediment is increased from 6.32% to 18.56%, indicating that after adding the PFS, the organic matter in the raw water is enriched in the sediment by flocculation. The percentage of Fe in the sediment is 8.65%, which is not observed in the raw water and the supernatant. This indicates that the Fe and organic matter did work, further verifying the complexation mechanism of PFS to DOM in raw water. Table 4 Results of Energy Spectrum Analyzer (EDS) analysis of raw water, supernatant, and sediment dry matter
Figure 6: Comparison of Scanning Electron Microscope (SEM) images of the components after the sedimentation of effluent into the Poly Ferric Sulfate; (a) Settled effluent, (b) Supernatant lyophile and (c) Sediment.

Table 4:

Note: Means not detected.
Conclusion
- A flocculation method can effectively remove dissolved pollutants in the heavy oil sewage as a pretreatment. When aluminum poly sulfate is used as the flocculant, the treatment effect is optimum, and when the dosage of poly aluminum sulphate is 500mg/L, the COD removal rate can reach 66%.
- This study examined the hydrolysis and complexation reactions and the zeta potential of the floc. When the raw water is pH=6.00, the organic matter in the PFS coagulation water is mainly carried out by the electric neutralization mechanism, and the same occurs for the water samples at pH=7.0 and pH=8.00. The organic matter in the PFS coagulation water is mainly carried out by adsorption complexation, ensuring the removal of the DOM by PFS coagulation and sedimentation under the pH condition.
- The soluble pollutants observed in the heavy oil wastewater are mainly fulvic acid and a small amount of protein (in the ultraviolet range). By characterization of the SEM-EDS data of the imaginary body, the lyophilized supernatant of the raw water and the PFS-treated supernatant appears as a fluffy, porous structure, i.e., as DOM, whereas the sediment exhibits a hard, needle-like shape covered with a fluffy sheet. The percentage of C mass in the sediment increased from 6.32% to 18.56%, indicating that the organic matter in the raw water was enriched in the sediment by flocculation after the addition of PFS. The percentage of Fe in the sediment was 8.65%, which further verified the results. The complexation mechanism of PFS on DOM in raw water.
References
- Ji GD, Sun TH, Ni JR (2017) Surface flow constructed wetland for heavy oil-produced water treatment. Bioresource Technology 98(2): 436-441.
- Liao B, JiG, Cheng L (2008) Profling of microbial communities in a bioreactor for treating hydrocarbon-sulfde-containing wastewater. Journal of Environmental Sciences 20(8): 897-899.
- Fillo JP, Koraido SM, Evans JM (1992) Sources, characteristics and management of produced waters from natural gas production and storage operations. Produced Water 46: 151-161.
- Hansen BR, Davies SR (1994) Review of potential technologies for the removal of dissolved components from produced water. Chemical Engineering Research & Design 72(2): 176-188.
- Tibbetts PJ, Buchanan IT, Gawel LJ, Large R (1992) A comprehensive determination of produced water composition. Produced Water 46: 97-112.
- Stromgren T, Sorstrom SE, Schou L, Kaarstad I, Aunaas T, et al. (1995) Acute toxic effects of produced water in relation to chemical composition and dispersion. Marine Environmental Research 40(2): 147-169.
- Chen Z, Huang GH, Chakma A (1998) Integrated environmental risk assessment for petroleum-contaminated sites - a north american case study. Water Science and Technology 38(4-5): 131-138.
- Jerez SF, Godoy JM, Miekeley N (2002) Environmental impact studies of barium and radium discharges by produced waters from the “Bacia de Campos” oil-field offshore platforms, Brazil Journal of Environmental Radioactivity 62(1): 29-38.
- Ma F, Guo JB, Zhao LJ, Chang C, Di Cui (2009) Application of bioaugmentation to improve the activated sludge system into the contact oxidation system treating petrochemical wastewater. Bioresource Technology 100(2): 597-602.
- Lopez EA, Oropeza MT, Jurado JL, Teran O (2014) Coagulation-flocculation mechanisms in wastewater treatment plants through zeta potential measurements. Journal of Hazardous Materials 279: 1-10.
- Verma S, Prasad B, Mishra IM (2010) Pretreatment of petrochemical wastewater by coagulation and flocculation and the sludge characteristics. Journal of Hazardous Materials 178(1-3): 1055-1064.
- Lee KE, Teng TT, Morad N, Poh BT, Hong FY (2010) Flocculation of kaolin in water using novel calcuim chloride-polyacrylamide (CaCl2-PAM) hybird polymer. Separation Purification Technology 75(3): 346-351.
- Zeng Y, Yang C, Zhang J, Pu W (2007) Feasibility investigation of oily wastewater treatment by combination of zinc and PAM in coagulation/flocculation. Journal of Hazardous Materials 147(3): 991-996.
- Hirayama A, Maegaito M, Kawaguchi M, Ishikawa A, Sueyoshi M, et al. (2002) Omani oil fields produced water: treatment and utilization. SPE International Petroleum Conference and Exhibition in Mexico. Society of Petroleum Engineers, Mexico, pp. 577-581.
- Painmanakul P, Sastaravet P, Lersjintanakarn S, Khoadhiar S (2010) Effect of bubble hydrodynamic and chemical dosage on treatment of oily wastewater by Induced Air Flotation (IAF). Chemical Engineering Research and Design 88(5-6): 693-702.
- Al Ani FH (2012) Treatment of oily wastewater produced from old processing plant of north oil company. Tikrit Journal of Engineering Sciences 19(1): 23-24.
- Zhong J, Sun XJ, Wang CL (2003) Treatment of oily wastewater produced from refinery processes using flocculation and ceramic membrane filtration. Separation Purification Technology 32(1-3): 93-98.
- Heinzmann B (1994) Coagulation and flocculation of stormwater from a separate sewer system-a new possibility for enhanced treatment. Water Science and Technology 29(12): 267-278.
- Shammas NK (2005) Coagulation and flocculation. Physicochemical Treatment Processes 3: 103-139.
- Crees O, Senogles E, Whayman (1991) The flocculation of cane sugar muds with acrylamide-sodium acrylate copolymers. Journal of Applied Polymer Science 42(3): 837-844.
- Packham RF (1965) Some studies of the coagulation of dispersed clays with hydrolyzing salts. Journal of Colloid Science 20(1): 81-92.
- Stumm W (1977) Chemical interaction in particle separation. Environmental Science & Technology 11(12): 1066-1070.
- Cheng, WP, Chi FH (2002) A study of coagulation mechanisms of polyferric sulfate reacting with humic acid using a fluorescence-quenching method. Water Research 36(18): 4583-4591.
- Royer RA, Burgos WD, Fisher AS, Unz RF, Dempsey BA, et al. (2002) Enhancement of biological reduction of hematite by electron shuttling and Fe (II) complexation. Environmental Science & Technology 36(9): 1939-1946.
- Verma S, Prasad B, Mishra IM (2010) Pretreatment of petrochemical wastewater by coagulation and flocculation and the sludge characteristics. Journal of Hazardous Materials 178(1-3): 1055-1064.
© 2020 Soumyendra Kishore Datta. This is an open access article distributed under the terms of the Creative Commons Attribution License , which permits unrestricted use, distribution, and build upon your work non-commercially.
Editor In Chief


.jpg)


Signup for Newsletter

Quick Links
 Editorial Board Registrations
 Submit your Article
 Refer a Friend
 Advertise With Us
Our Recent Edition

.jpg)


Top Editors


.jpg)


.bmp)
.jpg)
.png)
.jpg)


.jpg)


.png)

.png)


.png)


Financial Support

Sponsors

Latest e-Books

Latest Video

 a Creative Commons Attribution 4.0 International License. Based on a work at www.crimsonpublishers.com.
Best viewed in
a Creative Commons Attribution 4.0 International License. Based on a work at www.crimsonpublishers.com.
Best viewed in