
- About Us
- Information
-

The Author ensures that the research has been conducted responsibly and ethically with adherence to all relevant regulations. read more..
- For Authors
- For Reviewer
- Manuscript Guidelines
- Membership
- Publication Ethics
-
- Journals
- Reprints
- e-Books
- Videos
- Policies
- Contact Us
 COVID-19
- Submissions


Full Text
Environmental Analysis & Ecology Studies
Field Evaluation and Uncertainty Estimation of Indigenously Developed Light Weight Gas Sensor System Over Delhi (Urban) and Sunderpur, Kurukshetra (Rural)
Ahlawat A1,2, Mishra SK1,2*, Goel V1,2, Fatima S1,2 and Sharma C1,2
1CSIR-National Physical Laboratory, India
2Academy of Scientific and Innovative Research, India
*Corresponding author: Mishra SK, National Physical Laboratory, Academy of Scientific and Innovative Research, New Delhi, India
Submission: May 06, 2019;Published: November 01, 2019

ISSN 2578-0336 Volume6 Issue3
Abstract
The recent advancements in low-cost gas sensing technology has completely changed the way in which the routine observations are carried out. Though, such low-cost technologies suffer from various challenges pertaining to data quality. But there is a strong need to test these low cost, light weight sensors installed in the instruments in field campaigns. In the present work, we discuss the use of developed gaseous monitoring system (350gm, 7” *3” *2”) equipped with electrochemical gas sensors for understanding and quantifying major gaseous pollutants. Alpha sense sensors were used to measure gas pollutant species like CO, SO2, NO2, and O3. The developed system was operated over Delhi (28.38° N, 77.10° E; urban site) and Sunderpur, Kurukshetra (29.96° N, 76.87° E, rural site) during monsoon season of 2017. The monthly averaged mean value of SO2, NO2, CO, and O3 concentrations over the entire study period in Delhi were found to be 6.07ppb, 70.27 ppb, 0.43ppm, and 53.49ppb, respectively while the same has been observed to be 4.04ppb, 50.02 ppb, 0.25ppm, and 40.25ppb, respectively in Sunderpur, Kurukshetra. SO2 and CO concentrations were observed to be decreased by 72% and 33%, respectively while NO2 and O3 by 50.24% and 40.48%, respectively at Sunderpur, Kurukshetra relative to that of Delhi. Monthly uncertainties of field measurements associated with four electrochemical sensors have been calculated for Delhi and Sunderpur, Kurukshetra. The results were found to be in good agreement with that of other reported studies during the monsoon season.
Keywords: Gaseous pollutants; Electrochemical sensors; LWGSS; Testing; Urban; Rural
Introduction
Air pollution sources are primarily dependent on anthropogenic sources like combustion activities in engines, power plants and wood stores, strengthen by industrial and non-combustion agricultural sources [1,2]. In urban environment, the combustion sources are more dominant that give rise to carbon oxides (COx), unburned hydrocarbons, nitrogen oxides (NOx), particulate matter, polyaromatic hydrocarbons (PAHs), Sulfur oxides (Sox) and heavy metals [1]. Agricultural activities also emit ammonia, methane, nitrous oxide (N2O) and nitric oxide (NO) [3]. Photochemistry also plays a significant role leading to several reactions in an urban air matrix, including transformation of primary pollutants (e.g. NOx) to secondary pollutants (e.g. O3). To capture the fine spatial and temporal variability of aforesaid gaseous pollutants, the gridded low-cost measurement network is required. In general, aforesaid gaseous pollutants concentration data collected by government agencies using networks of fixed monitoring stations equipped with high end instruments measuring number of pollutants such as CO, NOx, SOx, O3 etc. [4-7]. The price of these instruments is very high excluding the maintenance cost, calibration cost, secured enclosures and power supply [8-10]. With advancements in technology and increasing concern about air quality worldwide, the scientific community has taken a step towards development of low-cost light weight instruments [11]. Low cost sensor system provides an estimate on concentration of various air pollutants with high resolution spatial and temporal coverage [10-13].
Though, the low-cost sensor system could not provide the same sensitivity, stability, accuracy and precision as that of traditional routine high-end air quality monitoring instruments [11,14] but they can be very valuable in monitoring programs especially during vertical measurement using airborne platforms like Unmanned Aerial Vehicles (UAVs), Balloons etc (Figure 1). Usage of low-cost sensors can provide better spatial and temporal resolution for air pollution mapping [15,16]. For improving knowledge about pollution dynamics and identification of pollution hot spots, these low-cost sensors can potentially be used [5]. Furthermore, the light weight, low cost instrument equipped with such sensors can be used as monitoring tool for a wide range of communities like researchers, municipalities, as personal exposure monitor, for emergency response and hazard warning system and monitoring & controlling emissions of sources [5,6,8,11,17]. More amount of reliable air quality data from a dense network of such instruments provides a platform for better calibration and validation of air pollution dispersion models, chemical transport models and exposure models and improved environmental impact assessments [4,14,18]. The performance and applicability of aforementioned low-cost instruments need to be studied in real world conditions [6,11,19]. The development of instruments equipped with various low-cost sensor sensors like electrochemical, metal-oxide, optical, near infrared etc. has been recently in demand for the monitoring of air quality across the globe [5,9,20,21]. Amongst aforesaid sensors, electrochemical sensors have been used intensively to monitor air quality in past [8,20,22,23].
Figure 1: (a) Light Weight Gas Sensor System (LWGSS) with five electrochemical gas sensors along with necessary electronic components. (b) Box carrying LWGSS instrument.

A portable instrument equipped with ozone and NO2 sensors has been developed for air quality monitoring [24]. USEPA provides an access to its Air Sensor Toolbox data to understand low cost sensor system usage [25]. Other projects such as Every aware and Air casting provides an open source air quality monitoring networks, inspired by IoT and other innovative technologies [26]. The continuous measurements of SO2, NOx, CO and O3 from an urban site, Kanpur, in India during June 2009 to May 2013 were reported. The hourly averaged mean SO2, NOx, CO, and O3 concentrations over the entire study period ranged from 0.5ppb to 98.7ppb, 0.4ppb to 96.8ppb, 40ppb to 5040ppb, and 1.1ppb to 106.8ppb, respectively [27]. In order to understand the major gaseous pollutants in Indo-Gangetic Plain (IGP) i.e. Delhi and over the edge of IGP i.e. Sunderpur, Kurukshetra, we developed light weight gas sensing system (LWGSS) equipped with five electrochemical gas sensors. The developed system was operated over Delhi (28.38° N, 77.10° E; urban site) and Sunderpur, Kurukshetra (29.96° N, 76.87° E, rural site) during monsoon season of 2017 for about two months (25 July to 24 August, 2017 (Delhi); 25 August to 24 September, 2017 (Sunderpur, Kurukshetra)).
Materials and Methods
LWGSS instrument description
In the present study, we used the indigenously developed light-weight gas sensor system (350gm, 7” *3” *2”) equipped with low-cost, light weight electrochemical gas sensors for understanding major gaseous pollutants. The instrument is capable to monitor gases like CO, NO2, SO2, O3 and H2S. The sensors are aerometric electrochemical in nature provided by [21]. This instrument is designed to be used as low power wireless system to provide next generation gas sensing solutions. The technical and performance details of the developed instrument have been discussed in another paper [28], submitted to ESPR. The gas levels were sensed through the respective gas sensors and the information has been sent to the ATMEGA microcontroller. The sensed analog signals have been converted into digital signals through A-D converter (in-built in this case). The sensed signals have been displayed on the screen as well as in the form of message simultaneously. A Micro SD card has been used for data collection.
Sampling Sites for measurement
The field observations were carried out at two sites Figure 2 in monsoon season of 2017 for about two months (25 July to 24 August 2017 (Delhi); 25 August to 24 September 2017 (Kurukshetra)). Figure 3 shows the field observation sites. The data were collected for about 8hrs daily from 9 AM to 5 PM with 1-minute averaged concentration during monsoon period in the Northern part of India for two different sites lying at the edge of IGP.
The instrument was placed at the height of about 8 meters from the ground level at both the locations. CSIR-NPL is located at central Delhi and considered as the representative of the urban environment, whereas, Sunderpur, Kurukshetra has been considered as rural site. The rural site is very close to the city, Kurukshetra and pollution levels are increasing due to urbanization and rapid industrialization. The major sources of pollution are from cement factory, National Highway (NH-1) and brick kilns. The monsoon starts in both Delhi and Kurukshetra in late June and lasts until mid-September. The average temperatures are around 29 °C, although they can vary from around 25 °C on rainy days to 32 °C during dry spells. Both places experience similar kind of meteorological conditions throughout the year.
Figure 2: Geographical location of the sampling sites (a) Sunderpur, Kurukshetra (29.96° N, 76.87° E, Rural) (b) Delhi (28.38° N, 77.10° E, Urban) [HYSPLIT, NOAA].

Result and Discussion
Variation in gaseous concentration over urban and rural environment:
Figure 3(a) showed CO concentration in ppm values and Figure 4(a) shows the gases (NO2, SO2 and O3) concentrations in ppb values for urban area i.e. Delhi for a time period of one month. The data were collected for 8 hrs daily from 9 am to 5 pm with 1-minute averaged concentration data during 25 July to 24 August 2017 typically known as the monsoon period in northern part of India. The daily averaged value with standard deviation is shown in the Figure 3(a) & 4(a) respectively. There are only a few minor missing data periods, due to some rainy events occurred during the operation. The field observation study using electrochemical gas sensors has not been fully explored. There are a lot of external parameters which affects the performance of the sensor equipped on instrument causing uncertainties. These uncertainties cannot be figured out as these meteorological parameters varies from time to time. Though, the uncertainty associated with the internal parameters can be well quantified, still calculation of external uncertainty remains complex. NO2 and Ozone values show a zig zag trend as analysed for a month-long period.
Figure 3: Daily averaged CO gaseous concentration in ppm for monsoon period 2017 at (a) Delhi (Urban) (b) Sunderpur, Kurukshetra (Rural)

This trend in NO2 is basically due to the presence of burning of fossil fuels, biomass and high temperature combustion processes hydrocarbons over Delhi or surrounding areas and the trends in Ozone are due to the presence of NOX upon reacting with sunlight results in O3 formation less for days post rainy event and more values preceding rainy event. The July month data shows less than the average value for the entire month for both NO2 and Ozone with just two exception days. The data recorded for the month of august with few rainy days shows zig zag pattern in the values of gases concentration. Though, decreasing trend in the values of concentration has been observed during end of observation days. CO gas concentration depends on the factors like burning of carbonaceous fuels, emission from IC engines. Thus, it is obvious that CO concentration shows rise in the urban environment as compared to rural environment.
Figure 3(b) showed CO concentration in ppm values and Figure 4(b) shows the gases (NO2, SO2 and Ozone) concentrations in ppb values for Rural area i.e. Kurukshetra for a time period of one month. The data were collected for 8 hrs daily from 9am to 5pm with 1-minute averaged concentration data during late August to late September 2017 typically known as the post monsoon period in northern part of India. The daily averaged value with standard deviation is shown in the Figure 3(b) & 4(b) respectively. The monthly averaged mean value of SO2, NO2, CO, and O3 concentrations over the entire study period in Delhi were found to be 6.07ppb, 70.27ppb, 0.43ppm, and 53.49ppb, respectively, and with a mean of 4.04ppb, 50.02ppb, 0.25ppm, and 40.25ppb, respectively in Kurukshetra. Percentage change in values of SO2 and CO concentrations at Kurukshetra were comparatively lower than those reported at Delhi, India (72% and 32.89%, respectively).
Figure 4: Daily averaged NO2, SO2 and O3 gaseous concentration in ppb for monsoon period 2017 at (a) Delhi (Urban) (b) Sunderpur, Kurukshetra (Rural).

However, mean O3, NO2 concentrations were comparatively higher than those of other two trace gases and higher for Delhi, the urban site as compared to Kurukshetra, the rural site (50.24% and 40.48%). Data were missing on some rainy events occurred during the operation. NO2 and Ozone values show a zig zag trend as analysed for a month-long period. This trend in NO2 is basically due to the presence of burning of fossil fuels, biomass and high temperature combustion processes hydrocarbons over Kurukshetra or surrounding village areas and the trends in Ozone are due to the presence of NOX upon reacting with sunlight results in O3 formation less for days post rainy event and more values preceding rainy event. The main source of gas-phase SO2 is from the combustion of all sulfur containing fuels (oil, coal and diesel). In India, about 60% of SO2 emissions may be due to the consumption of coal and oil products, mainly from industry (36%) and transport (7.8%), and others include biomass and non-energy consumption [25]. SO2 does not show much variations in the concentration values but NO2 and O3 shows a significant trend during the observation period. Here, the values of NO2 in concentration found to be higher than the values of ozone for the rural area.
The persistent cloudy conditions with lower solar radiation and wet scavenging of pollutants result in near absence of photochemical O3 production during monsoon season. Relative humidity is also an important factor because of its role in the overall reactivity of the system by affecting chain termination reactions. The previous global modelling study predicted decrease in global O3 due to increased water vapor, mostly in rural areas (Kurukshetra site) [25]. The results were found to be in good agreement with that of other reported studies during the monsoon season [29].
Uncertainty budget estimation of LWGSS
It is always recommended to calculate the uncertainty budget for each instrument for maintaining the data quality. The uncertainty shown in Table 1 describes the combined standard uncertainties (both Type A and Type B) for internal parameters only, impact of external parameters on uncertainty has been excluded from the calculation. All the sensors performed more or less equally well during the deployment period, as found in the companion paper (Except for CO, all the uncertainties in gaseous concentration are measured in ppb).
Table 1: Monthly uncertainties of field measurements associated with four electrochemical sensors for Delhi and Sunderpur, Kurukshetra calculated using GUM sim software approach [30].

LWGSS Uncertainty Budget Estimation (Internal): Following are the major contributors for estimation of overall uncertainty:
- Miniature gas sensor uncertainty (mainly concentration)
- Electronic circuit uncertainty: (I) LMP91000 IC (II) ATMEGA Microcontroller (III) Passive components (R, C, Diodes) (IV) Truncation error.
Uncertainty associated with gas sensor: Following are the major parameters for determination of uncertainty due to individual component (ozone gas sensor specifications only, for other gases please refer to Alphasense brochure) [21]:
- ppb equivalent change in lab air/year (Max.) (Zero drift) =20%
- Sensitivity drift; max. -40% change/year in lab air
- Noise = ±2 std. deviations (ppb equivalent)
- Linearity = ppm error at full scale, linear at zero and 20ppm ozone
- Range =ppm ozone limit of performance warranty; 0 to 20ppm
- Sensitivity= -200 to -650nA/ppm at 1ppm ozone
Uncertainty associated with electronic circuit: LMP91000 IC: mainly used for electrochemical gas sensing. Following are the major parameters for determination of uncertainty due to individual component:
- Operating temperature=-40 to 85 degrees
- Supply current =0.01mA
- Vmin=2.7 V; Vmax=5.25 V
- Bias programming uncertainty (manual)= ±2%
- Linearity= ±05%
- TI Amplifier gain accuracy= 5%
- Internal zero voltage accuracy= ±04%
- Temperature error= ±3%
- Sensitivity= -8.2mV/C
ATMEGA micro controller IC: The low power 8-bit microcontroller works on RISC architecture. Uncertainty is mainly due to oscillator frequencies. Crystal oscillator used in microcontroller provides 0.2% error at 9600bps (Baud Rate). Overall, ±04%ppb variations with change in values of current is equal to twice at that particular frequency of operation
- Due to passive elements (Resistance, Capacitances, Diodes on board PCB)
- Absolute accuracy: C=2%; R=0.1%; D=0.2%
- Temperature coefficients: C=20ppm/C; R=1500ppm/C; D=600ppm/C
- Voltage coefficients: C=20ppm/V; R=-200ppm/V; D=-100ppm/V
- Truncation error in finite form: For e.g., 0.4821=0.4000+0.0821, T.E.=0.0821=8.21%
Using all the data information provided by manufacturers, the uncertainty budget was basically classified into two parts: Type A (Repeatability) and Type B (i.e. Fixed, mainly due to fixed electronic components present on PCB).
Then the equation follows:
Y= X1+X2+X3+X4+X5+X6+X7+X8+X9+X10+X11;
Where, Y=uncertainty in the concentration of gases
X1= Type A values of gases concentration which is varying according to time
X2= Type B fixed values of uncertainty due to LMP91000 IC
X3= Uncertainty associated with the ATMEGA microcontroller
X4, X5 and X6= uncertainty associated with the passive elements such as Resistances, Capacitances and Diodes present in the circuit.
X7, X8, X9, X10 and X11= uncertainties associated with electrochemical gas sensor
Putting all the values of Type A and Type B uncertainties in the [30], the software produces the result of combined internal uncertainty comprises of both Type A and Type B. So, daily uncertainties were calculated based on different values of concentrations of gases. Applying standard approach of finding cumulative internal uncertainties by taking the squares of daily values of uncertainties and then taking overall square root, the monthly internal uncertainty was calculated.
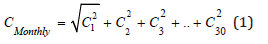
where, C1, C2, C3….C30 are the uncertainties in daily gas concentration for the days, 1,2,3…30. And Cmonthly is the monthly gas concentration uncertainty. Uncertainty in gas concentration over different locations proves to be the factor that influences the combined standard uncertainty for all gases. Instrument related uncertainties are similar for both the locations.
Conclusion
Here, we presented continuous measurements of SO2, NO2, CO and O3 from an urban site, Delhi, and rural site, Sunderpur, Kurukshetra, in India during July 2017 to September 2017 using the indigenously developed light weight wireless gas sensing system. The data coverage over the entire study period was exceptionally good, with more than 90% of the data available, with just a few missing data points due to unavoidable rainy events. We have performed statistical analysis of SO2, NO2, CO and O3 to characterize their monthly patterns together with meteorological parameters influence on these trace gases. The monthly averaged mean value of SO2, NO2, CO, and O3 concentrations over the entire study period in Delhi were found to be 6.07ppb, 70.27ppb, 0.43ppm, and 53.49ppb, respectively, and with a mean of 4.04ppb, 50.02ppb, 0.25ppm, and 40.25ppb, respectively in Sunderpur, Kurukshetra.
Percentage change in values of SO2 and CO concentrations at Sunderpur, Kurukshetra were comparatively lower than those reported at Delhi, India (72% and 32.89%, respectively). However, mean O3, NO2 concentrations were comparatively higher than those of other two trace gases and higher for Delhi, the urban site as compared to Sunderpur, Kurukshetra, the rural site (50.24% and 40.48%). The lower concentrations for all trace gases were observed during this monsoon season, mainly due to relatively lower near surface emissions (other than traffic and industrial) and wet scavenging of pollutants by precipitation. The decreasing values in all the trace gases concentration is perhaps due to a combined effect of large near-surface anthropogenic emissions, boundary layer processes, retarded photochemical loss owing to lower solar intensity, as well as local surface wind pattern. The study concludes that the sensors are applicable for future field measuring campaigns at a scientific level with all the uncertainties taken into consideration.
Acknowledgement
The authors are thankful to Director NPL for his consistent support for the ongoing work. Authors acknowledge CSIR Network Project AIM_IGPHim (PSC-0112) for the financial support. On behalf of all authors, the corresponding author states that there is no conflict of interest.
References
- Fenger J, Jens CT (2009) Air Pollution-From a local to a global perspective, USA.
- Nazaroff WW, Alvarez CL (2000) Environmental engineering science. Wiley, USA, p. 704.
- Guenther A, Geron C, Pierce T, Lamb B, Harley P, et al. (2000) Natural emissions of non-methane volatile organic compounds, carbon monoxide, and oxides of nitrogen from north America. Atmospheric Environment 34(12-14): 2205-2230.
- Reis S, Seto E, Northcross A, Quinn NW, Convertino M, et al. (2015) Integrating modelling and smart sensors for environmental and human health. Environmental Modelling & Software 74: 238-246.
- Kumar P, Morawska L, Martani C, Biskos G, Neophytou M, et al. (2015) The rise of low-cost sensing for managing air pollution in cities. Environment International 75: 199-205.
- (2014) Air Sensor Guidebook, United States Environmental Protection Agency USA.
- CPCB: National ambient air quality status and trends in India, In: Central pollution control board, ministry of environment and forests, NAAQMS/ 35 /2011-2012.
- Mead MI, Popoola OM, Stewart GB, Landshoff P, Calleja M, et al. (2013) The use of electrochemical sensors for monitoring urban air quality in low-cost, high density networks. Atmospheric Environment 70: 186-203.
- Piedrahita R, Xiang Y, Masson N, Ortega J, Collier A, et al. (2014) The next generation of low-cost personal air quality sensors for quantitative exposure monitoring. Atmos Meas Tech 7: 2425-2457.
- Aleixandre M, Gerboles M (2012) Review of small commercial sensors for indicative monitoring of ambient gas. Chemical Engineering Transactions 30: 169-174.
- Castell N, Viana M, Minguillón MC, Guerreiro C, Querol X (2013) Real-world application of new sensor technologies for air quality monitoring.
- White RM, Paprotny I, Cascio WE, Solomon PA, Gundel LA (2012) Sensors and apps for community based: Atmospheric monitoring EM: Air and waste management association's magazine for environmental managers: 36-40.
- Snyder E, Watkins TH, Solomon PA, Thoma ED, Williams RW, et al. (2013) The changing paradigm of air pollution monitoring. Environmental Science & Technology 47(20): 11369-11377.
- Hertel O, Poulsen M, Karatzas K, Borrego C, Castell N, et al. (2016) Focus on innovation in sensor technology for AQC, Outdoor Air Quality Applications.
- Hasenfratz D, Saukh O, Walser C, Hueglin C, Fierz M, et al. (2015) Deriving high-resolution urban air pollution maps using mobile sensor nodes. Pervasive and Mobile Computing 16: 268-285.
- Lerner U, Yacobi T, Levy I, Moltchanov SA, Cole HT, et al. (2015) The effect of ego-motion on environmental monitoring. Sci Total Environ 533: 8-16.
- Fujita EM, Campbell DE (2013) Review of current air monitoring capabilities near refineries in the san francisco bay area. Desert Research Institute (775): 673-7300.
- Kakosimos KE, Hertel O, Ketzel M, Berkowicz R (2010) Operational street pollution model (OSPM) - A review of performed application and validation studies, and future prospects. Environmental Chemistry 7(6): 485-503.
- Moltchanov S, Levy I, Etzion Y, Lerner U, Broday DM, et al. (2015) On the feasibility of measuring urban air pollution by wireless distributed sensor networks. Sci Total Environ 502: 537-547.
- Shum L V, Rajalakshmi P, Afonja A, Phillips G, Binions R, et al. (2011) On the development of a sensor module for real-time pollution monitoring. information science and applications (ICISA) International Conference, pp. 1-9.
- Alphasense Ltd Sensor Technology House (2015) AAN 104: How electrochemical gas sensors work. Alphasense Application Note (12): 1-4.
- Kaur S, Nieuwenhuijsen MJ, Colvile RV (2007) Fine particulate matter and carbon monoxide exposure concentrations in urban street transport microenvironments. Atmos Environ 41(23): 4781- 4810.
- Honicky R, Brewer E, Paulos E, White R (2008) N-smarts: networked suite of mobile atmospheric real-time sensors. In NSDR ’08 proceedings of the second ACM SIGCOMM workshop on networked systems for developing regions, pp. 25-30.
- Williams DE, Henshaw GS, Bart M, Laing G, Wagner J, et al. (2013) Validation of low-cost ozone measurement instruments suitable for use in an air-quality monitoring network measurement science and technology 24(6): 065803.
- Garg A, Shukla PR, Bhattacharya S, Dadhwal VK (2001) Sub-region (district) and sector level SO2 and NOx emissions for India: assessment of inventories and mitigation flexibility. Atmos Environ 35(4): 703-713.
- Sîrbu A, Becker M, Caminiti S, Baets B, Elen B, et al. (2015) Participatory patterns in an international air quality monitoring initiative. Plos One.
- Gaur A, Tripathi SN, Kanawadeet VP, Vinod T, Shukla SP (2014) Four-year measurements of trace gases (SO2, NOx, CO, and O3) at an urban location, Kanpur, in Northern India. J Atmos Chem 71(4): 283-301.
- Ahlawat A, Mishra SK, Gumber S, Goel V, Sharma C, et al. (2019) Performance evaluation of indigenously developed light weight gas sensor system with co-location gas analysers over Delhi. Science of the Total Environment 697: 134016.
- Chelani AB (2012) Persistence analysis of extreme CO, NO2 and O3 concentrations in ambient air of Delhi. Atmos Res 108: 128-134.
- 2015 GUMsim software, Germany.
© 2019 Mishra SK. This is an open access article distributed under the terms of the Creative Commons Attribution License , which permits unrestricted use, distribution, and build upon your work non-commercially.
Editor In Chief


.jpg)


Signup for Newsletter

Quick Links
 Editorial Board Registrations
 Submit your Article
 Refer a Friend
 Advertise With Us
Our Recent Edition

.jpg)


Top Editors


.jpg)


.bmp)
.jpg)
.png)
.jpg)


.jpg)


.png)

.png)


.png)


Financial Support

Sponsors

Latest e-Books

Latest Video

 a Creative Commons Attribution 4.0 International License. Based on a work at www.crimsonpublishers.com.
Best viewed in
a Creative Commons Attribution 4.0 International License. Based on a work at www.crimsonpublishers.com.
Best viewed in