- Submissions

Full Text
Environmental Analysis & Ecology Studies
Spatio Temporal Lake Level Change of Lake Abijata, Ethiopia: A Remote Sensing Approach
Binyam Tesfaw Hailu1,2* and Shimelis Girma1
1 College of Natural and Computational Sciences, Ethiopia
2 Department of Geography, Germany
*Corresponding author: Binyam Tesfaw Hailu, Department of Geography, Germany
Submission: February 27, 2019;Published: July 26, 2019

ISSN 2578-0336 Volume6 Issue1
Abstract
Lake environment Satellite images have an important role for lakes management and the spatio-temporal variation of lakes in size and shape. However, there is still a gap on the scientific assessment methods on Ethiopian lakes level change studies. Therefore, this research aimed on the spatial and temporal variability of decadal lake level changes of Lake Abijata using Landsat satellites images and possible change factors. The images were acquired for years 1972, 1984, 1995, 2003 and 2015. Then, these images were pre-processed and enhanced for the extraction of Lake Abijata's boundary. The result showed that in 1972, Lake Abijata has spatial extent or area of 198.4km2and declined to 179.2km2 and 150.6km2 in 1984 and 1994, respectively. Then, the decline of lake level continued for the year 2003, which becomes 144.9km2 and 131.8km2 in 2015.
That is, Lake Abijata shrunk to 66.6km2 from year 1972 to 2015. Moreover, the decline of the lake is mainly on the north western direction with a distance of 3.64km and in the south eastern direction the lake level shifted to center by 1.267km through the last four decades. Thus, this research revealed that Lake Abijata is a drastically shrinking or decreasing lake in Main Ethiopian Rift. This research has a great significance for decision makers in order to elucidate the spatial variation of lake level change of Lake Abijata for the last four decades and could be vital for mitigation and decision making, especially for environmental impact assessment and for better management of the lake’s environment.
Keywords: Remote sensing; Lake Abijata; Lake level change; Landsat satellite image
Introduction
A satellite-based remote sensing has enormous advantages and applications for Earth Sciences, environmental monitoring and natural resource management because it can track land surface information in real-time macroscopically, multi-temporally, multi-spectrally, dynamically, and repetitively Jawak et al. [1]. Remote sensing is the acquisition and analysis of data about an object or area acquired from a device that is not in contact with the object or area. Most of the remote sensors are placed in earth-observing satellites Fischer & Getis [2] and these earth observation satellites are designed to acquire digital images that used for many applications such as environmental monitoring, meteorology, monitor disasters and assessment of natural resources. Moreover, these satellite images have an important role for lakes and its environment management in quality of the water, the spatio-temporal variation of the size and shape of the lakes and water resources investigations. Surface water supply reservoir (lakes and reservoirs) mapping and monitoring, drainage network mapping, and watershed characterization are a few of those that depend on satellite images Khorram et al. [3].
The lakes/water bodies have been mapped using different earth-observing satellite imagery Hui et al. [4]. For example, measurement of the change of water bodies and their catchments, in terms of distribution and variation Ouma & Tateishi [5]. One of the changes in water bodies (lakes) is the lake level change that is described as surface water level change resulting from the shifting of water balance from its static state and this could be due to climate change and other natural and anthropogenic factors Ayenew [6] and Xuchun et al. [7].
The level of several Ethiopian lakes is changing drastically - either increasing or decreasing in surface area. Lake Beseka is rapidly increasing in water level/area Dinka [8] and Lakes Abijata, Chamo and Abaya, have shown significant decrease in water level over time Ayenew [6]. Even though, there were many studies by researchers about the lake level change in Ethiopia, there is still a gap on the scientific assessment methods of showing the lake level change. Therefore, this research paper aims to show spatial variability in terms of lake level change of Lake Abijata using earth observation satellites images for the last four decades.
These lakes have great importance in the development of economic, environmental and social programs for Ethiopia. Apart from these, the lakes have an immense role on the economic growth of the country and for the survival of the surrounding communities Abebe et al. [9]. As a result, this research has a great significance to decision makers in order to elucidate the spatial variation of lake level change of Lake Abijata for the last four decades. The information could be vital for mitigation and decision making on environmental impacts on the lake and for a better management of the lake’s environment.
Study area
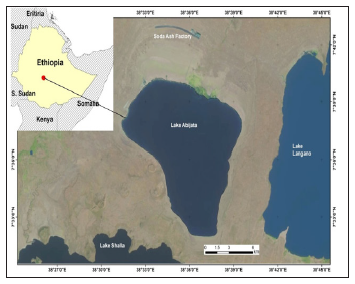
The study area is located between 7.32°N to 7.45°N and 38.29°E to 38.42°E, in the Main Ethiopian Rift (MER), specifically MER lakes region. Main Ethiopian Rift is a part of Ethiopian Rift Valley, which bisects Ethiopia land into two main physiographic segments Corti [10]. MER has three subdivisions geographically: Northern MER, Central MER, and Southern MER. The Abijata lake is one of the lakes in Central MER besides Lakes Langano and Shalla, which are situated East and South-West of Lake Abijata, respectively (Figure 1).
Figure 1:Study area location showing Lake Abijaya with Lake Langano and Shalla in landsat 8 satellite image acquired in 2015.

Material and Methods
This study applied a remote sensing approach, in which satellite imagery integrating with field data, were analyzed using advanced image processing techniques (Figure 2). Firstly, five earth observation satellite data were acquired from 1972-2015 in order to get image with the same season and less cloud cover of the area. Secondly, these images were pre-processed such as sub-setting techniques. Thirdly, the lake boundaries of each year were extracted from the satellite images. Then, area and perimeters of the lake for each year images were calculated and tabulated in Geographic Information System (GIS) platform called ArcGIS. Finally, the lake level change of Lake Abijata was analyzed and validated from field observation.
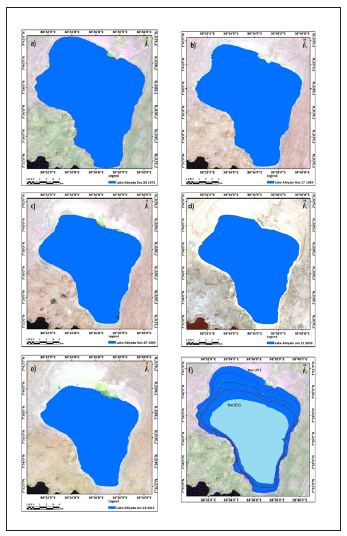
Figure 2:Lake Abijata level change in a) 1972 b) 1984 c) 1994 d) 2003 and e) 1915 f) between 1972 and 2015.

Materials
Earth observation satellite data
The earth observation satellite data were from the Landsat satellite missions. We used Landsat satellite images. These satellites have been collecting multispectral images of Earth from space since 1972, each image contains multiple bands of spectral information which may require significant pre-processing in order to get the valuable image for different applications. In order to ease this significant time taking pre-processing, these images became available for users with a natural color composites of multi-spectral images. These images are full resolution files derived from Landsat Level 1 data products, in which the geometric and radiometric correction were done before distributing to the users USGS [11]. The natural color image is a composite of three bands are to show a natural looking ("false color") image. Reflectance values were calculated from the calibrated scaled Digital Number (DN) of the source image data. The band combination for the natural color or false color composite is different on the Landsat series based on the band arrangement and combination (Table 1). The Landsat program is the longest-running enterprise for acquisition of satellite imagery of Earth USGS [11]. Landsat image band combination of natural colors were dependent on the sensors type and the description of bands also varied as shown in Table 1.
Table 1:Landsat image band combination and description.

The Multispectral Scanner (MSS) sensor was launched on-board Landsat 1-5 starting from July 1972 to January 1999 Levin [12]. Most of the scenes are processed with Standard Terrain Correction (Level 1T) and the revisiting date of this sensor is 18 days Gyanesh et al. [13]. The Landsat Thematic Mapper (TM) sensor was carried onboard Landsat 4 and 5 from July 1982 to May 2012 with a 16-day repeat cycle. Most Landsat 4 and 5 TM scenes are processed through the Level 1 Product Generation System (LPGS). The image product from this sensor has projection of UTM_WGS 84 which is taken with repeating cycle of 16 days.
Enhanced Thematic Mapper Plus (ETM+) was built by SBRS (Santa Barbara Remote Sensing) and mounted on Landsat 6 and 7. Landsat 7’s ETM+ is a derivative of the Thematic Mapper (TM) engineered for Landsat 4 and 5 with some additional features. LANDSAT 8 satellite sensor is part of the Landsat Data Continuity Mission was successfully launched on February 11, 2013. The satellite has two main sensors: The Operational Land Imager (OLI) and the Thermal Infrared Sensor (TIRS) Nischal et al. [14]. OLI collects images in nine spectral bands with the wavelengths of visible, near-infrared, and shortwave infrared whereas TIRS rely on the highly accurate measurements of Earth's thermal energy Nischal et al. [14].
Digital Elevation Model (DEM) and field data
Digital Elevation Model (DEM) data with 30m spatial resolution of the study area was utilized to determine the altitude of the lake. After the analysis and extraction of water bodies from the Landsat image, the result was validated from field work. The field data also used for checking the status of the lake level in 2015 using Global Positioning System (GPS) device to collect the coordinates at the contact between the lake water level with the surface. The field work also incorporates some photographs taken at the same season of the acquisition of satellite images.
Methods
Earth observation data acquisition and processing
The methods used in this research was commenced with acquisition of Landsat imagery for the year 1972, 1984, 1994, 2003 and 2015. These images were acquired at the dry season of each year (October to March) to get images at same seasons and with very low cloud cover (less than 10%). Secondly, the data were pre-processed to get appropriate information about the lake boundary. This pre-processing stage includes image calibration and sub-setting, which is a process of clipping the study area for each year from the satellite images. Thirdly, the images were enhanced by using band combination method that is useful to combine bands in Red, Green, and Blue colors (R-G-B composites). Therefore, in this research, different bands of the five sensors were combined in R-G-B as described in Table 1.
Mapping and lake level change analysis
The lakes were mapped by extracting each lakes feature from the processed Landsat images. This extraction was semi-automated, which includes identification of water bodies from the R-G-B composite images and manual extracting features on-screen or heads-up extraction of features. Then, the extracted Lake Abijata boundaries of each year were used for lake level change analysis in order to investigate the change of lake Abijata from year 1972 to 2015. Finally, the change in 2015 was checked with field work that was taken at the same season with the acquired satellite image. These field data were used in validating the lake level change extracted from the Landsat satellite imagery.
Result
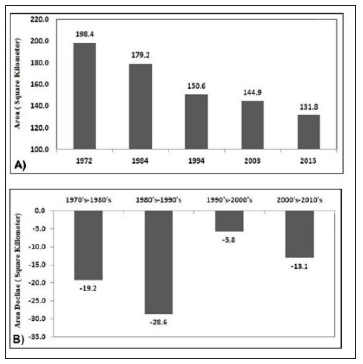
The result shows that Lake Abijata is a drastically shrinking or decreasing lake (Figure 2). Initially, in 1972, Lake Abijata had spatial extent of 198.4km2 area and declined in the first two decades by 19.2 km2 and 28.6km2 in 1984 and 1994, respectively (Figure 3). That is, it had area of 179.2km2 (1984) and 150.6km2 (1994). Then, in the third decades relatively the lake declined slightly by 5.7km2 with an area of 144.9km2 in 2003. From 2003 to 2015, which is the in the fourth decade, it further declined by 13.1 km2 and had an area of 131.8km2.
Starting from 1973 to 2015, Lake Abijata declined by 66.6km2 in its lake area (Figure 2 & 3). Moreover, the direction of decline of the lake is mainly on the north western direction shrunk by a distance of 3.64km and in the south eastern direction where the lake level shifted to center by 1.267km through the last four decades as shown Figure 3.
Figure 3:Graphs of A) Lake Abijata’s surface area change from year 1972 to 2015. B) Decadal lake level change of Lake Abijata.

The GPS data collected from lake's surrounding shows the current status of the lake’s boundary in its geographic location. The GPS reading taken at the southern tip of Lake Abijata that was taken in January 2016, which is the same season of image acquisition, shows that there is a 1.267km distance variation from the boundary extracted year 1972 Landsat satellite image (Figure 4).
Figure 4:Lake Abijata’s lake level change at the southern part of the lake with GPS point data.

Discussion
Remote sensing has a great advantage in detecting the spatio-temporal change of geographic features. The satellite imagery is one way of assessing the variation of geographic features through specified time interval. World-wide, there are various satellites which produce different types of imagery used for different purposes. From these satellites’ imagery, Landsat satellite image is the major in representing the world’s longest and continuously acquired image data since 1972. The images from Landsat satellite have been providing a unique resource image data for different applications such as agriculture, geology, forest, settlement area, and water bodies researches Herold et al. [15] and Wilson et al. [16], which is like the application used in this research. Moreover, the Landsat image are used in water body management to detect the level changes of lakes using the spatiotemporal image data. For instance, water level change of Lake Seyfe in Turkey was studied using Landsat image by Reis & Yilmaz [17].
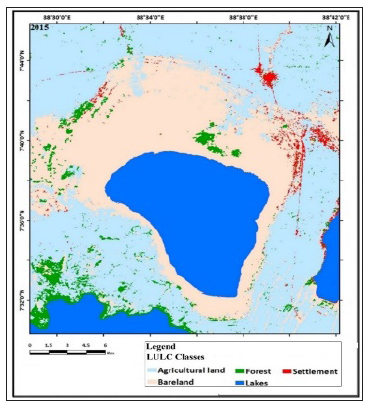
Figure 5:Land use land cover map of Lake Abijata and the surroundings.

Many researchers have used the Landsat satellite images as an essential input data alone and integrating with other relevant data for the assessment of lakes level change in Ethiopian lakes. For example, Ayenew [6] used these images with the Hydro-meteorological data study the lake level change of Lake Abijata and the hydrodynamics of selected Ethiopian Rift Lakes. Our research result is also in line with Ayenew [6] and the lake level change in a decadal variation is continuously declining (Figure 5).
According to Meshesha et al. [18], the decline in the size of the lake was mainly affected by Land Use - Land Cover (LULC) and land degradation. This effect was also seen in this research after mapping a Land Use and Land Cover (LULC) of lake Abijata and surroundings as shown in Figure 5. This LULC was mapped with knowledge-based classification method from dry season of year 2015 satellite image to know what causes the drastic lake level change of Lake Abijata. The LULC map shows that the surrounding area was covered by dry sand that is represented as bare land on the map (Figure 5). Therefore, the land cover change could be considered as one of the driving factors for the declining of the lake and the land use type of the surrounding lake directly or indirectly affects the lakes level because the absence of forest and vegetation to the lake's surrounding (the cover of bare land area) might promote the evaporation of the lake water [19].
Furthermore, the decline of Lake Abijata was associated with the establishment of soda ash factory since 1985. According to Kebede et al. [18], Ayenew [6], Ayenew & Legesse, [20], the establishment of soda ash industry was mainly considered as the major cause for the rapid decline of Abijata Lake. However, abstraction of the lake water for soda ash factory was not the only factor for the decline of the lake. Because the lake had also shrunk by 1.08km in the north and by a total area of 19.165km2 before the establishment of soda ash factory. Although this research focused on remote sensing application for lake level change, there is a need to integrate this technology with other methods to investigate the lake level volumetric change.
Conclusion
The Landsat satellite image is used for different applications related to environmental management aspect. From these image processing, we found that Lake Abijata has drastically declined by 66. 64 km2 (33.59%) from its initial spatial extent in year 1972 to 2015 and this decline of lake level is continuous. The possible causes for this change could be
A. Abstraction of the lake water for soda ash factory and
B. The land cover/land use change and promote the evaporation of the lake water.
Therefore, researchers and concerned government bodies should give attention on the sustainability of the lake and its environmental impact to the region.
Acknowledgment
The authors would like to acknowledge School of Earth Sciences, Addis Ababa University for providing us office and laboratory facilities. Dr. Binyam Tesfaw Hailu is currently a George Forster Postdoctoral Research fellow of Alexander Von Humboldt Foundation.
References
2. Fischer MM, Getis A (2010) Handbook of applied spatial analysis: Software tools, methods and applications, Springer, Verlag Berlin Heidelberg, Germany, p. 15.
3. Khorram S, Koch FH, van der Wiele CFC, Nelson SA (2012) Remote sensing. Springer, Heidelberg, Dordrecht, New York, USA, p. 65.
11. USGS (United State Geological Survey) (2015) Landsat 8 (L8) Data users handbook: version 1.0, Department of the Interior US Geological Survey, pp. 2-3.
12. Levin N (1999) Fundamentals of remote sensing, Remote sensing laboratory, Geography Department, Tel Aviv University, Israel.
© 2019 Binyam Tesfaw Hailu. This is an open access article distributed under the terms of the Creative Commons Attribution License , which permits unrestricted use, distribution, and build upon your work non-commercially.
 a Creative Commons Attribution 4.0 International License. Based on a work at www.crimsonpublishers.com.
Best viewed in


.jpg)


 Editorial Board Registrations
 Submit your Article
 Refer a Friend
 Advertise With Us
.jpg)


.jpg)


.bmp)
.jpg)
.png)
.jpg)


.jpg)


.png)

.png)


.png)


