- Submissions

Full Text
Environmental Analysis & Ecology Studies
Annual and Seasonal Variation of Rainfall in Urban Landscapes of the Bengaluru Region, India
S Rajashekara
General Management, Corporate Governance, India
*Corresponding author: S Rajashekara, General Management, Corporate Governance, India
Submission: April 26, 2018;Published: April 24, 2019

ISSN 2578-0336 Volume5 Issue3
Abstract
An investigation has been carried out to govern the monthly, seasonal and annual rainfall variations in urban landscapes of the Bengaluru region, India for the period 2007-2015. Maximum rainfall of 790.55mm occurred in 2007 with 98 rainy days. Maximum rainfall of 95.64mm was received in the month of September during Southwest monsoon season. Greatest rainfall was received from the months of both southwest and northeast monsoons. Also, measuring rainfall forms a very important input for the economic planning of the country. Based on the outcomes, the configurations of soil and water conservation for the crop forecasting and management can be premeditated. Thus, conservation methods can be prepared for the agricultural practices and/improvements made through by the restoration of ponds and water check-dams.
Keywords: Rainfall distribution; Seasonal rainfall: Rainy days; Urban landscapes
Introduction
The main source of small amount of water is precipitation in the form of rain or snow. So, measurement of this precipitation (Rainfall/Snowfall) becomes necessary since it forms a very important input for the economic planning of a country. Precipitation could be either in liquid form (Rainfall including drizzle, rain and shower) or solid form (Snowfall), or mixed form (Sleet). Whether it is in the form of rain or snow, precipitation is measured and expressed in terms of depth or thickness of layer it would form on the horizontal surface of the earth if there were no loss by evaporation, runoff or by infiltration [1]. India is blessed with two distinctive phases of monsoon. About 80% of our national average rainfall received from southwest monsoon phase and the rest 20% showers from the northeast phase of monsoon. Annual and seasonal (especially monsoon) rainfall from different parts of India in addition to the world is showing variability and tendency, either increasing or decreasing [2,3].
From past several decades, studies are mainly focusing on the pattern of monsoon rainfall in India that have been instigated to assess the trends [4-6]. Consequently, scientists also have explored the variability and trend of rainfall at regional scale and at several meteorological stations and substations of cities, India [7-10]. Furthermost of these studies are conducted at the daily, monthly, annual and seasonal scale to comprehend the trend and pattern of distribution and many studies also failed to detect any precise trend [11]. But increasing or decreasing trends were established in monthly rainfall in the different regions of India [3,12- 23]. The above review of literature is mainly for consideration of the rainfall analysis was investigated for important metropolitan and sub-metropolitan stations located within the Indian region. Keeping the above views in attention, an effort has been made to investigate the distribution nature of rainfall which will be convenient for proper agricultural crop planning and its management.
Materials and Methods
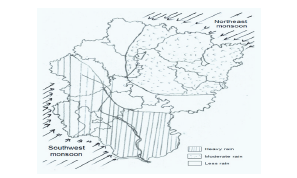
Bengaluru city is the fifth largest city in India and is also known as the Garden City- “Udhyaana Nagara” (Means city full of parks) because of its many beautiful parks, lakes, gardens and natural vegetation. Bengaluru is situated in the South Deccan plateau of the Peninsular region of India, occupying an area of 2,191km of metropolitan area inhabiting 9 million population [24] (Figure 1). This city is composed of urban landscapes from dry deciduous forests scrub with open to closed canopy evergreen forests along the streams, urban to semi-urban regions. Three main seasons-winter (December to February), summer (March to May) and monsoon (June to November) are found in this region. An average maximum and minimum temperatures are 36 °C and 14 °C respectively. Generally, the Bengaluru region has humidity range is 35-80%.
Figure 1:Map showing the dissemination of rainfall along the urban landscapes of the Bengaluru region.
The floral species play a major role with various kinds of widely distributed trees in various urban landscapes of the Bengaluru region. The flora with numerous species comprising bushes, shrubs and trees has generated an effective local integrated and synergetic relationship with associated fauna of this region including mammals, birds, reptiles, amphibians and several species of invertebrate fauna mainly butterflies, ants and dragonflies, etc. Daily rainfall data for nine years (2007 to 2015) were collected from the mass communication media mainly from the Deccan Herald (English) newspaper which was proudly announced by the authorities of the Indian Meteorological Department (IMD), Bengaluru. This daily was converted into annual, monthly and seasonal rainfall for further analysis.
The correlation between rainfall and rainy days was found by plotting annual, monthly and seasonal rainfall against rainy days. Finally, data on the occurrence and distribution of rainfall in different years were statistically analyzed using chi-square test using PAST version 1.60 software [25]. The difference in the rainfall in the different season-wise was analyzed using one-way analysis of variance (ANOVA)-Tukey’s Honestly Significant Difference test (HSD) [26].
Result and Discussion
Annual rainfall and rainy days
Annual rainfall data and rainy days for nine years from 2007 to 2015 are given in Table 1. Maximum and minimum rainfall occurred in 2007 (790.55mm) and 2013 (238.80mm) with 98 and 66 rainy days, respectively. Average for these nine years rainfall was 538.031mm. There is no significant difference in the year-wise distribution of rainfall (x2=1.2222, df=9, P>0.05). It was also observed that 5 years (55%) received rainfall above average, however, no general trend in rainfall occurrence was observed during these years. Average annual rainy days were 83.33 and varied from 47 days (2014) to 123 days (2008) (Table 1). Again, no significant difference found in a day rainfall (x2=0.3333, df=9, P>0.05) during the study period.
Table 1:Annual rainfall and rainy days for a period of 2007-2015.
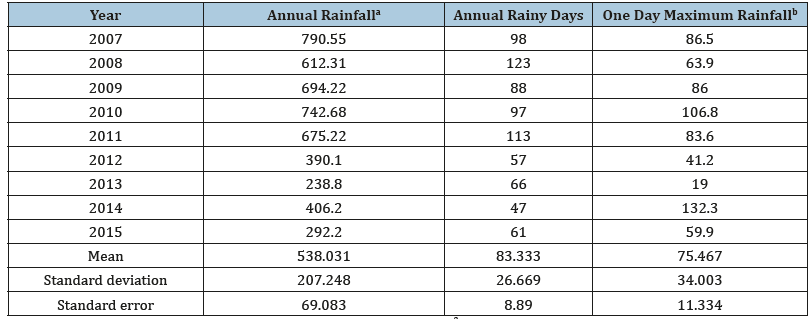
a Rainfall distribution in year-wise was not significantly different (x2=1.2222, df=9, P>0.05).
b One day rainfall was not significantly different (x2=0.3333, df=9, P>0.05).
No specific trend was observed; however, the rainy days were above average for 9 years. Although a linear relationship was seen between amount of rainfall and rainy days, however the maximum rainfall does not occur in the corresponding rainy days, which may be due to fact that heavy rain occurred on a single day during monsoon season.
Monthly rainfall and rainy days
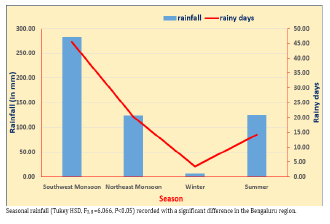
The mean monthly rainfall and rainy days are presented in (Figure 2). Maximum rainfall of 95.64mm was received in the month of September during Southwest monsoon season. Minimum rainfall of 0.21mm was received in January. There was a significant difference in the distribution of rainfall (x2=4.5999, df=11, x2 12(0.05)=0.000) in different months. Maximum rainfall (282.25mm) was received in the month of June to September during southwest monsoon season. Minimum rainfall of 6.1mm was received by December to February during winter season (Figure 3). Mean monthly rainfall was 44.84mm and observed in the six months above and six months below the mean.
Figure 2:Mean monthly rainfall and rainy days for the period of 2007-2015.
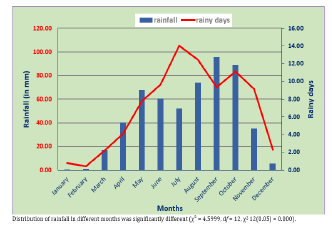
The number of rainy days drives in hands with the mean monthly rainfall. The rainy days receives during the winter, summer, northeast and southwest monsoons are 3.56, 14.11, 20.22 and 45.44 days, with rainfall of 6.71, 125.07, 124.01 and 282.25mm respectively Figure 3. Also, a significant difference was recorded in the rainfall of different seasons (Tukey HSD, F3, 8=6.066, P<0.05) in the urban landscapes of the Bengaluru region during the study period. Thus, it is concluded that maximum rainfall was received during southwest monsoon.
Figure 3:Seasonal distribution of rainfall and rainy days in the urban landscapes of the Bengaluru region during the study period.
Relationship between rainfall and rainy days
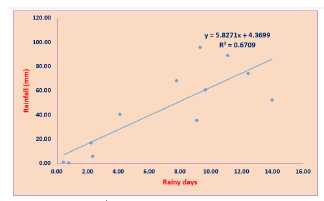
It is mostly assumed that total rainfall is the function of total number of rainy days. There is existence of a linear relationship between the two parameters-total rainfall and total number of rainy days when subjected to the correlation coefficient analysis. The regression equation (y=5.8271x+4.3699; R²=0.6709) was developed between the variables rainfall (Y) and rainy days (X), in which 67.09 % of the variables will follow this relationship (Figure 4).
Figure 4:Correlation between the rainfall and rainy days.
Conclusion
This study was concentrated for analyzing the pattern of rainfall in the urban landscapes of the Bengaluru region, Karnataka, India. For this perseverance daily rainfall data of 9 years (2007 to 2015) was used to assess the daily, monthly, seasonal and annual pattern of rainfall. This study also appraised to reveal the relationship between the amount of rainfall and the number of rainy days. In a country like India practically the entire economy tends to depend on the arrival of the monsoon and small farmers rely on rains to irrigate the agricultural fields. It becomes necessary, therefore, to be able to compute the amount of rain received in a season or year and relate it to economic parameters. Thus, measuring rainfall forms a very important input for the economic planning of the country [1].
Based on the outcomes, the configurations of soil and water conservation for the crop forecasting and management can be premeditated. Thus, conservation methods can be prepared for the agricultural practices and/improvements made through by the restoration of ponds and water check-dams. Urban meteorology has derived to need considerably more than detecting and forecasting the weather of the greater Bangalore metropolitan areas [27]. Unexpected variability and increased suspicions about the rainfall pattern, periods, days and amount, and jeopardy of weather limits as an impact of global climate change provoked by the ecological and anthropogenic factors as local climate factors [28]. Thus, climate change will rigorously influence the Indian monsoon in terms of generating more extravagances and this also form impact on the biodiversity of flora and fauna.
References
- Balasubramanian KV (2010) How much did it rain? Science Reporter, pp. 8-14.
- IPCC (2007) The physical science basis. Contribution of working group I to the fourth assessment report of the intergovernmental panel on climate change, Cambridge University Press, UK, p. 996.
- Tank AMGK, Peterson TC, Quadir DA, Dorji S, Zou X, et al. (2006) Changes in daily temperature and precipitation extremes in central and south Asia. Journal of Geophysical Research 111(D16105): 1-8.
- Sarker RP, Thapliyal V (1988) Climate change and variability. Mausam 39: 127-138.
- Naidu CV, Rao BRS, Rao DVB (1999) Climatic trends and periodicities of annual rainfall over India. Meteorological Applications 6: 395-404.
- Guhathakurta P, Rajeevan M (2008) Trends in the rainfall pattern over India. International Journal of Climatology 28(11): 1453-1469.
- Jagannathan P, Parthasarathy B (1973) Trends and periodicities of rainfall over India. Monthly Weather Review 101(4): 371- 375.
- Jagannathan P, Bhalme HN (1973) Changes in the pattern of distribution of southwest monsoon rainfall over India associated with sunspots. Monthly Weather Review 101(9): 691-700.
- Parthasarathy B (1984) Inter-annual and long-term variability of Indian summer monsoon rainfall. Proceedings of the Indian Academy of Sciences (Earth Planetary Sciences) 93(4): 371-385.
- Kumar KR, Pant GB, Parthasarathy B, Sontakke NA (1992) Spatial and sub seasonal patterns of the long-term trends of Indian summer monsoon rainfall. International Journal of Climatology 12(3): 257-268.
- Parthasarathy B, Dhar ON (1975) Trends analysis of annual Indian rainfall. Hydrological Sciences-Bulletin-XX, 26: 257-260.
- Koteswaram P, Alvi SMA (1969) Secular trends and periodicities in rainfall at west coast stations in India. Current Science 38(10): 229-231.
- Virmani SM, Sivakumar MVK, Reddy SJ (1982) Rainfall probability estimates for selected locations of semi-arid India. Research Bulletin No. 1, Patancheru, Andhra Pradesh, India, p. 19.
- Panigrahi B (1998) Probability analysis of short duration rainfall for crop planning in coastal Orissa. Indian Journal Soil Conservation 26(2): 178-182.
- Vishwakarma SK, Ranade DH, Paradkar VK, Jain LK, Tomar AS (2000) Probability analysis of wet and dry spells for agricultural planning at Chhindwara. India Journal of Agricultural Science 70(10): 719-721.
- Tomar AS, Ranade DH (2001) Predicting rainfall probability for irrigation scheduling in black clay soil in Indore region of Madhya Pradesh. Indian Journal of Soil Conservation 29(1): 82-83.
- Chakraborty PB, Mandal APN (2008) Rainfall characteristics of Sagar Island, West Bengal. Indian Journal of Soil Conservation 36(3): 125-128.
- Kumar KK, Prasad RV, Gopakumar CS (2009) Rainfall trends in twentieth century over Kerala, India. Atmospheric Environment 43(11): 1940- 1944.
- George G, Charlotte BV, Ruchith RD (2011) Interannual variation of northeast monsoon rainfall over southern peninsular India. Indian Journal of Geo Marine Sciences 40(1): 98-104.
- Rajendran V, Venkatasubramani R, Vijayakumar G (2016) Rainfall variation and frequency analysis study in Dharmapuri district, India. Indian Journal of Geo Marine Sciences 45 (11): 1560-1565.
- Arulmozhi S, Arulraj GP (2016) Rainfall variation and frequency analysis study of Salem district Tamil Nadu. Indian Journal of Geo Marine Sciences 46 (1): 213-218.
- Sreekesh S (2017) Rainfall variation in Lakshadweep Islands. Indian Journal of Geo Marine Sciences 45 (11): 1603-1609.
- Rajendran V, Venkatasubramani R (2017) Frequency analysis of rainfall deviation in Dharmapuri district in Tamil Nadu. Indian Journal of Geo Marine Sciences 46 (08): 1710-1714.
- Census of India (2011) Provisional Population Totals: Cities having population 1 lakh and above. Government of India, India.
- Hammer Ø, Harper DT, Ryan PD (2001) Past: Paleontological statistics software package for education and data analysis. Palaeontologia Electronica 4(1): 1-9.
- SPSS Inc (2008) SPSS for windows, Rel 17.0.0., Chicago, SPSS Inc, USA.
- OFCMSSR (2004) Urban meteorology: Weather needs in the urban community, FCM-R22-2004, Officer of the federal coordinator for meteorological services and supporting research, Maryland, USA.
- Kundzewicz ZW, Schellnhuber HJ (2004) Floods in the IPCC TAR perspective. Natural Hazards 31(1): 111-128.
© 2019 S Rajashekara. This is an open access article distributed under the terms of the Creative Commons Attribution License , which permits unrestricted use, distribution, and build upon your work non-commercially.
 a Creative Commons Attribution 4.0 International License. Based on a work at www.crimsonpublishers.com.
Best viewed in


.jpg)


 Editorial Board Registrations
 Submit your Article
 Refer a Friend
 Advertise With Us
.jpg)


.jpg)


.bmp)
.jpg)
.png)
.jpg)


.jpg)


.png)

.png)


.png)


