
- About Us
- Information
-

The Author ensures that the research has been conducted responsibly and ethically with adherence to all relevant regulations. read more..
- For Authors
- For Reviewer
- Manuscript Guidelines
- Membership
- Publication Ethics
-
- Journals
- Reprints
- e-Books
- Videos
- Policies
- Contact Us
 COVID-19
- Submissions


Full Text
Environmental Analysis & Ecology Studies
A Preliminary Study on the Calibration in Precipitation Forecast in China
Hai Peng Zhang, Xie Fei Zhi* and Lu Ying Ji
Key Laboratory of Meteorological Disasters, Ministry of Education (KLME) /Collaborative Innovation Center on Forecast and Evaluation of Meteorological Disasters (CIC-FEMD), Nanjing University of Information Science & Technology, Nanjing, China
*Corresponding author: Xie Fei Zhi, Key Laboratory of Meteorological Disasters, Ministry of Education (KLME) /Collaborative Innovation Center on Forecast and Evaluation of Meteorological Disasters (CIC-FEMD), Nanjing University of Information Science & Technology, Nanjing, China
Submission: December 21, 2018; Published: January 22, 2019

ISSN 2578-0336 Volume4 Issue5
Abstract
Based on the rainfall data taken from the Public Meteorological Service Center, China Meteorological Administration (CMA), the calibration of the precipitation forecast has been performed by using frequency matching method (FMM) and threshold method. Then the performance of calibration is evaluated by using MAE, TS, etc. The results show that the calibration can significantly reduce the ensemble system’s false alarm of light rain and improve the QPF for a “Rain or No Rain” event. The calibrated precipitation forecasts are much closer to the observation, and the mean absolute error and area bias (dry bias or wet bias) of the ensemble system are reduced considerably.
keywordsCalibration; Precipitation forecast; Frequency matching method; Threshold; Verification
Introduction
With the rapid advances in numerical weather prediction (NWP), NWP products have become more and more important for the weather forecasters in China [1]. However, due to the uncertainty of initial field and the numerical model itself, forecast errors exist inevitably in NWP products. Therefore, some statistical post-processing techniques are frequently applied to calibrate the forecast data for the purpose of obtaining more skillful forecast results. Some scientists in China have investigated the calibration approaches of the NWP products and significantly improve the forecast skills [2,3]. Precipitation forecasts are of importance for prevention and mitigation of meteorological disasters as well as management of water resources and many important applications which require more accurate QPFs [4,5]. Therefore, the statistical post-processing technology for precipitation forecasts has been prominently established. Ebert [6] proposed a “frequency matching” method (FMM) to improve the problem that light rain’s area is too large and heavy rain’s area is too small caused by ensemble mean. Then a lot of scientists used this method to improve the precipitation forecast skills [7-10].
In addition, there are some other post-processing methods which have been applied to the calibration of precipitation forecasting [11,12]. In this paper calibrations are conducted for the multimode consensus forecasting of the precipitation provided by the Public Meteorological Service Center, CMA. The false alarm rate of light rain of these forecast data is high. Therefore, the calibration of light rain can significantly improve the forecast skill.
Data and Methods
Data and model bias
The Public Meteorological Service Center, CMA provides the multimode consensus forecasting products for this study. The daily precipitation forecast products with lead times of 1-7days (24- 168h) with initial time 0000 UTC at 2603 stations in China and the observational precipitation data at these stations are used to verify the forecasts of the precipitation. The data cover the period of January 1st to December 16th in 2015 and the study area is over China. The following calibration is carried out for the stations in China.
Figure 1:Precipitation frequencies of precipitation thresholds with the lead time of 24h.

As shown in Figure 1, the precipitation forecast frequency of each Threshold is higher than the observation, and the wet bias is obvious. Not only are there a large amount of false alarms in light rain, wet bias also exists in heavy rain, which leads to poor skills of the multimode consensus forecasting.
Calibration Method
Frequency matching method
Zhu & Luo [8] conducted the calibration of the precipitation forecasts based on the frequency matching method. The principle of frequency matching method is to adjust the cumulative frequency distributions of precipitation forecast, that is, to calculate the calibration coefficient of different precipitation thresholds, and calibrate the precipitation amount. The preceding forecasts and observed values over an area in China are counted in the training period because the cumulative frequency varies with different lead times and different precipitation thresholds. Therefore, different precipitation thresholds of different lead times are calibrated, respectively. The precipitation frequency of the forecasts and observed values are calculated as follows:
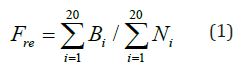
Figure 2:Area partition for the precipitation calibration using FMM.

where Fre is the frequency of precipitation reaching a certain threshold in the training period, Bi is the total number of stations whose precipitation reaching a certain threshold in the training period and Ni is the total number of stations in the training period every day. In order to obtain a sufficient number of samples, the past 20days are taken as the training period for calculating precipitation frequency. Considering difference in precipitation characteristics is large in different regions and relatively consistent in the adjoining areas, China is divided into six sub-regions, namely Northwest (NW), Southwest (SW), Northeast (NE), North China (NC), the middle and lower reaches of the Yangtze River (YZ), and Southeast China (SE) as shown in Figure 2. The frequency of 14 daily precipitation amount thresholds of 0.1, 1, 2, 4, 6, 8, 10, 15, 20, 25, 30, 40, 50, 60mm are counted in each sub-region of China, and the frequency of observed values is used as the reference frequency.
In this paper, a simplified frequency matching method is adopted and the ratio of the observed frequency to the forecast frequency of the precipitation is used as the calibration coefficient of different thresholds. The frequency matching calibration can be conducted by linearly interpolating the calibration coefficients of all thresholds and multiplying the precipitation forecasts by the corresponding calibration coefficients.
Threshold method based on “Optimal TS Score”
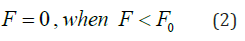
Zhi et al. [13] conducted a statistical downscaling study using categorized rainfall regression on daily precipitation ensemble forecast data in summers of 2011-2013 and calibrated the downscaling forecast results by threshold method, which can greatly reduce the false alarm rate of light rain. In this paper the results of the FMM are calibrated by the threshold method to further reduce the occurrence of false alarms of light rain and the principle is shown in Equation 2. In the training period F is forecast value and F0 is a set of thresholds of 0.1-2mm with a 0.1mm interval. Forecasts are calibrated based on the set of thresholds at all stations respectively and the TS score of precipitation above 0.1mm is calculated to obtain a threshold-score sequence. When the TS score reaches the highest, the corresponding threshold is taken as the elimination threshold F0 in the forecast period. When the precipitation forecast value is less than F0, the precipitation amount will be calibrated to be 0. As shown in Figure 3, when F0 is 0.7mm, the TS score in training period reaches the maximum value, so 0.7mm is used as the elimination threshold in the forecast period.
Figure 3:The TS corresponding to each of the elimination thresholds in the training period.

Verification methods
TS = NA / (NA+ NB + NC) (3)
False Alarm Rate = NB / (NA+ NB) (4)
Accuracy = (NA+ ND) / (NA+ NB + NC + ND) (5)
NA represents the number of stations where both forecasts and observations reach a threshold of certain precipitation amount. NB is the number of stations with false alarms where forecasts reach a certain precipitation amount threshold, whilst the observed values do not. NC is the number of stations with missing forecast where observations reach a certain precipitation threshold and the forecasts do not. ND represents the number of stations with no rain both in forecasts and observations. The larger the TS score of the precipitation forecast, the higher the forecast skill.
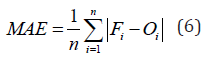
Mean Absolute Error (MAE) can reflect the deviation between the forecast and the observed value. n is the total number of stations, Fi is forecast value and Oi is observed value at each station in the forecast period.
Area Bias = F / O −1 (7)
and O are the number of stations where forecasts and observed values reach a certain precipitation amount threshold. And the positive (negative) area bias indicates the wet (dry) bias.
Precipitation Forecast Calibration
The above-mentioned methods are applied to calibrate the 24-168h precipitation forecasts at 2603 stations in China and the training period for FMM calibration takes the preceding 20days. The forecast period starts from January 21st to December 16th for 330days.
Figure 4:Impact of calibration on precipitation intensity and mean absolute error of 24h forecast over all stations. (a)(c): June, (b)(d): November

Figure 4 shows that the average daily precipitation trend of forecasts among all stations is consistent with the observation, which indicates that the forecast can reflect the process of precipitation generally. The calibration significantly improves precipitation forecast skill and reduces the forecast error in June and November. After performing the calibration, the daily mean precipitation in June and November are both closer to observed values (Figure 4a, Figure 4b). The daily mean absolute error also decreased by a maximum of 3.3mm in June and by a maximum of 1.9mm in November, and the improvement in June is better. It can be found that the calibration is more effective for date with large mean absolute error, such as November 3rd-6th, November 25th and November 28th, while the effect is less obvious for date with low mean absolute error.
The comparison between TS scores of different precipitation thresholds with and without calibration is shown in Figure 5. The improvement of light rain forecast TS score is the best up to 0.05 with the lead time of 24h, and the TS score of moderate rain is slightly lower after the calibration with lead times of 96-168h. The growth in TS scores of the moderate rain and light rain decreases with increase of the lead time. After calibration the TS score of heavy rain is basically improved by about 0.01 while the forecast skill of rainstorm is better with lead times of 96-168h than 24-72h.
Figure 5:
TS of different precipitation thresholds with and without calibration.
(a) Light rain,
(b) Moderate rain,
(c) Heavy rain,
(d) Rainstorm

The event or none-event correct rate is a reliable indicator whether the model is accurate or not in the qualitative forecast for a “rain or no rain” event. And it is closely related to the phenomenon of false alarms of light rain. The false alarm rate of light rain with lead times of 24-168h are significantly reduced after calibration up to 12.4% with lead time of 24h and the improvement decreases with lead time increasing (Figure 6a). Based on obvious reduction of false alarm rate of the light rain, Figure 6b shows that the event or none-event correct rate is greatly improved by about 4%-8.6%, which improves the forecast skill of ensemble system. Increase in event or none-event correct rate is of great significance to the operational forecast at meteorological observatory.
Figure 6:
Impact of calibration on “rain or no rain” forecast skill.
(a) False alarm rate of light rain,
(b) Event or none-event correct rate

Figure 7:
Impact of calibration on precipitation area bias.
(a) 24h,
(b) 48h,
(c) 72h,
(d) 96h,
(e) 120h,
(f) 144h,
(g) 168h

Figure 7 shows the area bias of each precipitation amount threshold with and without calibration with lead times of 24-168h. The area bias of four precipitation amount thresholds is large wet bias in 24-72h forecasts and the larger the precipitation amount threshold, the greater the wet bias. After calibration the wet bias are significantly reduced and the improvement of the forecast for the precipitation of more than 25mm is better than that below 25mm. The 96-168h forecasts have a smaller area bias than the 24-72h forecasts. The calibration not only reduces the wet bias of the small-magnitude precipitation but the dry bias of precipitation above the 25mm is also reduced, which effectively improves the missing rate of large-magnitude precipitation.
In summary, the calibration based on the FMM can greatly improve the forecast skill of the 24-168h precipitation forecasts.
Concluding Remarks
The calibration of the 24-168h precipitation forecasts has been performed by using frequency matching method and threshold method. The following conclusions have been reached:
A. The FMM and threshold method can significantly reduce the occurrence of false alarms of light rain, increase the event or none-event correct rate of precipitation forecast, and improve the forecast skill of different categories of the precipitation amount with lead times of 24-168h.
B. The FMM calibrates the precipitation area bias by adjusting the rainfall amount, so the false alarm rate and missing rate of each precipitation amount threshold are relatively balanced. After calibration, the mean daily precipitation forecasts in June and November in 2015 are closer to the observed values, the mean absolute error is smaller than the raw forecasts and the area bias of each precipitation amount threshold becomes less.
For the FMM calibration, the calibration coefficients were calculated separately for six sub-regions in China. However, a fixed length of the training period, 20days was chosen for the whole six sub-regions. In fact, the optimal length of the training period needs to be tuned for each sub-region in China, which will be one of our tasks in the near future.
Acknowledgement
This work is supported by the National Natural Science Foundation of China (Grant No. 41575104) and NJCAR key project (Grant No. NJCAR2016ZD04).
References
- Du J, Kang ZM (2014) A Survey on forecasts’ view about uncertainty in weather forecasts. Adv Meteor Sci Technol 4(1): 58-67.
- Li L, Li YL, Tian H, Cui B (2011) Study of bias-correction in T213 global ensemble forecast. Me-teor Mon 37(1): 31-38.
- Zhi XF, Ji XD, Zhang J, Zhang L, Bai YQ, et al. (2013) Multi-model ensemble forecasts of surface air temperature and precipitation using TIGGE Datasets. Trans Atmos Sci 36(3): 257-266.
- Brown JD, Seo DJ, Du J (2012) Verification of precipitation forecasts from NCEP’s Short-Range Ensemble Forecast (SREF) system with reference to ensemble streamflow prediction using lumped hydrologic models. J Hydrometeorol 13(3): 808-836.
- Demargne J, Wu LM, Regonda SK, Brown JD, Lee H, et al. (2015) The science of NOAA’s opera-tional hydrologic ensemble forecast service. Bull Amer Meteor Soc 95(1): 79-98.
- Ebert EE (2001) Ability of a poor man’s ensemble to predict the probability and distribution of precipitation. Mon Wea Rev 129: 2461- 2479.
- Fang XQ, Kuo YH (2013) Improving ensemble-based quantitative precipitation forecasts for to-pography-enhanced typhoon heavy rainfall over Taiwan with a modified probability-matching technique. Mon Wea Rev 141(11): 3908-3932.
- Zhu YJ, Luo Y (2015) Precipitation calibration based on the frequencymatching method. Wea Forecasting 30(5): 1109-1124.
- Li J, Du J (2015) Applications of “Frequency-Matching” method to ensemble precipitation fore-casts. Meteor Mon 41(6): 674-684.
- Cheng X, Chen WD, Zhi XF, Wang SS (2018) Statistical downscaling precipitation forecast for hydropower industry and its calibration using frequency matching method. Proceedings of 2018 3rd International Conference on Computational Modeling, Simulation and Applied Mathematics.
- Yuan HL, Gao XG, Mullen SL, Soroosh S, Du J, et al. (2007) Calibration of probabilistic quantitative precipitation forecasts with an artificial neural network. Wea Forecasting 22(6): 1287-1303.
- Hamill TM, Engle E, Myrick D, Peroutka M, Finan C, et al. (2017) The US national blend of models for statistical postprocessing of probability of precipitation and deterministic precipitation amount. Mon Wea Rev 145(9): 3441-3463.
- Zhi XF, Wang SS, Zhou HM, Zhu SP, Zhao H (2016) Statistical downscaling of precipitation forecasting using categorized rainfall regression. Trans Atmos Sci 39(3): 329-338.
© 2019 Xie Fei Zhi. This is an open access article distributed under the terms of the Creative Commons Attribution License , which permits unrestricted use, distribution, and build upon your work non-commercially.
Editor In Chief


.jpg)


Signup for Newsletter

Quick Links
 Editorial Board Registrations
 Submit your Article
 Refer a Friend
 Advertise With Us
Our Recent Edition

.jpg)


Top Editors


.jpg)


.bmp)
.jpg)
.png)
.jpg)


.jpg)


.png)

.png)


.png)


Financial Support

Sponsors

Latest e-Books

Latest Video

 a Creative Commons Attribution 4.0 International License. Based on a work at www.crimsonpublishers.com.
Best viewed in
a Creative Commons Attribution 4.0 International License. Based on a work at www.crimsonpublishers.com.
Best viewed in