
- About Us
- Information
-

The Author ensures that the research has been conducted responsibly and ethically with adherence to all relevant regulations. read more..
- For Authors
- For Reviewer
- Manuscript Guidelines
- Membership
- Publication Ethics
-
- Journals
- Reprints
- e-Books
- Videos
- Policies
- Contact Us
 COVID-19
- Submissions


Full Text
Environmental Analysis & Ecology Studies
Modeling and Using the Phase Diagram Method for Analyzing Active Acoustic Monitoring Data from Oil Wells
Olga Hachay1*, Veniamin Dryagin2 and Oleg Khachay3
1 Ural Branch of RAS, Institute of Geophysics, Russia
2 LLC Scientific and Production Company Intensonik, Russia
3 Ural Federal University, Russia
*Corresponding author: Hachay OA, Institute of Geophysics, Russia
Submission: October 12, 2018; Published: November 08, 2018

ISSN 2578-0336 Volume4 Issue3
Abstract
A method for mapping and monitoring a heterogeneous complex two-phase medium is proposed, which can be used to control the production of viscous oil in mine conditions and light oil in sub horizontal wells. The requirements of an effective economic performance and the most complete extraction of hydrocarbons in the fields dictate the need to create new geotechnologies for the development of oil and gas fields based on fundamental advances in geophysics and geomechanics. A new 2D modeling algorithm has been developed for diffraction of sound on elastic and porous moisturesaturated inclusions of a hierarchical structure located in the Jth layer of an N-layer elastic medium. The method of phase diagrams was used to estimate the response of the fluid-saturated array to the external active influence, the changes in the state of the array associated with its structural rearrangements. These results are the basis for building new mapping systems and monitoring geological systems. This is especially in demand for the mapping of oil and gas fields and the forecast of their effective useful effect.
Keywords: Hierarchical environment; Elastic; Porous; Two phase; Acoustic field; Iterative 2D modeling algorithm; Method of mapping and monitoring
Introduction
At the Institute of Geophysics, UB RAS, a method of active seism acoustic monitoring of an oil reservoir is being developed and improved [1,2]. This method is used to assess the oil saturation of the reservoir and its ability to produce oil recovery.
An empirical fact has been established about the effect of vibration exposure on the acceleration of oil recovery processes. The following model can be a physical explanation for this: the active medium has its high energy and often a non-equilibrium structural state. Therefore, a synchronizing or synergistic effect on meso processes in areas of maximum instability, reduced strength and high fatigue of the medium at the meso level should be expected from the acting signal. At these levels, the impact energy can accumulate in the meso structures and cause mechanical effects, initiating mechanical movements and fragmentation of the medium.
In the case of an oil reservoir that is in the process of mining, a significant part of the internal energy is generated by a high pressure of the displacing fluid, which is the source of mechanical destruction of the reservoir and is the target of the impact on the reservoir. An even more substantial part of the internal energy of the medium is contained in the form of the potential deformation energy of the collector blocks and surrounding rocks caused by the imbalance of the geomechanical system due to oil production, which leads to a slow inelastic deformation of the medium, aimed at a transition to a new equilibrium state. This process is mainly of a shear nature and is accompanied by an increase in the level of seism acoustic emission and the appearance of “dominant frequencies” of secondary radiation in oil-producing formations, which means that part of the mechanical energy of the relaxation motion of the medium is released as endogenous radiation and indicates the activation of cracking [3].
Currently, there are many publications in the domestic and foreign literature devoted to the physical and mathematical model of the process of seism acoustic radiation before and after the vibration on the reservoir at a fixed frequency. In one way or another, they are used for theoretical substantiation of seism acoustic monitoring of the state of the reservoir before and after the seismic impact on it. For example, it is important to consider models of effective mechanisms for dissipating the internal energy of a deposit and the structural energy of a medium in the process of its transition into the kinetic energy of movement of blocks and the displacement of oil in the form of self-oscillations, resonances, destruction of overstressed and experiencing fatigue phenomena of the elements of the medium.
It is known that in a perfectly elastic medium, i.e. in the absence of boundaries with discontinuities at them displacements or stresses, energy cannot accumulate in time and remain after switching off the source, therefore a continuous medium cannot correspond to the observed phenomena of formation and relaxation of seismic emission with the presence of natural frequencies of the medium. In block structures, as shown by academician MA Sadovskiy, as well as in a hierarchically block environment, the formation of secondary radiations of seismic waves with dominant “eigenfrequencies” is possible, and after prolonged exposure to such a medium, interblock contact zones are weakened and dynamic fragmentation is enhanced.
Consider the following experimentally observed fact-enhanced oil recovery under the influence of dynamic restructuring of a block of energy-rich oil deposits. During long-term operation of the field, the skeletal base of the oil reservoir gradually collapses, which leads to a significant increase in internal stresses and a weakening of the bonds between the components of the reservoir and individual blocks. Moreover, even a small impulse can lead to restructuring of the reservoir, increase the mobility of oil and increase its share in the well fluid [4]. Experimental and theoretical studies of the mechanisms of vibration stimulation of oil recovery from watered fields using vibration effects lead to the conclusion that resonant oscillations develop in fractured block formations. These vibrations, caused by weak, but long-lasting and frequencystable effects, create conditions for the generation of ultrasonic waves in the formations, which are capable of destroying thickened oil films in reservoir fractures.
Measurement of high-frequency seism acoustic fields in wells near stress concentration areas in rock massifs, as well as in fractured porous fluid-saturated layers at low-frequency vibrations, indicates the occurrence of ultrasonic vibrations of hundreds and thousands of hertz. In crystalline arrays, the existence of these fields is associated with the process of the formation of new cracks, in fluid-saturated media, along with elastic ones, hydrodynamic causes can arise. For fractured porous reservoirs that are in operation using the method of high-pressure oil displacement with water, the possibility of intensifying ultrasonic vibrations can be of great technological importance. Even a very weak ultrasound can destroy for a long time the action of viscous oil films formed in the cracks between the blocks, which can cause a decrease in reservoir permeability and decrease in oil recovery [5].
To describe these effects, it is necessary to consider the wave process in a hierarchically block medium and theoretically simulate the mechanism of the appearance of self-oscillations under the action of relaxation shear stresses [6].
Algorithm for modeling the propagation of a longitudinal wave in a medium with hierarchical inclusions
The idea outlined in [7] for solving a direct problem for a twodimensional case of propagation of a longitudinal wave through a local elastic heterogeneity with a hierarchical structure located in the J-th layer of the N-layer medium will be extended to the case when porous appears on the L-th hierarchical level fluid saturated inclusion.
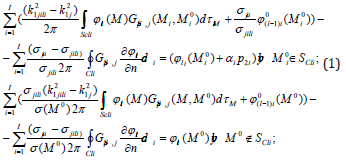
where GSp,i (M,M0 ) is the source function of the seismic field, it coincides with the function of the expression [6]. k21 jil =ω2(σ jil /λ jil ) - wave number for propagation in an elastic medium of a longitudinal wave. In the above expression, the index ji denotes the belonging of the properties inside the heterogeneity, ja - outside the heterogeneity, l=1 ... L-1 is the number of the hierarchical level, ul = gradϕl , ϕl0 is the potential of the normal seismic field in the layered medium in the absence of the previous rank heterogeneity, if l = 2 ... L,ϕl0 =ϕl−l ,if l = 1, 0 0 ϕl0 =ϕl0 , which coincides with the corresponding expression from Equation 1.
If, on going to the next hierarchical level, the axis of twodimensionality does not change, but only the geometries of sections of nested structures change, then, similarly to [7], an iterative process of modeling a seismic field can be written (the case of a longitudinal wave only). The iteration process refers to the modeling of the displacement vector during the transition from the previous hierarchical level to the next level. Within each hierarchical level, the integral-differential equation and the integral-differential representation are calculated using the algorithms [1]. If at a certain hierarchical level the structure of local heterogeneity splits into several heterogeneities, then the double and contour integrals in expressions (1) are taken over all heterogeneities. If l=L, then the heterogeneities of the previous hierarchical level are porous fluidrich heterogeneity. In this case, system (1), taking into account [8], is rewritten as (2):
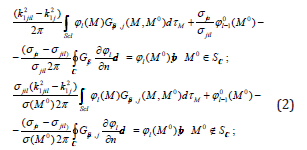
where 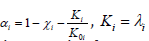 is a module of all-round compression,χi
is porosity,K0i
is the true compressibility modulus of the i-th
phase structure, pore hydrostatic pressure p2i, i=1,...I is the number
of fluid-saturated structures. If l=L+1 and at the next level, the
heterogeneity is again elastic, then for further continuation of the
iterative process we can again use expressions [1].
is a module of all-round compression,χi
is porosity,K0i
is the true compressibility modulus of the i-th
phase structure, pore hydrostatic pressure p2i, i=1,...I is the number
of fluid-saturated structures. If l=L+1 and at the next level, the
heterogeneity is again elastic, then for further continuation of the
iterative process we can again use expressions [1].
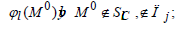
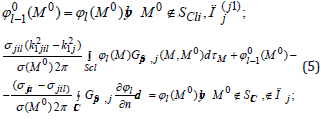
However, very often a fluid saturated reservoir contains either elastic or plastic interlayers. Moreover, if the fluid is water, then most often it are elastic interlayers, if it is oil, then the layers are saturated with oil under the influence of acoustic or mechanical effect and they show plastic properties. Therefore, when simulating the propagation of a longitudinal wave with l=L, the layer j should be divided into several sub layers: j(1) is upper and porous with hierarchical fluid-saturated regions, j(2) its medium is elastic with plastic regions that may not coincide with upper regions of j(1) , the third j(3) is again porous with fluid-saturated regions, which can also be shifted horizontally from the first and second regions. Thus, to the system of equations 2 it is necessary to add a system that takes into account the propagation of a sound wave through the sub layers with plastic features [9] equation (3-5):
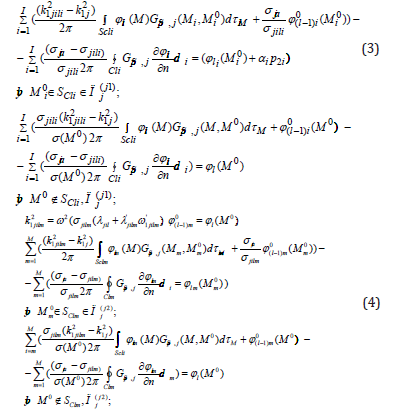
If the fluid-saturated regions remain the same, as for j(1). we return to equation (3). Then go to the expression (5) and calculate
on condition
Thus, the use of integral-differential equations to simulate the propagation of a wave field in a complex two-phase medium allows us to construct and adjust the algorithm according to the required complexity of the problem.
Oil reservoir as a dynamic system
On the other hand, the oil reservoir, under periodic vibration exposure, is an open dynamic system. A dynamic system is an object or a process for which the concept of a state is defined as a set of values of certain quantities at a given time, and an operator is defined that determines the evolution of the initial state over time [10]. In the future, we will use information from the theory of dynamical systems from the monograph [10]. If to describe the behavior of a system, it is enough to know its state in a finite number of points in time, then such a system is called a system with discrete time. Let a set of numbers x = {x1, x2,.. xN} at some point in time describes the state of a dynamic system and different states correspond to different sets {x1, x2, .. xN}. Define an evolutionary operator specifying the rate of change of each state:
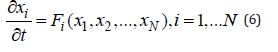
x is the point of the Euclidean space ΡN, which is called the phase space, x is the phase point. A system of the form (6), in which the right-hand part does not depend on time, is called autonomous. When studying a dynamic system associated with a change in the state of the oil reservoir due to vibration, equations (6) will contain the right-hand side, depending on time, and our system will not be described by a model of an autonomous dynamic system. If the system of equations is supplemented with the initial conditions x(0)=x0, we obtain the initial problem (Cauchy problem) for equations (6). Its solution {x(t), t>0}, considered as a set of points in the phase space ΡN, forms a phase trajectory, the vector function F(x) defines a vector velocity field. Phase trajectories and the vector velocity field give a visual representation of the nature of the system behavior over time. A set of phase trajectories corresponding to different initial conditions form a phase portrait of a dynamic system.
Dynamic systems are divided into conservative and dissipative systems. For the former, the total energy of the system is conserved; for the latter, energy losses are possible. In the application to our problem in studying the state of the array, which is in the process of working out, the model of inhomogeneous and non-stationary dissipative systems is the closest. However, in the array there may be such local areas, which will be described by a conservative dynamic model, i.e. energy balance model.
Analysis of the phase portrait of the dynamic system allows us to conclude about the characteristics of the system during the period of its observation. So, in conservative systems there are no attracting sets. An attractor is a subset of the phase space ΡN. over which time trajectories tend to begin, starting in some of its surroundings. If in a conservative system there is a periodic motion, then there are infinitely many such motions and they are determined by the value of energy under initial conditions. In dissipative systems there can exist attracting sets. Stationary undamped oscillations for dissipative dynamic systems are not typical. However, in nonlinear systems, there is the possibility of the existence of a periodic asymptotically stable motion, the mathematical image of which is the limit cycle, depicted in phase space as a closed line, to which trajectories from a certain neighborhood of this line tighten over time.
According to the shape of the phase portrait, one can judge the characteristic behavior of the system, and the “smooth” deformations of the phase space do not lead to qualitative changes in the dynamics of the system. This property is called topological equivalence of phase portraits. It allows analyzing the behavior of various dynamic systems from a single point of view: on its basis, the set of considered dynamic systems can be divided into classes within which the systems demonstrate qualitatively similar behavior. From a mathematical point of view, the “smooth deformation” of a phase portrait is a one-to-one and mutually continuous transformation of phase coordinates, as a result of which new singular points cannot appear, and on the other hand, special points cannot disappear.
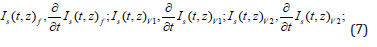
Let us consider the algorithm for constructing a phase portrait or diagram based on seismic acoustic monitoring data. As a result of well monitoring, we have three sets of seism acoustic radiation intensity data: I( t , z )f background,I( t , z )V I after the first excitation and I( t , z )V 2 after the second excitation. At a fixed z, these three functions are observed over a time interval of 14seconds with a sampling frequency of 44100 Hz with a step along the well 0.5m. The entire interval is divided into 14 sub-intervals with a duration of 1 second. Within each second, the observed values are averaged I( t , z )f,I( t , z )V I,I( t , z )V 2 at intervals of 0-0.1 seconds, 0.1-0.2 seconds ... 0.9-1 sec. Thus, we get a new database of averaged data Is( t , z )f,Is( t , z )V I,Is( t , z )V 2for which we build phase diagrams on the planes:
Then we find
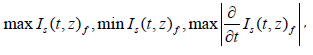
similarly for functions Is( t , z )V I,Is( t , z )V 2 . After that, we calculate the areas of three figures (rectangles, including phase portraits of three sets of functions (7)), for example:
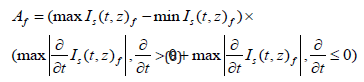
The value equation 8 for each time interval equal to 1 second,
we denote: Af,AV I,AV 2 respectively. Next, we build phase
diagrams on the planes: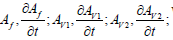 which
will be further analyzed to describe the condition of the nearwellbore
oil-bearing formation. This algorithm is implemented in
Microsoft Excell Visual Basic language in the form of a Macro that
allows you to quickly average the data with an arbitrary frequency
and calculate the described values.
which
will be further analyzed to describe the condition of the nearwellbore
oil-bearing formation. This algorithm is implemented in
Microsoft Excell Visual Basic language in the form of a Macro that
allows you to quickly average the data with an arbitrary frequency
and calculate the described values.
From the results of processing by the described field data algorithm, it follows that background phase diagrams before excitations differ greatly in their morphology, attracting point and area under the phase trajectory for each observation point along the well, indicating a sharp heterogeneity of the state of the nearwellbore environment. The phase diagrams before and after the first and second impacts at the same point along the well differ among themselves according to the same criteria, reflecting the fact that the near-wellbore array changes its state during vibro influence.
If the phase diagram after the first impact becomes larger in
area or its center shifts towards larger values of  , this
means that the intensity of seism-acoustic radiation has increased,
indicating that cracks and pores are closed and the influence of the
liquid phase is reduced. If the phase diagram after the first impact
becomes smaller in area, and if its center shifts towards decreasing
, this means that the intensity of seism-acoustic
radiation has decreased, indicating a greater influx of liquid phase
and an increase in its mobility during this time interval and this
point of observation. A similar analysis is made regarding the phase
diagram after the second excitation. Let us analyze the results of
processing by the method of phase diagrams of active acoustic
monitoring data in the well of the Tevlinsk-Russkinsky field in the
interval 2626m-2631m (Figure 1-11).
, this
means that the intensity of seism-acoustic radiation has increased,
indicating that cracks and pores are closed and the influence of the
liquid phase is reduced. If the phase diagram after the first impact
becomes smaller in area, and if its center shifts towards decreasing
, this means that the intensity of seism-acoustic
radiation has decreased, indicating a greater influx of liquid phase
and an increase in its mobility during this time interval and this
point of observation. A similar analysis is made regarding the phase
diagram after the second excitation. Let us analyze the results of
processing by the method of phase diagrams of active acoustic
monitoring data in the well of the Tevlinsk-Russkinsky field in the
interval 2626m-2631m (Figure 1-11).
Figure 1:

Figure 2:

Figure 3:

Figure 4:

Figure 5:

Figure 6:

Figure 7:

Figure 8:

Figure 9:

Figure 10:

Figure 11:

Figure 1 Phase diagrams from acoustic data of borehole data for three monitoring cycles: before acoustic impact f11, f12; after the first cycle of exposure: v11, v12; after the second cycle of exposure: v21, v22.
According to the analysis, we can identify several intervals in the well, where the effects do not significantly affect the state of the array (Figure 1, 9-11). The greatest impact affects the interval of 29.5 (Figure 8). It is possible to trace how the influence of acoustic effects decays at intervals of 2226m-2227m: (Figure 1-3), 2227.5- 2228.5m: (Figure 4-6), 2229-2231m: (Figure 7-11). Thus, according to the results of processing, the most productive intervals along the well can be identified: 26m, 27.5m, 29m, 29.5m.
The well was drilled into the BS10/2-BS10/3 reservoir of the Tevlinsk-Russkinsky field which is a terrigenous-type reservoir in the form of slightly clay and sandstone with an average porosity of 17-21%. The permeability of the reservoir is not uniform and averages 3-9mD with the inclusion of interlayers with permeability of about 50-60mD. According to the final logging results, the layer is represented as saturated with oil.
According to the logging of seism acoustic emission, a difference was noted in the saturation of the formation in the well section. The positive dynamics of SAE [1,11] after acoustic exposure is associated with the reaction of the reservoir area saturated with oil, and negative with water. Only one interval of the 2625-2630 meter formation gave a positive dynamics of the induced acoustic emission and can be considered as promising for oil recovery.
The results for the two processing methods coincided, but the phase diagram method gave more detailed information about the difference in possible oil recovery within the reservoir area, which is more consistent with geological information. However, if the oil also has anomalous viscosity, to select the frequency filling of the acoustic impact on the reservoir area filled with this oil, it is necessary to use the results of modeling in hierarchical environments using algorithms (3-5).
Conclusion
Currently, using the data of seism acoustic monitoring of a large number of wells in the Western Siberia field, the oil interval of which is located in the same geological suite and at a relatively same depth, oil saturation criteria [10] and oil mobility are developed using the proposed algorithm to generate a training sampling and subsequent use of the pattern recognition method for solving practical issues. The work was carried out under the Basic Research Program of the Department of Earth Sciences RAS-1 “Fundamental problems of geology, sedimentology, geochemistry of oil and gas, development of new technologies for forecasting, prospecting, exploration and development of traditional and unconventional hydrocarbon deposits. Forecast of the development of the resource base of the oil and gas and petrochemical complexes of the oil and gas complexes of Russia until 2030. and for the future until 2050”.
References
- Dryagin V, Igolkina G, Ivanov D (2009) Experience of studying the informative characteristics of induced acoustic emission in oil-saturated strata of terrigenous type. Geodynamics Deep structure Thermal field of the Earth. Interpretation of geophysical fields. Fifth scientific readings of Yu P Bulashevich Conference proceedings. IGF UB RAS, Ekaterinburg, Russia, pp.168-174.
- Dryagin V (2018) The use of influenced acoustic emission collectors for the detection and extraction of hydrocarbons. Georesource 20(3): 134- 140.
- Lavrov A, Shkuratnik V (2005) Acoustic emission during deformation and destruction of rocks. Acoustic Journal 51: 6-18.
- Mitrofanov V, Dzyubenko A, Nechaev N, Dryagin V (1998) Results of field tests of acoustic impact on the bottom hole formation zone. Geology geophysics and development of oil fields. p. 10.
- Alekseev A, Tsetsokho V, Belonosov A, Tale V (2001) Physical and technical problems of the development of mineral resources. pp. 3-12.
- Hachay O, Khachay O (2008) Simulation of seismic and electromagnetic fields in hierarchically heterogeneous media. Geophysical studies of the Urals and adjacent regions. Materials of International conference. IGF UB RAS, Yekaterinburg, Russia, pp. 295-299.
- Hachay O, Khachay A (2013) Modeling of electromagnetic and seismic fields in hierarchically heterogeneous media. Bulletin of SURSU, Computational Mathematics and Computer Science Series 2(2): 48-55.
- Frenkel Y (1944) To the theory of seismic and seism electric phenomena in wet soil. Proceedings of the Academy of Sciences of the USSR. a series of geographical and geophysical 8(4): 133-150.
- Hachay O, Khachai A (2016) Simulation of seismic field propagation in a layered-block elastic medium with hierarchical plastic inclusions. Mining Information-analytical bulletin 4: 318-326.
- Chulichkov A (2003) Mathematical models of nonlinear dynamics. Phizmatlit.
- Oparin V, Simonov B, Yushkin V, Vostrikov V, Pogarsky Yu, et al. (2010) Geomechanical and technical bases of enhanced oil recovery in vibration wave technologies. Science, Novosibirsk, Russia.
© 2018 Olga Hachay. This is an open access article distributed under the terms of the Creative Commons Attribution License , which permits unrestricted use, distribution, and build upon your work non-commercially.
Editor In Chief


.jpg)


Signup for Newsletter

Quick Links
 Editorial Board Registrations
 Submit your Article
 Refer a Friend
 Advertise With Us
Our Recent Edition

.jpg)


Top Editors


.jpg)


.bmp)
.jpg)
.png)
.jpg)


.jpg)


.png)

.png)


.png)


Financial Support

Sponsors

Latest e-Books

Latest Video

 a Creative Commons Attribution 4.0 International License. Based on a work at www.crimsonpublishers.com.
Best viewed in
a Creative Commons Attribution 4.0 International License. Based on a work at www.crimsonpublishers.com.
Best viewed in