
- About Us
- Information
-

The Author ensures that the research has been conducted responsibly and ethically with adherence to all relevant regulations. read more..
- For Authors
- For Reviewer
- Manuscript Guidelines
- Membership
- Publication Ethics
-
- Journals
- Reprints
- e-Books
- Videos
- Policies
- Contact Us
 COVID-19
- Submissions


Full Text
Environmental Analysis & Ecology Studies
Study of Water and Salt Exchange using Combined Simulation and Analytical Tools
Muchebve Edwin* and Nakamura Yoshiyuki
Graduate School of Urban Innovation, Yokohama National University, Japan
*Corresponding author: Muchebve Edwin, Graduate School of Urban Innovation, Yokohama National University, Japan
Submission: December 18, 2017;Published: August 10, 2018

ISSN 2578-0336 Volume3 Issue5
Introduction
It is practically impossible to conduct long-term water quality measurements across an entire lake. To overcome this problem, simulation results can be used as measurements in the analysis of cross sectional salt flux. A three-dimensional hydrodynamic model is applied to study the dynamics of water and salt exchange through cross-sections. The model is validated with field data. Then the model results are used to study the characteristics of water and salt exchange [1]. The goals of this approach are to examine the mechanisms that drive water and salt transport in estuaries and coastal lakes, and how they are influenced by different forcing conditions. The approach can also be applied in the study of pollutants.
The Validation of the Model
The agreement between simulation results and observed data for the total, tidal and sub tidal components of the surface elevation and current velocity at several stations in the computational domain is important. The model needs to be checked if it has successfully reproduced response of surface elevation and current velocity to river discharge, atmospheric pressure and wind. The same validation process is done for the simulation results of salinity and pollutants.
The mean error (ME), mean absolute error (MAE), and predictive skill (Skill) are used as quantitative assessments for the comparison simulation results - observed data. They are defined as [1]:
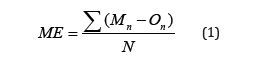


Where Mn and On are the nth simulation result and observation, respectively, O is the time mean data, and N is the number of observations. On average positive ME indicates over-prediction and negative ME indicates under prediction. The average deviation between simulation results and observed data is indicated by the magnitude of MAE. Skill indicates the ability for the model to reproduce observed data; a skill of one indicates perfect agreement and zero indicates complete disagreement.
Salt Fluxes across a Vertical Cross Section
The equations originally derived by Hansen [2] are used in conducting the analysis of the processes governing the flux of materials along the longitudinal direction of an estuary or coastal lake [3]. Many studies have applied these equations to analyze of the longitudinal flux of materials [4-7].
The final simplified equation of the water flux (Fw) through the section, assuming turbulent fluctuations and tidal fluctuations are uncorrelated is
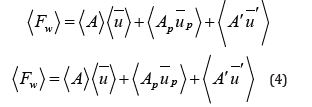
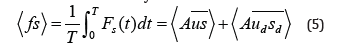
where is longitudinal velocity, subscript p denotes the major harmonic variations, and primes denote turbulent fluctuations, the angle brackets denote mean values over the tidal period T and the bar denotes mean value of any variable over the cross section. The term A u is the seaward water flux through the mean crosssectional area (A) carried by the mean flow, usually referred to as the non-tidal drift. The flux Ap up is due to tides and is generally landward. The turbulent flux, A′u′ , represent water transport by motions of less than semidiurnal period, is generally negligible. Instantaneous salt fluxes are a sum of cross sectional average and deviations there from. Assuming non-stationary conditions, the mean salt flux over a tidal cycle is
The cross-sectional salinity averages, and deviations from the mean salt flux can also be considered as the sum of a tidal mean, a tidal fluctuation and a turbulent fluctuation. The velocity, salinity, mean deviation product of velocity and salinity, and crosssectional area vary with time. The shear effect can be separated into lateral and vertical components [4,5]. Further, considering three dimensional profiles the deviations of velocity and salinity from the cross-sectional mean, can be separated into variations in the vertical transverse directions. Thus, the mean salt flux over a tidal cycle through a cross section is given by:
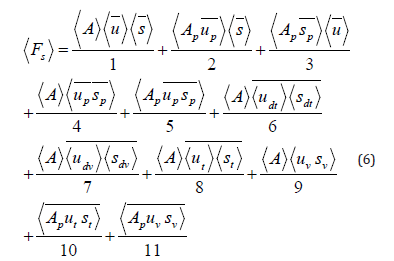
where the bars indicate cross-sectional averages and angle brackets indicate a time-average. Terms 1-5 quantify advection, and terms 6-11 quantify the shear effect associated with the variation in salinity and velocity within the cross section. Terms 1 and 2 provide the flux on the “non-tidal” drift. Terms 2-5 account for what is called “tidal pumping”, associated fluxes due to phase differences in the cross sectional averages of the tidal variations in velocity, salinity and cross sectional area [4]. Physical processes related with the terms of equation (6) are listed in Table 1.
Table 1:Physical processes related with the terms of equation (6).

Discussion and Conclusion
A model study of the dynamics of water and salt exchange through cross-sections in Lakes Shinji and Nakaumi, Japan was done using the approach discussed here [7]. The hydrodynamic model in the STOC-LT (Ise Bay Simulator) was used [8]. The salinity simulation results were not quite in agreement with observed results (skill level of about 80%), however,
Interesting observations were made on the results of the mean salt flux over a tidal cycle through a cross section. Analysis over 1.5- year period reveals that the terms of equation (6) are not balanced. The results indicate an overall increase of salinity within Lake Shinji. The results also indicated that an increase in stratification produces an outflow of salt associated with the vertical tidal oscillatory shear. Huge river discharge suppresses vertical mean shear, and gravitational circulation diminishes, resulting in salt outflow. Tidal influence of salt flux is greater in winter. Gravitational circulation strengthens on moderate river flows or westerly winds.
Future efforts to understand the biogeochemical response to physical processes in estuaries and coastal lakes, requires the use of coupled hydrodynamic, water quality and ecological model combined with optimization model. And the analysis of water, salt and pollutants fluxes across a vertical cross section can done with the help of the analytical approach discussed here.
References
- Kim CK, Park K (2012) A modeling study of water and salt exchange for a micro-tidal, stratified northern Gulf of Mexico estuary. Journal of Marine Systems 96(97): 103-115.
- Hansen DV (1965) Currents and mixing in the Columbia River estuary. Ocean Science and Ocean Engineering 2: 943-955.
- Hughes FW (1968) Salt flux and mixing processes in the Columbia River estuary during high discharge. (MS thesis). University of Washington, UAS.
- Dyer KR (1974) The salt balance in stratified estuaries. Estuarine and Coastal Marine Science 2(3): 273-281.
- Dyer KR, Gong WK, Ong JE (1992) The cross-sectional salt balance in a tropical estuary during a lunar tide and a discharge event. Estuarine, Coastal and Shelf Science 34(6): 579-591.
- Hughes FW, Rattray M (1980) Salt flux and mixing in the Columbia River Estuary. Estuarine and Coastal Marine Science 10(5): 479-493.
- Muchebve E (2017) Numerical simulation and analysis of mechanisms and fluid dynamics driving mixing and salt flux in coupled brackish lakes. Yokohama National University, Japan.
- PARI. Ise Bay simulator
© 2018 Muchebve Edwin. This is an open access article distributed under the terms of the Creative Commons Attribution License , which permits unrestricted use, distribution, and build upon your work non-commercially.
Editor In Chief


.jpg)


Signup for Newsletter

Quick Links
 Editorial Board Registrations
 Submit your Article
 Refer a Friend
 Advertise With Us
Our Recent Edition

.jpg)


Top Editors


.jpg)


.bmp)
.jpg)
.png)
.jpg)


.jpg)


.png)

.png)


.png)


Financial Support

Sponsors

Latest e-Books

Latest Video

 a Creative Commons Attribution 4.0 International License. Based on a work at www.crimsonpublishers.com.
Best viewed in
a Creative Commons Attribution 4.0 International License. Based on a work at www.crimsonpublishers.com.
Best viewed in