- Submissions

Full Text
Environmental Analysis & Ecology Studies
Spatial and Temporal Use of an Urban Landscape by White-Tailed Deer
Erin McCance* and Rick K Baydack
University of Manitoba, Canada
*Corresponding author: Erin McCance, University of Manitoba, 104 Cloverwood Road, R3Y 1R6, Winnipeg, Manitoba, Canada
Submission: April 26, 2018;Published: June 13, 2018

ISSN 2578-0336 Volume3 Issue1
Abstract
White-tailed deer (WTD) (Odocoileus virginianus) home range size, habitat use, and seasonal movement patterns were assessed within the Greater Winnipeg Area (GWA) in comparison to the rural area of Riding Mountain National Park (RMNP), Manitoba. Urban deer monthly home range sizes were significantly smaller (GWA average Minimum Convex Polygon [MCP] area=2.21km²) than deer residing within RMNP (RMNP average MCP area = 6.65km²). Urban female deer home range size was substantially smaller than that of urban males. A majority of the GWA deer did not migrate between summer and winter core use areas, appearing to display a strong fidelity to an annual home range. Urban deer shortest and slowest movements occurred in city neighborhoods, likely in association with the supply of artificial food resources. Management of urban deer habitats may be most effective with efforts tailored to specific localized areas to mitigate human-deer conflicts.
Keywords:Collaring; Global Positioning System [GPS]; Human-deer conflict; Movement patters; Spatial; Temporal; Urban deer; White-tailed deer
Introduction
Understanding white-tailed deer (WTD) (Odocoileus virginianus) spatial and temporal land use in urban environments is an essential component in the creation of effective urban deer management programs. Over the past several decades, many urban centers in North America have experienced a growth in WTD populations [1-3]. As a result, increasingly, urban land use planning, within the complex mosaic of metropolitan space, needs to consider urban deer ecology and behavior. Urban environments are uniquely comprised of natural- and human- supplemented food sources, fragmented landscapes, remnant habitat patches, and a multifaceted network of roadways [4], where both the benefits and liabilities of an urban deer population are realized. Within these spaces, both natural and human-induced factors influence WTD survival and movement. Understanding WTD movement patterns and habitat use is important for managers [5] and land planners attempting to reduce human-deer conflicts [6]. WTD seasonal movement patterns, migrations, and home range sizes vary considerably over their geographic range and landscape location. This variation is often based on deer response to changes in the availability and quality of resources [7,8]. Seasonal migrations of WTD between their summer and winter ranges typically occur in northern latitudes [9]; however, differences in movement patterns may be observed between deer residing in rural versus urban landscapes [6,10]. Typically, migration by WTD from a summer to winter range is influenced by changing temperatures, snow depth, photoperiod variations, and changes in the quality and availability of vegetation [11-13]. Urban environments, however, provide unique foraging opportunities [14] including exotic plantings and artificial food sources that may offer deer atypical resources during winter months. Given the availability of these naturally uncommon resources, urban deer movement patterns and home range sizes may differ from those of deer residing in rural areas. Considering these factors, empirical information on deer home range size, habitat use, and seasonal movement patterns, specifically within urban environments, is an important consideration for management.
Urban ecosystems
Complicating matters, urban ecosystem function is highly modified compared to WTDs natural ecosystem counterparts [15]. City environments often have their own microclimates, deriving energy from sources other than the sun, with variations in temperature, relative humidity, precipitation, and wind [15]. These urban landscapes often have modified water infiltration and overloaded biochemical cycles inundated with pesticides, fertilizers, and the burning of fossil fuels [15]. Further, the overall loss of larger intact contiguous blocks of undeveloped habitat impacts natural processes such as maintaining air quality, soil production, nutrient cycling, moderating climate, fresh water production, mitigating pollution, the degradation of wastes, and the control of disease and waste [15]. However, despite their modified function, urban environments do offer high quality habitats for WTD, including adequate shelter, available water, and both natural and human-supplemented food sources [4,16]. Urban environments provide a distinct mosaic of stream corridors, forest fragments in parks and residential neighborhoods, patchy green spaces, and open recreational areas which, combined with hunting restrictions, firearm discharge laws, and minimal predation [1,4,16,17], provide ideal conditions for WTD. These factors, coupled with high birth rates and the highly resilient and adjustable nature of WTD [16,18], have resulted in growing WTD populations in many urban centers throughout North America [2,19].
These growing urban WTD densities cause a myriad of ecological and social concerns. WTD cause residential and public property damage by eating natural and managed plantings [20-23], and pose a significant human safety concern as they are host to a number of transmittable diseases, most notably Lyme disease [24]. Urban WTD are also involved in an increasing and alarming number of motor vehicle collisions [1]. Large congregations of urban WTD may reside within small remnant habitat patches nestled within residential spaces, resulting in the localized reduction of plant species richness and structure, and thereby causing adverse effects on a variety of other local wildlife species [25,26]. These larger congregations of deer do not remain within these small remnant habitat patches but rather venture out of protective cover in search of additional resources. In light of this, multiple human-wildlife and inevitably, human-human conflicts, often accompany high deer densities in residential communities.
Management of urban deer
Management of WTD in urban landscapes has become a common concern in many urban areas [1,18]. A variety of nonlethal and lethal strategies may be used to manage urban deer populations and to reduce human-deer conflict in metropolitan areas. Each management option is associated with various ecological, biological, or social benefits and liabilities. Site specific population reduction is a potential management option; however, studies have that shown many urbanites oppose lethal methods of management [24,27,28]. In many cases, effective management is often site-specific and likely to include a combination of management options. In order to develop acceptable and effective management strategies, knowledge of deer seasonal movement patterns and their distribution in urban areas is necessary [10].
Urban deer movement studies
Several studies have investigated deer movement in a wide variety of landscapes. Deer movement has been investigated in forests and wildlife refuges [28,29], agricultural [8,9], and exurban areas Storm et al. [30]. However, WTD movement within urban landscapes requires further investigation. Few studies, specifically using Global Positioning Systems (GPS) - backed data, have examined WTD movements in urban landscapes. Grund et al. [5] studied seasonal movements and habitat use of female WTD in an urban park, and similarly Ekstein et al. [31] assessed WTD movement in an urban forest, while Jones et al. [25] investigated the survival and movement patterns of post-translocated urban WTD. Each of these studies used radio-collars. Further to these studies, Bender et al [10] assessed the annual and seasonal movement of black-tailed deer in Vancouver, British Columbia, using relocated (1-2 times/week) radio-collared animals; and Piccolo et al. 2002 used radio collars on WTD in urban habitats around Chicago, Illinois. An opportunity exists to build on these research findings, so as to enhance the existing knowledge base with respect to the spatial and temporal movement patterns and habitat use of urban GPS collared WTD.
Objectives
Many urban centers throughout North America are experiencing growing urban WTD populations. Several of these urban areas have developed management strategies to address this issue; however, the basic movement patterns, corridor use, and habitat selection of urban WTD populations are often poorly understood Grund et al. [5]. Currently, little is known about WTD daily and seasonal movement patterns in the urban areas of Canada. The objective of this research was to examine the temporal and spatial land use of WTD in urban spaces. This research explored: 1) sex-specific seasonal home range sizes; 2) habitat use of WTD; and 3) seasonal movement patterns of WTD residing within a Canadian urban center, Winnipeg, Manitoba, Canada. For comparative analysis, WTD were also GPS collared in RMNP, a 2,969km² federally protected area located 306 km northwest of Winnipeg. This research also investigated 4) the similarities and differences of the spatial and temporal movement patterns of urban versus rural WTD.
Study Area
Greater winnipeg area
Winnipeg is the largest and capital city in the province of Manitoba. Winnipeg (49°53’58’N, 97°08’21’W) is the 7th largest municipality in Canada, covering 464.01 km², with a human population of 730, 018 people (Canada 2011 Census). The GWA (elevation 238 meters) is located where historically a tall grass prairie ecosystem thrived Scott et al. 2007. The Greater Winnipeg Area (GWA) has a humid continental climate (Köppen Climate Classification) with an average of 318 sunny days/year and is characterized by four distinct seasons. Summers are typically humid and hot with temperatures rising to 35 degrees Celsius. There is a wide variation between summer and winter temperatures, as the typical winter in Winnipeg is long and cold with temperatures reaching minus 35 degrees Celsius. Snow conditions often cover the landscape for up to six months of the year.
WTD are non-native species and are relative newcomers to Manitoba with their arrival occurring sometime in the late 1800s Goulden et al. [32]. WTD expanded northward, extending their range from Minnesota into Manitoba, following the pattern of human settlement and taking advantage of edge habitat created by human land use practices such as pioneer agriculture and logging [32]. Prior to human settlement, mule deer (now virtually nonexistent) were the only deer found in any significant numbers in Manitoba. The earliest accounts of WTD in Manitoba occurred in 1881; however, it was not until 1900 that WTD were regularly seen by settlers. WTD within the GWA take advantage of agricultural crops as a food source while also feeding on native plant species such as aspen (Populus tremuloides), clover (Trifolium spp., Melilotus sp.), oak (Quercus macrocarpa), Saskatoon (Amelanchier anlnifolia), snowberry (Symphoricarpos occidentalis), among others Howe et al. [33]. The GWA deer herd also takes advantage of an adequate supply of supplemental food sources Bulloch et al. [34].
Until the middle of the 1970s, GWA urban WTD numbers were less than 200 animals. Bylaws restricting the use of firearms within city limits (passed in the early 1980s) has likely contributed to the growth of the urban WTD population. An aerial survey conducted by Manitoba Conservation and Water Stewardship (MCWS) in 2006 identified 1788 WTD within the City of Winnipeg and its near surround area Hagglund et al. [35]. Deer density over the entirety of the GWA is only 2.2 deer/km²; however, MCWS conducted a spatial analysis of landscapes in neighborhoods supporting WTD and determined the deer density within these GWA neighborhoods to be 55 deer/km², based on the 2006 aerial survey results (MCWS, unpublished data).
Riding mountain national park
RMNP, (approximately 50°51’50’N, 100°02’10’W) is a primarily forested protected area located in the southwestern portion of Manitoba Smith et al. [36]. The mean annual temperature is 1.2 degrees Celsius with an average growing season of 173 days. The mean annual precipitation is approximately 500mm, of which roughly one quarter falls as snow [36]. RMNP is located in the transitional zone between the prairie and the northern Boreal Plains eco-regions Rowe et al. [37]. The landscape surrounding RMNP is managed for agriculture, primarily annual cereal and oilseed crops, as well as perennial forage crops and pasture for beef cattle Brook et al. [38]. The eastern boundary of the park is characterized by the Manitoba Escarpment at 475m which gradually declines in elevation toward the western limit of the Park. The Park is located at the overlap of three land ecosystems; the Grasslands, and two sub-components of the Great Boreal Forest Biome, the Aspen-Oak and Mixed wood ecosystems (Ecological Stratification Working Group 1995). There are multiple small rivers and creeks draining in various directions from the region. The composition of vegetation consists of trembling aspen, balsam poplar, and jack pine stands, with occasional mixes of white spruce [37]. RMNP is characterized by a diversity of mammal species including black bear (Ursus americana), coyote (Canis latrans), elk (Cervus elaphus), grey wolf (Canis lupus), lynx (Lynx canadienses), moose (Alces alces), red fox (Vulpes vulpes), and WTD. Human harvest of wildlife within the park is restricted. Winter ungulate classified count surveys conducted in 2013 indicate approximately 2,100 WTD, 1,600 elk, and 2,700 moose within the Park (Data source: Parks Canada, RMNP). As noted, RMNP represents a multi predatorprey ecosystem. Systematic annual winter wolf surveys indicate a stable wolf population with a 2011-2012 population estimate of 113 individuals (Data source: Parks Canada, RMNP). A population estimate for black bears in 2007 indicated approximately 900 black bears within RMNP Parks Canada [39].
Methods
Global positioning systems data
WTD were captured and collared during winter months (December–March) within the GWA between 2010 and 2012. Deer were collared with Lotek Wild Cell M GSM collars (equipped with Lotek timed blast off units) using a modified robust version of Clover Box Traps Clover et al. [40]. Deer were captured on private residential properties and public lands located in the heart of urban space within the GWA. Clover box traps were set up and baited using sweet feed (an intended horse feed primarily made up of barley, oats, and corn covered with molasses) 48hours prior to capture to acclimatize the deer to move in and out of the un-set trap. Urban Clover Box Traps were set at dusk and checked each evening at 9pm, between 11pm-12am, and again at 6am. Given the relatively high degree of human activity and disturbance inherent in the urban environment within which these trapping activities occurred, the traps were not set during daylight hours, so as to reduce, as much as possible, additional stress on captured deer. Given the nature of the research, the time required to work with each animal, and risks associated with each methodological approach, deer captured in Clover Box Traps were physically restrained, versus chemically immobilized, blindfolded, ear tagged, collared, and released. Latitude and longitude locational fixes were programmed to be taken every two hours. Once the animal was collared, data were sent to the researcher by cellular phone text message every ten hours, providing near “real-time” fix data. Further to the GPS locational data, the researcher located deer at a minimum of every 3 months, although often more frequently, using a hand-held receiver and yagi antennae. Deer locations were derived by using 3-5 bearings and used to validate the accuracy of the GPS locational data, with the GSM collar, accuracy is within 1meter.
All GPS locational data were screened for large positional outliers. The data were visually investigated and the low confidence outliers, any GPS location points with a Dilution of Precision (DOP) >25 were removed. WTD were also captured during winter months (December-March) within RMNP and collared with either ATS or Lotek GPS store on board pods, Lotek GPS 3300 store on board collars, or ATS G2110E iridium collars. Deer were collared either by ground using a modified robust version of Clover Box Traps baited with sweet feed, or by air, using aerial net-gunning techniques Kock et al. [41]. Deer collared by ground or by aerial net gunning were all physically restrained, blindfolded, ear tagged, collared, and in the case of RMNP, blood was taken for Bovine Tuberculosis (TB) testing purposes prior to the animal’s release. GPS collared WTD were initially captured in the western portion of RMNP, an area characterized by largely un-fragmented blocks of habitat with little to no human development or activity.
Similar to the GWA data, all RMNP GPS locational data were screened for large positional outliers and data investigated with low confidence outliers removed, any GPS location points with a DOP> 25 were removed. Given a variety of collar types were used within RMNP, the accuracy of location varied slightly based on collar type; however, accuracy is within 1-3 meters. All animal capture and handling associated with this research was conducted in accordance with the capture and handling guidelines of the Canadian Council on Animal Care et al. 2003, University of Manitoba Utilization Protocol number F09-034 Appendix A, a Parks Canada Agency Research and Collections Permit #2012-6993, and a MCWS Wildlife Scientific Permit #WB11818.
Sex-specific seasonal home ranges
All ‘cleaned’ GPS data were mapped using ArcGIS 9.3. Data fields were created to categorize the data by animal ID, sex, month, and season. Overall monthly and seasonal home range sizes, using 100% Minimum Convex Polygons (MCPs), were determined for each animal using Hawth’s tools Beyer et al. [42] in ArcGIS 9.3. For the purposes of this research, seasons were defined around lifecycle stages (i.e. rutting, parturition) being:
a) Spring: April, May, June
b) Summer: July, August, September
) Fall: October, November, December
d) Winter: January, February, March
This analysis used the MCP technique, given that it is relatively robust with low sample sizes Harris et al. [43]. Each MCP was carefully examined and any irregular outliers were investigated for each animal Burt et al. [44]. Welch’s two-sample t-tests (P< 0.05) assuming unequal variances Moore et al. 2000, were used to compare home range sizes between sexes and between GWA and RMNP collared deer. To identify the areas used most intensively by each deer, adaptive kernels were also calculated for each animal at both the 90% occupancy and the 70% occupancy for annual home range. Using the Home Range Extension Function in ArcGIS 9.3 Rodgers et al. [45], high density core use areas were determined. A smoothing factor (h), which defines the spread of probability kernel generated for each observation point, of 0.4, was used Hazell et al. [46]. The adaptive kernel, in comparison to the fixed kernel method, was selected for use in this research given this method varies the smoothing parameter so that areas with a low concentration of points have higher (h) values than areas with a high concentration of points, and are therefore, smoothed more Worton et al. [47].
In order to assess whether deer migrated between summer and winter core use areas, the summer and winter 90% Adaptive Kernels for each collared deer, located in both GWA and RMNP, were analyzed to assess whether there was any degree of overlap between these two core use areas. For the purposes of this research, migration was defined, similar to Brickman et al. [6], as the seasonal movement between non-over-lapping winter and summer core use areas. If any overlap between the seasonal core use areas was detected, migration was assumed not to have occurred. In cases where the two core use areas did not overlap, the linear distance from the center of the summer kernel to the center of the winter kernel was measured to assess the distance of the migration between a summer and winter core use areas. Results of this analysis were summarized.
Habitat use
Figure 1: The Greater Winnipeg Area Land Cover Classification.

Figure 2: Riding Mountain National Park Land Cover Classification.
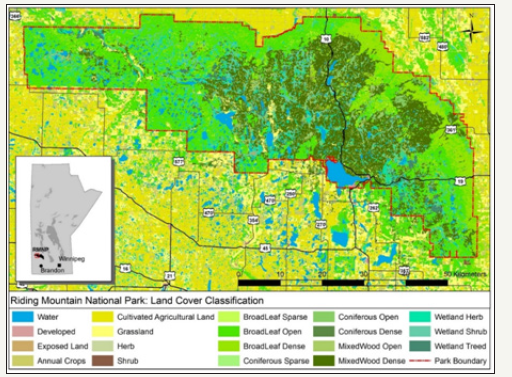
Animal locational data were spatially joined to the Canadian Land Cover Classification (LCC) layer. The LCC is a national land cover spatial database developed by the Canadian Federal government with data integrated from the major federal departments involved in land management in Canada, such as Agriculture and Agri- Foods Canada (AAFC), Canadian Forestry Service (CFS), and the Canadian Center for Remote Sensing (CCRS). The data resolution of the LCC is based on Land sat imagery and depending on the cell the imagery covers, is generally 1meter. The data used for the LCC is classified and confirmed using parallel datasets and ground trothing to improve accuracy. (Figures 1&2) illustrate the LCC for the GWA and RMNP respectively. Using the LCC, the GPS locational fixes occurring in each LCC type was determined for both GWA and RMNP collared deer. The total number of locational fixes recorded in each land cover type was summarized. The sum of the area (square km) was calculated in relation to the LCC for the overall seasonal MCP and the seasonal 90% and 70% Adaptive Kernels. Within ArcGIS 9.3, paths were created using a script called ‘Create attributed lines from points’ Buja et al. [48], connecting each successive location. The total length of each path was measured using Hawth’s Tools and the time between locations was measured using the Visual Basic Script Fix gap Davis et al. [49]. Data were filtered to remove locational data that did not comply with the 2hr fix gap (data that had missed acquiring one or more consecutive satellite fixes). Only the data that had a 2hr fix gap was used for this portion of the analysis. Using the distance and time between fixes, movement rates were calculated for each location. The length (m) and rate of each movement (m/hr) were calculated based on the time/distance of each fix to the preceding fix. The length of all GWA and RMNP collared deer movement measured between each 2hr fix were totalled in relation to the LCC and averaged. The same process was repeated with the rate of movement within each 2hr fix (totalled and then averaged) to determine the rates of movement in various habitat types for both the GWA collared animals and the RMNP collared animals. Movement rates were compared with the habitat associated with each cover type. Note: while there exists an inherent bias in this analysis, given only the animal location at the time of the fix can be determined with any certainty, over the broader scale of the data set, the results do provide valuable insights into deer use and movement rates through various land cover types.
Seasonal movement patterns
The length and rate of movement were calculated for the GWA and RMNP by season and by month. Using the length (m) of movement from each collared animal measured between each 2hr fix gap, all of the 2hr fix gap lengths by season and month were averaged to provide the average length of movement by season and by month for the GWA and RMNP animals. Similarly, the average speed of movement (m/hr) was determined by season and by month. Results were summarized and t-tests were used to determine whether there was a statistically significant difference between the length and speed of the movement of collared GWA deer in comparison to the collared RMNP deer. Further, in an effort to assess factors that may influence seasonal movement patterns of urban deer, the daily temperature and precipitation values were acquired from Environment Canada’s National Climate Data and Information Archive (2010-2013) for both the GWA and Dauphin, Manitoba (located just north of RMNP). The daily MCP dimensions of each collared GWA deer (area, perimeter, length of MCP diameter) were calculated. The average of all collared animals’ length of their daily MCP diameter (the average of the GWA collared deer and separately the average of the RMNP collared deer) were plotted against the average daily temperature and/or average daily precipitation and Spearman Rank Correlation analysis of the data were conducted using “R” Version 3.0.1 to assess whether the temperature and/or precipitation influenced urban deer movement.
Results
Global positioning systems data
A total of 18 WTD (n=11 females, n=7 males) were captured and collared in the GWA from March 2010 until January 2013. Of the 18 deer trapped and collared in the GWA, 8 of them were captured and collared during March. Consistent with the research conducted by Kilpatrick et al. [50], in our geographic location, we found early March, when snow was still on the ground but deer were foodstressed, to be the most effective time to capture. Of the total 18 deer collared, 2 of the deer died within the first month of being collared. Of these 2 deaths, one was a doe, subsequently necropsied and determined to have died due to suffocation from nose bots (Cephenemyia) while the other was a doe that died after being involved in a deer-vehicle collision (DVC). Therefore, the GWA data used for this analysis is based on a total of 16 collared deer. Of the remaining 16 collared deer, 10 of the collars remained on the deer for the duration of the collar lifecycle until the time of collar blast off, an additional 4 of the deer died due to DVC (5 of 18 total, 28%), 1 of the bucks (approximate age 7.5 yrs) died of unknown causes (determined by necropsy), and 1 doe went off line 11 months after she was collared, with her fate remaining unknown. The successful fix rate of the GWA collars was approximately 90% with very little screening required overall. The ‘cleaned’ GWA collared deer data acquired represents 62,630 deer locations. A total of 29 WTD (n=20 females, n=9 males) were captured during winter months (December-March) within RMNP and collared from January 2011 until March 2013 with either ATS or Lotek GPS store on board pods (n=8), Lotek GPS 3300 store on board collars (n=12), or ATS G2110E iridium collars (n=9). A total of 8 deer were captured by ground, while the remaining 21 deer were captured using aerial net gunning techniques.
Of the 29 collared deer, only 20 collared deer were used for this analysis given 1 collar slipped off a buck shortly after collaring; 1 doe died by wolf predation within days of collaring; 2 collars were damaged; 1 doe was euthanized shortly after collaring as blood testing indicated suspicious for TB; and 4 collars went missing. Of those 20 collars used for this analysis, 6 mortalities were identified as either suspected wolf kills (n=5) or causes remaining unknown (n=1); 5 of the collared deer were removed from the landscape as a part of the local TB program; and 9 of the collars were dropped and recovered. Any GPS fix locations with a DOP of >25 were removed from the dataset. The ‘cleaned’ RMNP collared deer data acquired represents 62,170 deer locations.
Sex-specific seasonal home ranges
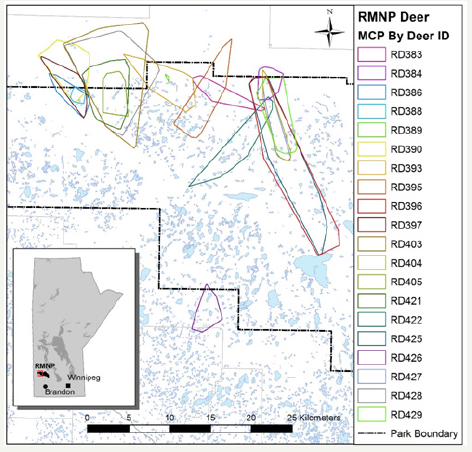
The overall MCP for collared GWA and collar RMNP deer are found in (Figures 3&4) respectively
Figure 3: GWA Collared Deer MCP.
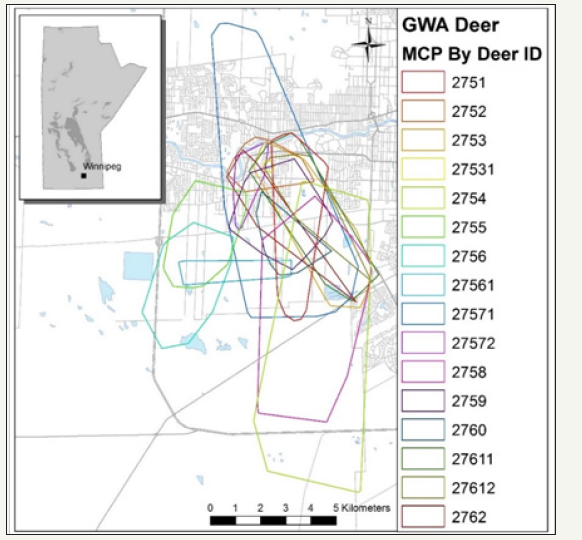
Figure 4: RMNP Collared Deer MCP.
Monthly home range size
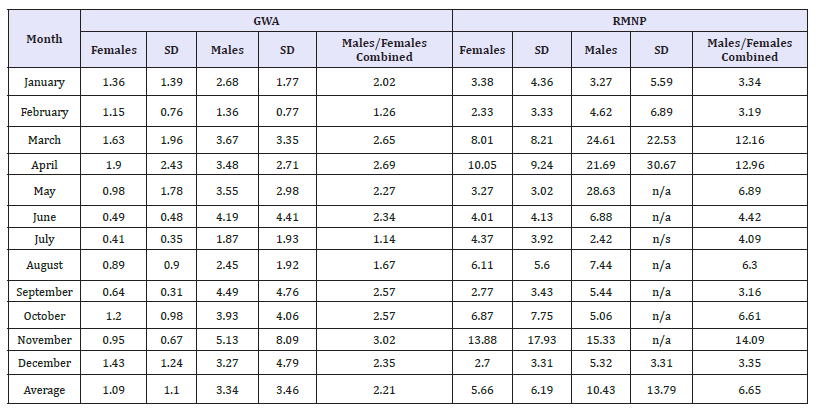
The ‘cleaned’ GWA and RMNP collared deer data were used to determine the average area (square km) of their monthly MCP represented in (Table 1). T-tests confirmed a statistically significant difference between the home range sizes of GWA collared female deer (smaller) and male deer (P value = 0.00625< 0.05). T-tests also confirmed the difference of the average home range size of GWA collared deer (smaller) to be statistically significant compared to the average home range size of RMNP collared deer (P value = 0.028 < 0.05). The t-tests failed to show a statistically significant difference, however, between male and female collared deer home range size in RMNP (P value = 0.187>0.05).
Table 1:GWA & RMNP GPS collared deer monthly MCPs (Average of Area km2).
Seasonal home range sizes
Table 2:GWA & RMNP GPS Collared Deer Sex-Specific Seasonal MCPs, 90%, & 70% Adaptive Kernels (Average of Area km2).

The cleaned GWA and RMNP collared deer data were used to determine the average area (square km) of the seasonal MCP and the 90% and 70% adaptive kernels, represented in (Table 2).
Seasonal migration
Summer and winter 90% Adaptive Kernels were used to assess the degree of overlap, if any, between the summer and winter core use areas for each deer in the GWA and RMNP. Of the 16 collared GWA deer only four (25%) did not have overlapping core use areas during summer and winter. Of the four that showed a migration between summer and winter core use areas, three of the four were bucks, one of which, showed a migration between summer and winter ranges during both years the buck was collared. Of the 20 GPS collared deer in RMNP, 17 of these deer were collared over the full duration of a full summer and winter season. Out of these 17 deer, only 4 (23.6%) did not have any overlap between their summer and winter 90% kernels of these 4, 3 were does and 1 was a buck. (Table 3) provides the linear distance between the two centers of the animal’s 90% summer and winter kernels.
Table 3:GWA & RMNP GPS Collared Deer Migration between Summer and Winter 90% Adaptive Kernels (Average of Area km2).

Habitat Use
GWA and RMNP collared movement in relation to lcc
Table 4:Sum of Area of the RMNP Collared Deer Seasonal MCP, 90%, and 70% Adaptive Kernels (Sum of Area km2) in relation to LCC.
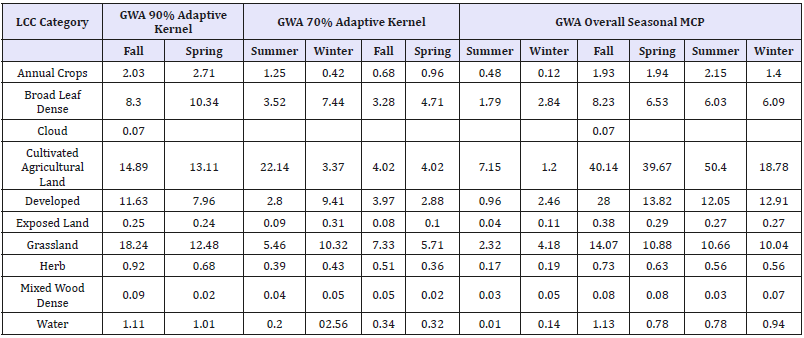
Table 5:Sum of Area of the RMNP Collared Deer Seasonal MCP, 90%, and 70% Adaptive Kernels (Sum of Area km2) in relation to LCC.

Using the seasonal MCP, the 90% and 70% Adaptive Kernels for both the GWA and RMNP, the sum of the total area of each (square km) found within each LCC cover type were calculated and summarized in Table 4 and Table 5 respectively.
Using the seasonal MCP, the 90% and 70% Adaptive Kernels for both the GWA and RMNP, the sum of the total area of each (square km) found within each LCC cover type were calculated and summarized in (Table 4) and (Table 5) respectively.
Length and rate of movement in various habitat types
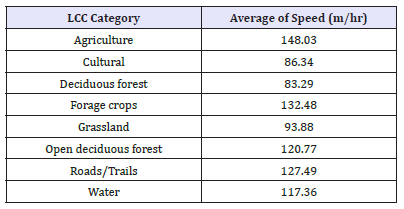
Using the cleaned data representing 2hr fix-gap data (GWA n = 58,893 locational data points; RMNP n = 52,978 locational data points), the total sum of the length of movement between each 2 hr fix gap for the GWA GPS collared deer within each LCC cover type was averaged to provide the average length (m) of movement in each LCC category, represented in (Table 6). The same methods were repeated for the speed of movement (m/hr) between each 2 hr fix gap, totalled and then averaged in relation to the LCC cover types, represented in (Table 7).
Table 6:GWA GPS Collared WTD Length of Movement between each 2 hr fix in Relation to LCC.
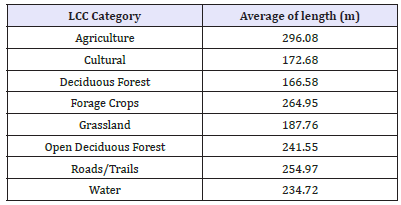
Table 7:GWA GPS Collared WTD Rate of Movement (m/hr) between each 2 hr fix in Relation to LCC.
Seasonal Movement Patterns
Length and rate of movement by season
Figure 5: Average Length of Movement of GWA and RMNP Deer by Season.

Figure 6: Average Speed of Movement of GWA and RMNP Deer by Season.
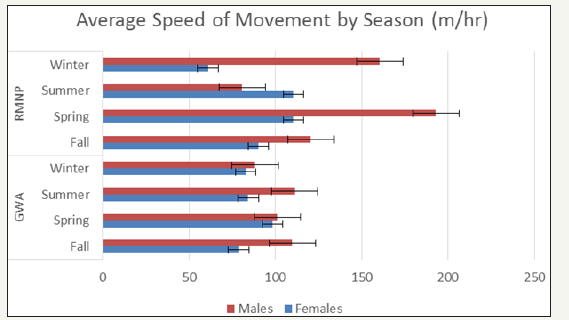
The total length of each collared animal’s movement between each 2hr fix gap was totalled and the average length of movement (m) by season for both the GWA and RMNP deer were summarized in (Figure 5). Similarly, the average speed of movement (m/hr) by season was calculated and summarized in (Figure 6).
Length and rate of movement by month
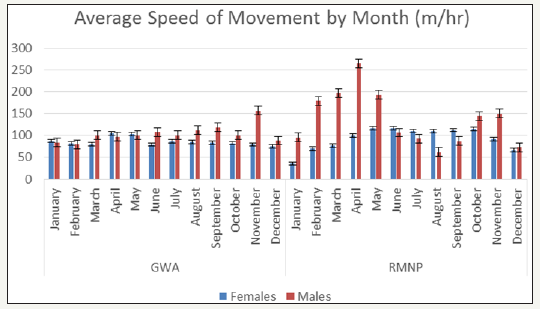
The total length of each collared animal’s movement between each 2hr fix gap was totalled and the average length of movement (m) by month for both the GWA and RMNP deer were summarized in Figure 1.3. Similarly, the average speed of movement (m/hr) by month was calculated and summarized in Figure 4. T-tests failed to show a statistically significant difference between the average length and average speed of movement within the GWA compared to RMNP for both season (length P value = 0.584; rate P value = 0.583) and month (length P value = 0.469; rate P value = 0.468).
Temperature and precipitation influence on seasonal movement
The average length of the daily MCP diameter of collared GWA deer (Figure 7) and collared RMNP deer (Figure 8) were plotted in relation to average daily temperature (degrees Celsius) and average daily precipitation (cm). Spearman rank correlation analysis was performed to determine whether temperature and/ or precipitation influenced deer movement. The spearman rank correlation analysis indicated no influence of temperature and/ or precipitation on the GWA collared deer movement. Spearman correlation of +1 or −1 indicates one variable (in this case, daily movement in relation to temperature or precipitation) is a function of the other. The spearman rho (ϒS) values for both temperature and precipitation effect on GWA collared deer movement were extremely small and close to zero, with P values greater than 0.05, indicating that neither were significant and that neither temperature nor precipitation explained changes in collared urban deer movement. The ϒSvalues for the influence of temperature and precipitation on RMNP collared deer movement were both small; however, the P values for temperature and precipitation were less than 0.05 indicating a significance relationship (RMNP movement in relation to PPT Pvalue=0.000188; RMNP movement in relation to temperature Pvalue= 2.2e-16). Therefore, unlike the GWA collared deer, both precipitation and temperature influence RMNP collared deer movement.
Figure 7: Average Length of Movement of GWA and RMNP Deer by Month..
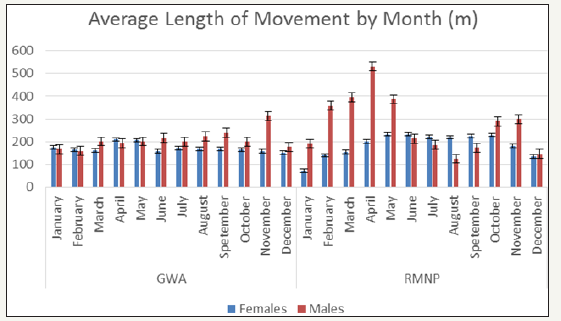
Figure 8: Average Speed of Movement of GWA and RMNP Deer by Month.
Discussion
These results suggest deer have adapted to urban environments by decreasing their home range size and by using habitats unique to urban landscapes i.e. residential neighborhoods, similar to findings of Grund et al. [5] who identified urban WTD home range size to be statistically smaller than those commonly reported for rural WTD. Consistent with their findings, this research shows overall substantially smaller home range sizes of collared deer residing in the GWA in comparison to collared deer residing in RMNP. In the case of this research, the combined average of total monthly MCP area in the GWA = 2.21 km² was significantly smaller when compared to the combined average of total monthly MCP area in RMNP = 6.65 km². Rhoads et al. [30] note urban-suburban WTD annual home range sizes tend to be < 50% smaller than those of WTD residing in rural-agricultural areas. Etter et al. [6] and Grund et al. [5] found urban WTD home ranges to be smaller in summer than winter. This data suggests only marginal differences between summer and winter home range sizes. Within the GWA, males have larger home range sizes than females, with females exhibiting the largest home ranges in March and males exhibiting the largest home range size in November. Seasonally, females have the largest home range size in winter, with their home ranges expanding toward the end of March, likely as their metabolism increases, they progress furthering into pregnancy, and as such are searching for additional resources. Seasonally, males have the largest home range in fall, which is not surprising giving this coincides with the breeding season (Figures 9&10). Results of this research also illustrated that urban deer demonstrate a high degree of fidelity to their home range. Only 25% of the urban deer migrated from a summer to winter home range. Of these migrants, 75% were males. RMNP collared deer that did migrate between summer and winter ranges displayed longer migrations between ranges than displayed by the collared GWA deer. Similar to the work of Grund et al. [5], the urban home range sizes and seasonal shifts were smaller than noted in rural landscapes.
Figure 9: GWA Collar Deer Average Daily MCP Diameter (m) in relation to Local Temperature (degrees Celsius) and Precipitation (cm).

Figure 10: RMNP Collar Deer Average Daily MCP Diameter (meters) in relation to Local Temperature (degrees Celsius) and Precipitation (cm).

Several studies conducted in rural landscapes Nelson et al. [51], Ozoga et al. [12], Nixon et al. [52] have noted that deer avoid high human activity areas, generally selecting secluded areas; however, these results, similar to Grund et al. [5], identified GWA collared deer residing in the heart of residential space. Researcher observation indicates that GWA collared deer spend considerable time in close proximity to, and even direct contact with, their human neighbors [53-65]. The findings reveal urban deer significantly use developed spaces and vacant grasslands found on crown land property strips located behind residential homes in these GWA neighborhoods. Some of the smallest lengths of movement and slowest rates of movement made by urban deer were within the cultural, developed spaces (Tables 5&6). Conversely, the longest and fastest rates of movement made by collared GWA deer were observed on agricultural lands, which within the GWA, are located between developed spaces and tracks of in-tact broadleaf forest habitats. Deer traveling across these open landscapes have no protective cover available. Based on both the empirical movement data and researcher observation, many of these collared urban deer spent a considerable amount of their time on specific residential properties, taking advantage of confirmed artificially supplied food sources. Researcher observations of dogs off leash chasing deer away from artificial food supplies did not deter these deer from returning to the artificial food site multiple times each day [66- 75]. Deer home ranges are small with little seasonal variation or migration within the city likely due to residents providing a yearround artificial food source.
Artificial food source
GWA urban deer displayed little seasonal or monthly variation in the length or rate of their movement, likely due to deer taking advantage of these readily available high protein food sources, as well as many of the other benefits that urban environments provide such as the urban heat effect. Tall buildings and infrastructure within urban environments likely slow wind chill effects and offer the advantage of increased heat from the thermal energy radiation from buildings. Further, urban deer energy demands are also reduced as deer take advantage of the easy travel routes offered by roadways, sidewalks, and trails with compacted snow rather than having to traverse through deep snow. This study did not find that daily changes in temperature and precipitation had a strong influence on urban deer movement in the GWA, unlike the RMNP collared deer where temperature and precipitation did influence deer movement. Given the smaller home range size and the strong fidelity to an annual home range displayed by GWA collared deer, this is not surprising.
Management Implications
Deer spatial and temporal movement patterns and habitat use should be incorporated into urban deer management programs to maximize efficient use of municipal resources and to enhance program success. Results of this research indicate that a majority of urban deer do not make significant shifts in their home range sizes or migrate between summer and winter core use areas. This is likely a result of intentionally supplied artificial food sources that offer deer the advantage high protein food options throughout the year. Therefore, management of human-deer conflicts and humanhuman conflicts are likely localized in specific areas within the city. Given the costs associated with increasing DVCs and other deer conflicts, status quo management is no longer a feasible management option. In the GWA, bylaws prohibiting deer feeding might usefully be adopted and funding allocated to the enforcement of non-compliance. Further follow-up research of GPS backed urban deer movement patterns should be untaken as artificial food sources are diminished. Given the current fidelity of urban deer to a small seasonal range, results of this research suggest that management of these habitats may be more important than previously realized
Conclusion
Today’s wildlife managers are faced with the task of deer management within an urban matrix. WTD have adapted to exploiting suitable habitats and unique resources found within the heart of residential spaces. In these human populated environments, management options become limited. Deer home range sizes are smaller, potentially due to deer travelling shortened distances to find food and cover. These smaller urban deer home range sizes, with little seasonal variation in movement, are entwined within the fabric of residential neighborhoods, making many management options difficult to entertain and limited with respect to their anticipated success. Understanding urban deer movement and habitat use will assist managers and landscape designers in minimizing urban deer conflicts by designing management options tailored to urban deer ecology and behavior. Enhanced knowledge of the seasonal movements and habitat selection of WTD in urban areas will enable managing agencies and community leaders to make sound decisions regarding deer management strategies, land use, and resource protection.
References
- Conover MR, William CP, Kimberly KK, Tami JD, Wendy AS (1995) Review of human injuries, illnesses and economic losses caused by wildlife in the United States. Wildlife Society Bulletin 23(3): 407-414.
- Brown TL, Daniel JD, Shawn JR, Jody WE, T Bruce Lauber (2000) The future of hunting as a mechanism to control white-tailed deer populations. Wildlife Society Bulletin 28(4): 797-807.
- Fulton DC, Kevin Skerl, Erin MS, David WL (2004) Beliefs and attitudes toward lethal management of deer in cuyahoga valley national park. Wildlife Society Bulletin 32(4): 1166-1176
- Adams CE, KJ Lindsey (2010) Urban Wildlife Management, 2nd edn. CRC Press, Boca Raton, London, and New York.
- Grund MD, Jay BM, Ernie PW (2002) Seasonal movements and habitat use of female white-tailed deer associate with an urban park. Journal of Wildlife Management 66(1): 123-130.
- Etter DR, Karmen MH, Van TR, Ludwig DR (2002) Survival and movements of white-tailed deer in suburban chicago, Illinois. Journal of Wildlife Management 66(2): 500-510.
- Marchinton Larry R, Hirth DH (1984) White-Tailed Deer Ecology and Management. Lowell K Halls, Stackpole Books, Harrisburg, PA, USA.
- Brinkman Todd J, Deperno CS, Jenks JA, Haroldson BS, Osborn RG (2005) Movement of female white-tailed deer: effects of climate and intensive row-crop agriculture. Journal of Wildlife Management 69(3): 1099-1111.
- Grovenburg TW, Jenks JA, Klaver RW, Swanson CC, Jacques CN, et al. (2009) Seasonal movements and home ranges of white-tailed deer in north-central south Dakota. Canadian Journal of Zoology 87: 876-885.
- Bender Louis C, Anderson DP, Lewis JC (2004) Annual and seasonal habitat use of columbian black-tailed deer in urban Vancouver, Washington. Urban Ecosystems 7(1): 41-53.
- Rongstad OJ, JR Tester (1969) Movements and habitat use of whitetailed deer in Minnesota. Journal of Wildlife Management 33(2): 366-379.
- Ozoga L, J Verme, CS Bienz (1982) Parturition behavior and territoriality in white-tailed deer: impact on neonatal mortality. Journal of Wildlife Management 46(1): 1-11.
- Drolet CA (1976) Distribution and movements of white-tailed deer in southern New Brunswick in relation to environmental factors. Canadian Field Naturalists 90: 123-136.
- Kilpatrick Howard J, Spohr SM (2000) Spatial and temporal use of a suburban landscape by female white-tailed deer. Wildlife Society Bulletin 28(4): 1023-1029.
- Hilty Jodi A, Lidicker WZ, Merenlender AM (2006) Corridor ecology: the science and practice of linking landscapes for biodiversity conservation. Island Press, Washington and London.
- Adams Clark E, Lindsey KJ, Sara J Ash (2006) Urban wildlife management. CRC Press Boca Raton, London, and New York.
- Messmer Terry A, Louis Cornicelli, Decker DJ, Hewitt DG (1997) Stakeholder acceptance of urban deer management techniques. Wildlife Society Bulletin 25(2): 360-366.
- DeNicola Anthony J, VerCauteren KC, Curtis PD, Hygnstrom SE (2000) Managing White-Tailed Deer in Suburban Environments: A Technical Guide. Cornell Cooperative Extension Publications, USA.
- Doerr Michelle L, Jay B McAninch, Ernie P Wiggers (2001) Comparison of 4 methods to reduce white-tailed deer abundance in an urban community. Wildlife Society Bulletin 29(4): 1105-1113.
- Decker Daniel J, Thomas A Gavin (1987) Public Attitudes toward a Suburban Deer Herd. Wildlife Society Bulletin 15(2): 173-180.
- Conover Michael R (1997) Wildlife management by metropolitan residents in the United States: practices, perceptions, costs, and values. Wildlife Society Bulletin 25(2): 306-311.
- DeNicola Anthony J, Swihart RK (1997) Capture-induced stress in white-tailed deer. Wildlife Society Bulletin 25(2): 500-503.
- VerCauteren Kurt C, John A Shivik, Michael J Lavelle (2005) Efficacy of an animal-activated frightening device on urban elk and mule deer. Wildlife Society Bulletin 33(4): 1282-1287.
- McCullough DR, Jennings KW, Gates NB, Elliot BG, Didonato JE (1997) Overabundant deer populations in California. Wildlife Society Bulletin 25(2): 478-483.
- Jones Jon M, James H Witham (1990) Post-translocation survival and movements of metropolitan white-tailed deer. Wildlife Society Bulletin 18(4): 434-441.
- Deblinger Robert D, Rimmer DW, Vaske JJ, Vecellio GM (1995) Efficiency of controlled, limited hunting at the crane reservation in Ipswich, Massachusetts: in urban deer. A Manageable Resource 1(2): 82-86.
- McCance Erin (2009) Urban Resident Opinions Concerning Urban Deer Management in the Greater Winnipeg Area, Manitoba, Canada. University of Manitoba, Manitoba, Canada.
- Kernohan Brian J, Jenks JA, Naugle DE (1996) Estimating 24-h habitat use patterns of white-tailed deer from diurnal use. Journal of Environmental Management 48: 299-303.
- Van Beest FM, Wal EV, Stronen AV, Paquet PC, Brook RK (2013) Temporal variation in site fidelity: scale-dependent effects of forage abundance and predation risk in a non-migratory large herbivore. Behavioral Ecology 173(2): 409-420.
- Rhoads Craig L, Bowman JL, Brian Eyler (2010) Home range and movement rates of female exurban white-tailed deer. Journal of Wildlife Management 74(5): 987-994.
- Ekstein Jason D, Hyngstrom SE (1997) Gifford point/fontenelle forest urban deer survival and case study. Wildlife Damage Management, Internet Center for Great Plains Wildlife Damage Control Workshop Proceedings, University of Nebraska, USA.
- Goulden Herb (1981) The white-tailed deer in Manitoba. Manitoba Natural Resources Internal Report, Manitoba, Canada.
- Howe N, MW Shoesmith, J Stewart (1974) Rumen contents of whitetailed deer in Manitoba. Environmental Division 74(17): 1-28.
- Bulloch DM (1987) An assessment of effect of urban land development on the Winnipeg deer herd. MNRM Practicum, University of Manitoba, Manitoba, Canada.
- Hagglund Brian (2006) Big game aerial survey report: city of Winnipeg (gha 38) and surrounding area. Manitoba Conservation, Unpublished Internal Report, Manitoba, Canada.
- Smith RE, H Veldhuis, Mills GF, Eilers RG, Fraser WR (1998) Terrestrial Ecozones, Ecoregions, and Ecodistricts of Manitoba, An Ecological Stratification of Manitoba’s Natural Landscapes. Technical Bulletin 1998-9E. Land Resource Unit, Brandon Research Centre, Research Branch, Agriculture and Agri-Food Canada. Winnipeg, Manitoba, Canada.
- Rowe JS (1972) Forest Regions of Canada. Canadian Forest Service, Dept of the Environment, Information Canada. Publication No 1300. Ottawa, Ontario.
- Brook Ryan K (2007) Elk-agriculture conflicts in the greater riding mountain ecosystem: building bridges between the natural and social sciences to promote sustainability. Doctor of Philosophy thesis, University of Manitoba, Manitoba, Canada.
- Parks Canada (2007) Riding mountain national park of Canada and riding mountain park east gate registration complex national historic site of Canada management plan. Parks Canada, Canada.
- Clover MR (1956) Single-gate deer trap. California Fish and Game 42(2): 199-201.
- Kock Michael D, Jessup DA, Clark RK, Franti CE (1987) Effects of capture on biological parameters in free-ranging bighorn sheep (ovis canadensis): evaluation of drop-net, drive-net, chemical immobilization and the net gun. Journal of Wildlife Diseases 22(4): 641-651.
- Beyer HL (2012) Hawth’s Analysis Tools for ArcGIS
- Harris S, Cresswell WJ, Forde PG, Trewhella WJ, Woollard T (1990) Home-range analysis using radio-tracking data-a review of problems and techniques particularly as applied to the study of mammals. Mammal 20: 97-123.
- Burt WH (1943) Territoriality and home range concepts as applied to mammals. Journal of Mammology 24: 346-352.
- Rodgers AR, Carr AP, Beyer HL, Smith L, Kie JG (2007) HRT: Home range tools for ArcGIS. Ontario Ministry of Natural Resources, Centre for Northern Forest Ecosystem Research, Thunder Bay, Ontario, Canada
- Hazell Megan E, Mark E Taylor (2011) Movements of boreal caribou in the James Bay lowlands. Rangifer 19: 63-74.
- Worton BJ (1989) Kernel methods for estimating the utilization distribution in home-range studies. Ecology 70(1): 164-168.
- Buja Ken (2013) ESRI.
- Davis T (2007) Fix gap Program.
- Kilpatrick Howard J, Labonte AM, Barclay JS (2007) Acceptance of deer management strategies by suburban homeowners and bow hunters. Journal of Wildlife Management 71(6): 2095-2101.
- Nelson ME, Mech DL (1981) Deer Social Organization and Wolf Predation in Northeastern Minnesota. Wildlife Monographs 77: 1-10.
- Nixon LP, Hansen PA, Brewer JE, Chelsvig (1991) Ecology of whitetailed deer in an intensively farmed region of Illinois. Wildlife Monographs 118: 1-10.
- Brier P, McCullough DR (1980) Factors influencing white-tailed deer activity patterns and habitat use. Wildlife Monographs 109: 5-51.
- Brook Ryan K (2007) Elk-agriculture conflicts in the greater riding mountain ecosystem: building bridges between the natural and social sciences to promote sustainability. Doctor of Philosophy thesis, University of Manitoba, Manitoba, Canada.
- Canada Census. (2012) Statistics Canada.
- Canadian Parks and Wilderness Society (2004) Riding mountain ecosystem community atlas. Winnipeg, Manitoba, Canada.
- Caslick JW, Decker DJ (1979) Economic feasibility of a deer-proof fence for apple orchards. Wildlife Society Bulletin 7(3): 173-175.
- Doenier PB, DelGiudice GD, MR Riggs (1997) Effects of winter supplemental feeding on browse consumption by white-tailed deer. Wildlife Society Bulletin 25(2): 235-243.
- Ecological Stratification Working Group (1995) A National Ecological Framework for Canada. Agriculture and Agri Food Canada, Research Branch, Centre for Land and Biological Resources Research and Environment Canada, State of the Environment Directorate, Ecozone Analysis Branch, Ottawa/Hull. Report and national map at 1:7500 000 scale.
- Environment Canada (2011) Environment Canada homepage.
- Hernandez Saul, Locke SL, Cook MW, Harveson LA, Donald S, et al. (2006) Effects of spayvac® on urban female white-tailed deer movements. Wildlife Society Bulletin 34(5): 1430-1434.
- Howe N, Shoesmith MW, Stewart J (1974) Rumen contents of whitetailed deer in Manitoba. Research Branch Environmental Division 74(17): 1-28.
- Kilpatrick HJ, Walter WD (1999) A controlled archery deer hunt in a residential community: cost, effectiveness, and deer recovery rates. Wildlife Society Bulletin 27(1): 115-123.
- Lauber T, Bruce, Knuth BA, Tantillo JA, Curtis PD (2007) The role of ethical judgments related to wildlife fertility control. Society & Natural Resources 20(2): 119-133.
- McDonald, John E, Clark DE, Woytek WA (2007) Reduction and maintenance of a white-tailed deer herd in central Massachusetts. Journal of Wildlife Management 71(5): 1585-1593.
- Merrill JA, Cooch EG, Curtis PD (2006) Managing an overabundant deer population by sterilization: effects of immigration, stochasticity and the capture process. Journal of Wildlife Management 70(1): 268-277.
- Moore, David S (2000) The basic practice of statistics. Second edition. WH Freeman and Company, New York, USA.
- Nielsen CK, Gary Anderson, Grund MD (2003) Landscape influences on deer-vehicle accident areas in an urban environment. Journal of Wildlife Management 67(1): 46-51.
- Piccolo BP, Hollis KM, Warner RE, Van Deelen TR, Etter DR, et al. (2000) variation of white-tailed deer home ranges in fragmented urban habitats around Chicago, Illinois. Wildlife Damage Management, USA
- Porter WF, Underwood HB, Woodard JL (2004) Movement behavior, dispersal, and the potential for localized management of deer in a suburban environment. Journal of Wildlife Management 68(2): 247- 256.
- The R Foundation of Statistical Computing
- Rowe JS (1972) Forest Regions of Canada. Canadian Forest Service, Dept. of the Environment, Information Canada, Ontario, Canada
- Swilhart Robert, Peter K, Picone M (1998) Selection of mature growth stages of coniferous browse in temperate forests by white-tailed deer Odocoileus virgianus. American Midland Naturalist 139(2): 269-274.
- Van Beest, Eric Vander Wal FM, Stronen AV, Brook RK (2013) Factors driving variation in movement rate and seasonality of sympatric ungulates. Journal of Mammology 94(2): 691-701.
- Verme Louis J, Duane E Ullrey (1984) Physiology and nutrition. White- Tailed Deer Ecology and Management, Stackpole Books, Harrisburg, PA, USA, pp. 91-118
© 2018 Erin McCance. This is an open access article distributed under the terms of the Creative Commons Attribution License , which permits unrestricted use, distribution, and build upon your work non-commercially.
 a Creative Commons Attribution 4.0 International License. Based on a work at www.crimsonpublishers.com.
Best viewed in


.jpg)


 Editorial Board Registrations
 Submit your Article
 Refer a Friend
 Advertise With Us
.jpg)


.jpg)


.bmp)
.jpg)
.png)
.jpg)


.jpg)


.png)

.png)


.png)


