- Submissions

Full Text
Environmental Analysis & Ecology Studies
Methodology of Land Resource Inventory at 1:10000 Scale for Agricultural Land Use Planning-A Case Study in Eastern Extension of Chhotanagpur Plateau Region
Shreyasi Gupta Choudhury1*, Tapati B1, Das K1, Sahoo AK1, Nayak DC1 and Singh SK2
ICAR-National Bureau of Soil Survey and Land Use Planning, India
ICAR-National Bureau of Soil Survey and Land Utilisation Planning, India
*Corresponding author: Dr. Shreyasi Gupta Choudhury, Scientist, ICAR- National Bureau of Soil Survey and Land Use Planning, DK Block, Sector 2, Salt Lake City, Kolkata-700091, West Bengal, India
Submission: March 09, 2018;Published: April 13, 2018

ISSN 2578-0336 Volume2 Issue1
Abstract
Land resource inventory (LRI) at larger scale (1:10000) is the basic prerequisite to develop agricultural land use planning for upgrading the socioeconomic condition of the farmers. In the present era of climate change and huge demand for food, the agriculture in India is under severe stress, which might be improved through a judicious land resource inventory followed by a robust agricultural land use planning. Moreover, site specific land management options must be framed to provide right technology at right time in right place. Thus, with this aim, a methodology of LRI at 1:10000 scale have been developed using geospatial technique for preparation of landscape ecological map (LEU) as base map. The detailed information generated in GIS environment has been used in the field for detailed ground truthing and land resource inventory for farm planning. The detailed methodology has been presented through a case study considering Rajnagar block of Birbhum distrct, West Bengal for doing LRI at 1:10000 scale.
Keywords: Land resource inventory; Large scale soil survey; Methodology; Soil; Land use; Land form; Landscape ecological unit mapping
Introduction
Land resource inventory (LRI) is the basic prerequisite to optimize robust land use planning at different scales of observation. Previously, in our country, soil resource inventory has been done both at 1:250000 scale for state level and 1:50000 for district level planning. But, to reach and solve the site specific problems of the farmers directly in their farm, more detailed information (1:10000 scale) at block level is required. But, land resource inventory at 1:10000 scale for a vast area is very time consuming, if we follow the earlier methodologies of small scale land resource inventory for doing the same. In the present era of climate change, soil quality deterioration and reduced water availability, the agrarian situation of India (where more than 70% population depends on agriculture) is under severe stress for which the total and partial factor productivity of many crops is declining. Moreover, the growing demand of food and non-food commodities is supposed to increase by 75-100% globally between 2010-2050 [1-3]. It is estimated that rice production has to be increased by 1.1% per annum, for ensuring South Asian food security in next four decades [4,5]. This situation needs an optimal land use planning consisting of right land use and right technology in site specific mode to meet the ever increasing food demand as well as in preserving the quality of land for posterity. Geo-spatial tools in combination with proper field studies can maneuver the job of land resource inventory for land use planning in significantly lesser time as compared to the earlier processes. Information regarding spatial distribution and classification of soils along with pedologic modeling has been considered as important driver in the advancement of our understanding about soil [6].
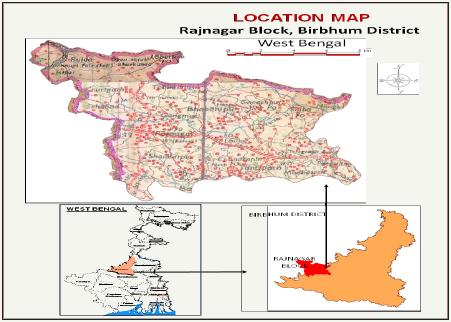
It helps not only in soil mapping, but also, to decide various site specific soil management practices [7]. Spatial patterns of soil properties in a landscape are the results of systematic variations in pedogenic processes and dynamic interactions between natural and environmental factors [8]. The expanding use of soil knowledge to address issues beyond agronomic production, such as land use planning, environmental concerns, food security, energy security, water security, and human health requires new methods for communicating what we know about the soils we map [9]. Thus, with this view, Rajnagar block (an eastern extension of Chhotanagpur plateau), situated in the rainfed zone (AESR 12.3) of Birbhum district of West Bengal (Figure 1), has been taken into consideration for LRI at 1:10000 scale to develop and standardize the methodology for future agricultural land use planning.
Figure 1: Location map of Rajnagar block, Birbhum District, West Bengal.
Materials and Methods
Remote sensing data interpretation
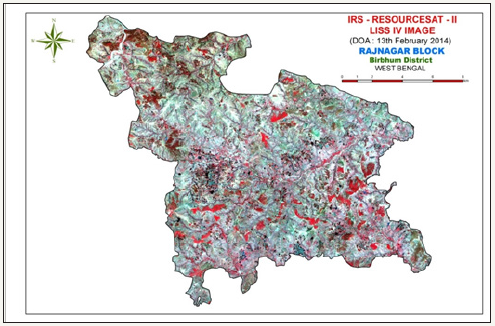
Object based interpretation of satellite data (IRS R2 data of 5.8 meter resolution, (Figure 2) compiling with the data available in the public domain (Bing map) were used for the preparation of Land Use and Land Cover (LULC) maps of the selected block. Both LULC and landform maps are superimposed to develop land ecological unit maps (LEUs), the actual base map for LRI at 1:10000 scale.
Figure 2: IRS-P6 LISS IV satellite data (February, 2014) Rajnagar block.
Digital terrain model
Cartosat-1 stereo pair data of 1M resolution were processed to generate the digital terrain model (DTM) of 10m spatial resolution. Steps including projection setup, sensor data reading, collection of GCPs and tie points, block adjustment were followed using rigorous math model (Toutin’s Model) before developing Digital Surface Model (DSM) in Ortho Engine of Geomatica version 14.0. Further Balancing algorithm and filters were applied to obtain the seamless mosaic DSM height and to convert bare earth model DSM to DTM, respectively. The output was finetuned for smoothing the irregularities. RMSE statistics report was also generated to evaluate the accuracy of DTM output.
Integration of terrain attributes and landform map preparation
Finally the terrain attributes like contours, drainage, slope and hill shade were treated as input layer for landform delineation. The landform classification process was hastened taking into consideration the slope class zone, hill shade, contour and autodrainage pattern along with legacy mapping unit of 1:250000 scale.
Land use and land cover mapping
Land use and land cover (LULC) map was developed using current rabi season data of Cartosat-1 merged LISS-IV (2.5m) as well as high resolution (0.5m) public domain (Bing map) data in the backend. The delineation of subclasses viz. single and double cropped areas within the agriculture zone was done using novel LULC subclass classification. The merged data was segmented into spectrally homogeneous region using multi-resolution segmentation algorithm. The optimum scale parameter for segmentation of the layer was achieved through estimation of scale parameter (ESP) analysis tool. The point of interest lies where the local variance and rate of change are minimum in the graphical output. The data mining technique i.e. feature space optimization was applied to extract the double cropped area based on certain number of layer variables and combination of vegetation indices as obtained through the maximum separation distance.
Landscape ecological unit
The integration of two secondary layers i.e. landform and land use were achieved through the hierarchical object based segmentation algorithm taking into consideration of the area, morphology of the landform units and its relation with the neighbour objects to develop landscape ecological unit (LEU) map. The segmentation was accomplished in three levels:
a) Level-I: First level segmentation was done based on the major landform layer.
b) Level-II: This segmentation was run within each of the first level segment based on fuzzy threshold based slope class. Second level intermediate output gave rise to landform-slope unit.
c) Level-III: The landform-slope segments of second level were further subdivided into landform-slope-land use unit i.e. LEU by incorporating the land use factor. The logical condition used to incorporate the land use factor was that the minimum overlap with the thematic polygon i.e. level-II segment would be more than or equal to 60%. The criteria ensured the continuity of LEU zone vis-à-vis soil boundary by ignoring negligible change in land uses.
Interpretation of LEUs map
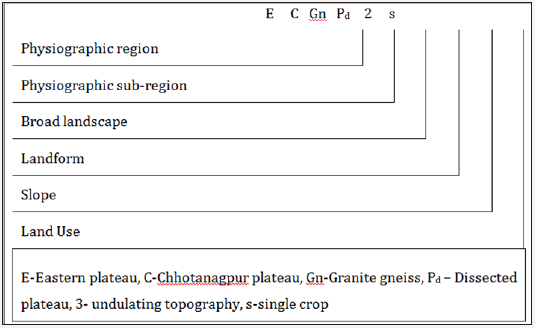
A schema has been developed for the interpretation of landscape ecological units. The interpretative units LEUs were he assemblage of landforms, slope and land uses and these are further linked with physiography and, sub-physiography regions. Physiography and sub-physiography are derived from legacy data of soil resource mapping of the country, completed on 1:250000 scales. The symbols were also specified for each of the item. For 1:10000 mapping, broad landforms were further segmented into landform units, which was further converted into Landscape Ecological Unit by adding the information on slope and land use Figure 3.
Figure 3: Schema for the interpretation of land ecological units.
Ground truth verification
For accuracy measurement of the base map, ground truth verification was done in which all the landform units along with the land use land cover type have been checked and finalized. The area was traversed to identify the different landform, land use and slope variability and checked with the image interpreted units of the base map.
Soil survey and sampling
After ground truth checking and finalization of the maps, certain transects through different catena have been worked out during soil survey in November December, 2015 and sample strips of 2×1km2 were delineated to accumulate maximum LEUs in same transect. Representative profile observation with random profiles and auger sampling were done to cover all the LEUs confirming soillandform relationship (Figure 4). The morphological properties of the horizons of the profiles that were studied up to a depth of 150cm following the standard procedure of Soil Survey Staff [10]. Soil samples of 1kg each from all the horizons were collected from the representative profiles for laboratory analysis. The soils were correlated and classified at soil series level according to Soil Taxonomy [11].
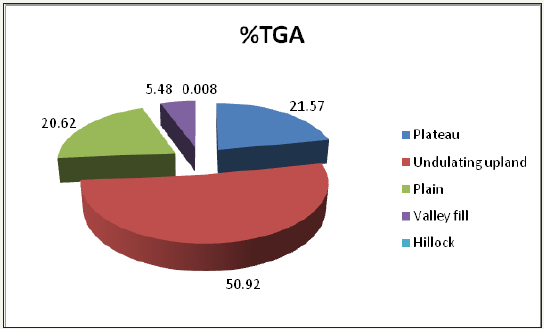
Figure 4: Landform areas in Rajnagar block.
Soil analysis, data interpretation and mapping at 1:10000 scale
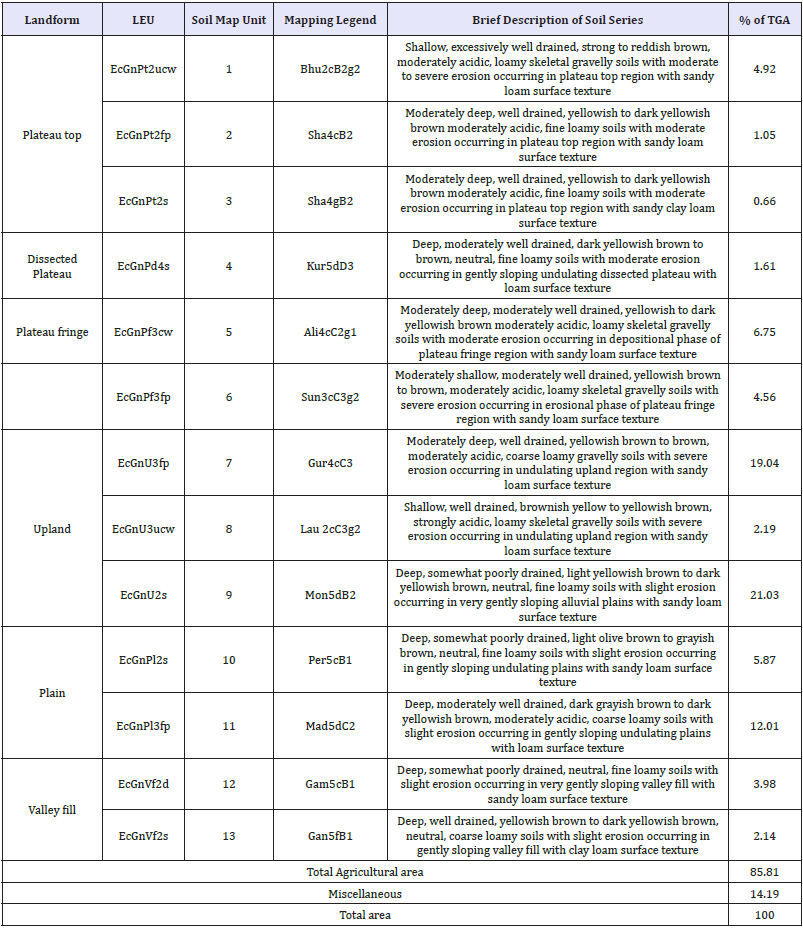
The collected soil samples were air dried, ground through 2mm sieve and processed by sieving and labeling. The samples were analyzed for various physical and chemical properties viz. mechanical analysis, pH, EC, organic carbon, CEC, exchangeable bases, base saturation, ESP, soluble salts, available macro and micronutrients as per standard methods [12,13]. Based on the morphological, physical and chemical data interpretation, the soil mapping units have been described in Table 1.
Table 1: Soil mapping units of Rajnagar block.
A Case Study
Land use/land cover map
Figure 5: Land use/land cover map of Rajnagar block.
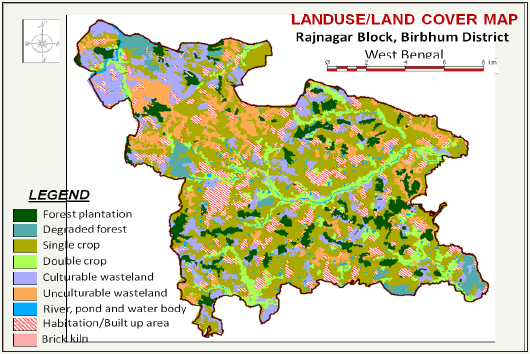
On the basis of image interpretation IRS-P6 LISS-IV (February, 2014), three major land uses i.e. forest, cropland and wasteland were identified covering major area (Figure 5) of the block. The land use was further reclassified into different sub-classes depending on the type of vegetation (natural or manmade), type and duration of crop (single or double) or renewability of the wastelands (culturable and unculturable). Natural forests of Rajnagar block have been partially disappeared by indiscriminate cutting which were further afforested with different tree species by the State Government Departments. Forest plantation, crop land and wastelands covered about 12.6%, 52.6% and 20.7% of total geographical area (TGA) of Rajnagar block (Figure 6), respectively.
Physiography and landform map
Rajnagar block had a complex geomorphological set up in which the western part consists of the extended portion of Chhonagpur plateau and the eastern part resembles the characteristics of Indo-gangetic plains. The area is having a typically three major physiography-plateau, undulating upland and alluvial plain, with nine landform units such as dissected plateau, plateau top, plateau fringe, gently sloping undulating upland, very gently sloping undulating upland, gently sloping undulating plain, very gently sloping alluvial plain, valley fill and hillock (Figure 7) constituting 21.6%, 50.9%, 20.6%, 5.5% and 0.08% of TGA, respectively (Figure 4).
Figure 6: Land use distribution in Rajnagar block.
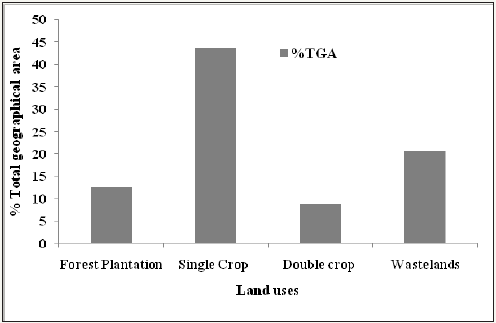
Figure 7: Landform map of Rajnagar block.

Landscape ecological unit map
The layers of landform, landuse and slope were superimposed and integrated in ArcGIS to delineate landscape ecological unit (LEU) map. Based on the delineation and interpretation, 45 LEU units have been identified (Figure 8). Dissected plateau, plateau top, plateau fringe, gently sloping undulating upland, very gently sloping undulating upland, gently sloping undulating plain, very gently sloping alluvial plain and valley fill had 4, 5, 6, 6, 6, 6, 6 and 6 LEU units, respectively constituting maximum 14.8% of the total geographic area under gently sloping undulating upland with single crop.
Soil sampling, analysis and mapping at 1:10000 scale
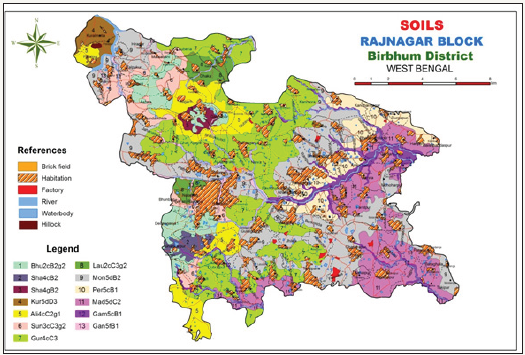
Based on the interpreted LEU units, 125 profile samples (Figure 9) have been collected along with additional 100 auger observations. After analyses of different soil morphological, physical and chemical database, thirteen soil mapping units have been identified at 1:10000 scale and mapped (Figure 10). The brief descriptions of the soil mapping units have been presented in Table 1. These 13 soil mapping units are considered to be basic soil resources for developing further farm level land use planning. The soil map with respect to the soil boundary has been further fine tuned after one more soil check ground truth process.
Figure 8: Landscape ecological map (LEU) of Rajnagar block.
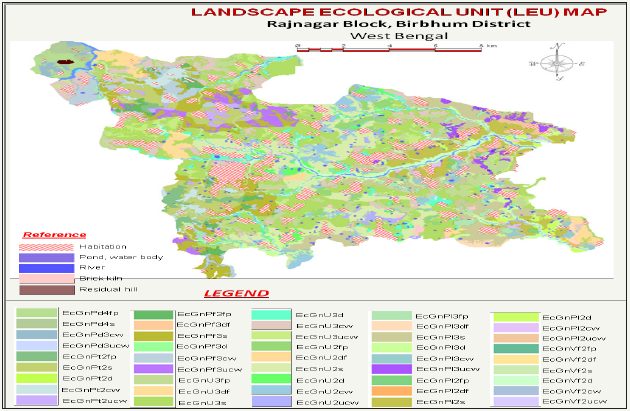
Figure 9: Map of Rajnagar block for profile observation points.

Figure 10: Soil map of Rajnagar block.
Conclusion
Land resource inventory is highly dependent on accurate and elaborate base map interpretation. For LRI at 1:10000 scale, the geo-spatial tools and techniques contributed a major share in preparing the landscape ecological (LEU) map (base map for soil resource survey) by integrating different layers in GIS environment. By following this methodology, Rajnagar block has been surveyed resulting a good quality soil resource data generation at 1:10000 scale for further developing agricultural land use plan for the block.
References
- Ibelings BW, Fastner J, Bormans M, Visser PM (2016) Cyanobacterial blooms. Ecology, prevention, mitigation and control: Editorial to a CYANOCOST Special Issue. Aquatic Ecology 50(3): 327-331.
- Merel S, Walker D, Chicana R, Snyder S, Baurès E, et al. (2013) State of knowledge and concerns on cyanobacterial blooms and cyanotoxins. Environment International 59: 303-327.
- Codd GA, Morrison LF, Metcalf JS (2005) Cyanobacterial toxins: risk management for health protection. Toxicology and Applied Pharmacology 203(3): 264-272.
- Welker M, Von Döhren H (2006) Cyanobacterial peptides nature’s own combinatorial biosynthesis. FEMS Microbiology Reviews 30(4): 530- 563.
- (2017) Handbook of cyanobacterial monitoring and cyanotoxin analysis. Meriluoto J, Spoof L, Codd GA (Eds.), John Wiley & Sons, Hoboken, New Jersey, USA.
- Wood R (2016) Acute animal and human poisonings from cyanotoxin exposure A review of the literature. Environment International 91: 276- 282.
- Vijayakumar S, Menakha M (2015) Pharmaceutical applications of cyanobacteria A review. Journal of Acute Medicine 5(1): 15-23.
© 2018 Dr. Shreyasi Gupta Choudhury. This is an open access article distributed under the terms of the Creative Commons Attribution License , which permits unrestricted use, distribution, and build upon your work non-commercially.
 a Creative Commons Attribution 4.0 International License. Based on a work at www.crimsonpublishers.com.
Best viewed in


.jpg)


 Editorial Board Registrations
 Submit your Article
 Refer a Friend
 Advertise With Us
.jpg)


.jpg)


.bmp)
.jpg)
.png)
.jpg)


.jpg)


.png)

.png)


.png)


