
- About Us
- Information
-

The Author ensures that the research has been conducted responsibly and ethically with adherence to all relevant regulations. read more..
- For Authors
- For Reviewer
- Manuscript Guidelines
- Membership
- Publication Ethics
-
- Journals
- Reprints
- e-Books
- Videos
- Policies
- Contact Us
 COVID-19
- Submissions


Full Text
Environmental Analysis & Ecology Studies
The Relationship between Surface Water Quality and Watershed Characteristics
Mehdi Vafakhah*
Faculty of Natural Resources, Tarbiat Modarres University, Iran
*Corresponding author: Mehdi Vafakhah DR, Associate Professor in Water Resources and Hydrology Department of Watershed Management, Faculty of Natural Resources, Tarbiat Modarres University, P.O.Box 46417-76489, Noor, Mazandaran Province, Iran
Submission: December 16, 2017; Published: February 27, 2018

ISSN: 2578-0336 Volume1 Issue3
Abstract
The healthy water resources are necessary and essential prerequisite for environmental protection and economic development, political, social and cultural rights of Iran. In this research, water quality parameters i.e. total dissolved solids (TDS), sodium absorption rate (SAR), electrical conductivity (EC), Na+, Cl-, CO32-, K+, Mg2+, Ca2+, pH, HCO3- and SO42- during 2010-2011 were obtained from Iranian Water Resources Research Institute in water quality measurement stations on Mazandaran province, Iran. Then, the most important catchment characteristics (area, mean slope, mean height, base flow index, annual rainfall, land cover, and geology) were determined on water quality parameters using stepwise regression via backwards method in the 63 selected rivers. The results showed that sodium absorption rate (SAR), total dissolved solids (TDS), electrical conductivity (EC), Na+ and Cl- parameters are strongly linked to geology characteristics, while K+, Mg2+ and Ca2+ cations is linked to rainfall and geology characteristics. pH and HCO3- are related to area, rainfall, land cover and geology characteristics, CO32- is related to area, rainfall, rangeland area and geology characteristics and SO42- is related to area, rainfall, range and bar land area and geology characteristics. Adaptive Neuro-Fuzzy Inference System (ANFIS) was used for modeling the selected catchment characteristics and water quality parameters. The ANFIS models have a low Nash-Sutcliffe model efficiency coefficient (NSE) and high root mean squares error (RMSE) to estimate water quality parameters except EC, Cl- and Ca2+ parameters.
Keywords: pH; TDS; EC; Water quality; Water cautions; Water anions; Modeling; Mazandaran province
Introduction
Clean water is an essential prerequisite for environmental protection and economic development, political, social and cultural development of a country [1]. World population growth in recent decades and the increasing demand for food and rising health problems, increased per capita water consumption and pressure on existing water resources, have made resource conservation and food production necessary. Resource conservation and food production in terms of quality and quantity especially soil and water resources are a public duty. Unfortunately in Iran, the entry of fertilizers and pesticides and plant diseases in agriculture, created an imbalance between what is needed and what is consumed. Inappropriate use of chemicals in agriculture, led to increasing pollution of water resources that are passing through the towns and villages which and were infected enough. According to the fact that changes in the environment, under the influence of chemicals need for a strategy and plan for protect water resources and its pollution control is important for its management [2]. Different factors affect the health of surface waters, so that the water quality at any point in a river, represents the major effects of land cover and existing land use, weather conditions, rainfall, population density, livestock density, petrology and geology in the watershed [3]. Several indirect methods to simulate natural systems, estimates more accurate, more comprehensive and more complex calculations using a computer has been invented. One of these methods is modelling or simulation. There are many models for predicting water quality parameters including white box and black box models. Among these use of the statistical methods to predict water quality parameters, in terms of taking into account the characteristics of the watershed and lack of complexity of white-box models has attracted the researchers [4]. In recent years, there has been an increasing interest in intelligence models e.g. Artificial Neural Network (ANN), Adaptive Neuro-fuzzy Inference System (ANFIS), Fuzzy Logic and Genetic Algorithm for systems control [5,6].
Zhao et al. [2] predicted water quality in Yuqiao reservoir, China using ANN. The results showed that this model has high performance for predicting water quality. Zhang et al. (2008) developed a numerical water quality model based on reactive chemical transportation in rivers and streams. The results indicated the importance of using numerical models to solve specific problems. Singh et al. [4] applied ANN for modelling the dissolved oxygen (DO) and biochemical oxygen demand (BOD) levels in the Gomti river (India). The results showed that ANN can be used as a tool for the computation of water quality parameters. Areerachakul [7] compared the predictive ability of the ANFIS and ANN models to estimate BOD through data obtained from 11 measurement sites of Saen Saep canal in Bangkok, Thailand during 2004-2011. The results showed that the performance of ANFIS model is better than ANN model. Rankovic et al. [8] modeled the DO variable using ANN based on a three-year date in Gruza reservoir, Serbia. The ANN input variables included: pH, Water temperature, chloride, phosphate, nitrates, nitrites, ammonia, iron, manganese and electrical conductivity. The results showed that effective inputs that had an effect on the DO variable were pH and temperature.
Rothwell et al. [9] predicted water quality of rivers in North West England using the linear relationship between water quality parameters and watershed characteristics (terrain accidents, land cover, geology and base flow index and rainfall). The results showed that the approach works well for the prediction of nitrate concentrations and other constituents which have predominantly diffuse sources. In contrast, the linear approach to predicting orthophosphate concentrations using catchment characteristics is problematic. The major influence of point sources may mask the effect of wider basin attributes on orthophosphate concentrations. During recent years, the evolution of industry, commercial tourism and agriculture in the province is growing. Water quality undoubtedly has a direct impact on the sustainable development of human activities in the province. Therefore factors affecting water quality in rivers and the extent to which these factors affect water quality should be considered. This study aims to identify the most important factors affecting water quality parameters and also to determine the relationship between water quality parameters and characteristics of the watersheds of rivers using ANFIS in Mazandaran province.
Materials and Methods
Mazandaran province with a population density of 127 people per square kilometer in northern Iran is situated on the southern shores of the Caspian Sea. The study area equals 26132.13km2 and is located within the latitudes 35°45' N to 36° 59' N and longitudes 50°10' E to 54° 42' E. Mazandaran province has 13 major rivers: Babolroud, Tajan, Siyahroud, Haraz, Nekaroud, Sardabroud, Cheshme-e- Gileh, Galandroud, Garmabroud, Chalosroud, Nesaroud, Chalakroud and Safaroud. These rivers flow from the Alborz mountains into the Caspian Sea. The water of the rivers is used in agriculture, industry and for drinking. The study area based on precipitation, temperature characteristics and topography is divided into Hyrcanian temperate and mountain climates. Position of the sampling sites is shown in Figure 1. In this research, water quality data, including: total dissolved solids (TDS), sodium absorption rate (SAR), electrical conductivity (EC), Na+, Cl-, CO32', K+, Mg2+, Ca2+, pH, HCO3- and SO42 from 63 sampling sites for the period October 2010 to September 2011 collected by Iran Water Resources Research Center (IWRRC) have been used for this study (Table 1). The sampling sites were selected based on two characteristics:
Figure 1: The sampling sites across Mazandaran province used in the study.

Table 1: List of sampling sites used in the analysis.

a) The dam, diversion and direct water utilization did not exist in their upstream
b) Data are complete and continuous. Ultimately these 63 sampling sites with continuous and complete data were selected. Water quality parameters have been collected monthly by IWRRC. Samples have been picked in areas with low slope river, a calm and non-muddy river and from the middle of the river. After collecting samples, water quality parameters are measured according to standard methods. After organizing data, their annual mean in order to analyze has been utilized.
Methodology
Physical characteristics of watershed
At this stage, statistics, information and maps needed were collected. Independent variables, including physiographic variables, mean annual rainfall, base flow index (BFI), land use and geological characteristics were considered. To extract physiographic variables, digital elevation model (DEM) with a scale of 1:50,000 were prepared within Arc/GIS 9.3. Then sampling sites location was determined on DEM. Watershed containing each sampling site was determined and drawn using ArcHydro extension within Arc/GIS 9.3 (Figure 1). Finally physiographic characteristics, including area, weighted mean slope and weighted mean height were derived. To calculate mean annual rainfall, monthly rainfall data for water-year 2010 (October 1, 2010 to September 30, 2011) were received from Iran Water Resources Research Company (IWRRC). Then the closest weather station to the selected watershed areas was chosen. According to ratio of weighted mean height of watershed area to mean height of weather station, mean annual rainfall was determined. To calculate BFI, monthly discharges were obtained from IWRRC for 63 sampling sites in water-year 2010. Monthly hydrographs were drawn and amount of the base flow rate was determined by a straight line on the hydrograph. Finally, BFI was determined as ratio volume of water beneath separation line to volume of water beneath recorded hydrograph [10]. To determine land use, land use map was derived using a 2002 land use map with scale of 1:250,000 obtained from the Iran Forest, Ranges and Watershed Management Organization. The land use map was categorized into seven types, including forest, rangeland, bare land, dry farming land, irrigated land, urban and water body (Figure 2). To determine lithology, geological maps with scale of 1:100,000 were obtained from Iran Geological Survey and Mineral Exploration. All geological formations in upstream areas of watersheds were identified and classified in 14 groups, including: Lavas and Granite, Chalk, Shales, Sandstone, Lime, Conglomerates, Marl, Lime & Shales, Conglomerates & Sandstone, Lime & Sandstone, Shales & Sandstone, Lime & Marl, Tuff & Marl and Alluvial formations [11].
Figure 2: Land use type of sampling sites used in the study.

Stepwise regression
Linear relationship between variables was performed using stepwise regression. Stepwise regression can be performed in three methods, including forward, backward and step by step methods. In backward method, all independent variables were considered into the model, then the effect of each variable elimination is assessed [12].
Adaptive Neuro-Fuzzy Inference System (ANFIS)
The Sugeno type with five layers, namely, a fuzzy layer, a product layer, a normalized layer, a defuzzy layer and a total output layer was used in the study [13]. The Sugeno type used in the study was grid partitioning with four different types of membership functions (MFs) named gaussian1 (gauss1MF), gaussian2 (gauss2MF), generalized bell-shaped (gbellMF) and triangular (triMF) [13]. The inputs and outputs data were normalized before modelling based on the ANFIS between 0.1 and 0.9 as follows:
Χmax—Χmin
Where Ni is the normalized value, xi is the original data, xmin and xmax are, respectively, the minimum and maximum of data.
Performance assessment
Two statistical indices, including Nash-Sutcliffe efficiency coefficient (CE) and normalized root mean squares error (NRMSE) used to evaluate modeling performance can be computed using following equations.
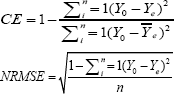
Where,
Yo = The observed value of the dependent variable
Ye = The estimated value of the dependent variable
 = The mean observed value of the dependent variable
n=the number of data points.
RMSE values change between 0 and 1, values which are closer to zero indicate high accuracy predicted. The CE coefficient varies between negative infinitely and one and values which are closer to 1 indicate higher performance model.
Results and Discussion
Table 2: Statistical summary of water quality parameters rivers of the Mazandaran province.

TDS: Total Dissolved Solids; EC: Electrical Conductivity; SAR: Sodium Absorption Rate
Table 2 shows statistical summary of water quality parameters rivers of the Mazandaran province during water-year 2010. The highest value of TDS, EC, Cl-, K+, Na+ and SAR were observed in Baleyran stations, pH in Dinarsara station, CO32' in Mashalahabad station, HCO3 in Sarokola station, SO42' and Mg2+ in Khatirkuh station and Ca2+ in Pol-e Mergen station. While the lowest value of TDS, EC, K+, HCO3', Ca2+ and Mg2+ were observed in Kelardasht station, pH in Sarokola station, SO42’ and Cl- Dinarsra station, Na+ in Ghalehgardan station and SAR in Ganeksar station.
Table 3: Statistical characteristics of independent variables used in this study.

In general, sampling sites with the highest value for water quality parameters have been located in the western areas of the province. It was observed that sampling sites existing in the western areas of the province have often been located at a lesser distance from the coastline of Caspian Sea and are more greatly affected by human activities. This finding is in agreement with Mirzaee et al. (2014) findings which showed that most stations located in the western areas of Mazandaran province has water quality classes between moderate to bad. Descriptive statistics of physical characteristics are given in Table 3. As can be seen from Table 3, 26 variables included four physiographical, fourteen geological, one meteorological and seven land use variables have been considered to model water quality. A considerable amount of literature has been published on water quality using physiographical, meteorological and land use variables [7,8,14]. However, far too little attention has been paid to geological variables [9]. The highest value of area and weighted mean slope belong to Karehsang and Vaspul stations, respectively. The highest value of weighted average height and rainfall belong to Kelardasht station. The highest value of base flow index belongs to Doab-e Chalous station. In terms of land use, the greatest amount of forest area (100 percent) belongs to Baleyran, Diva, Gavormak and Palande Rudbar stations. The greatest amount of rangeland belongs to Razen, Pol-e Mergen and Dareh Harijan stations. The greatest amount of dry land farming belongs to Sarokola station.
In terms of geological formations, the greatest amount of Lavas and Granite group is observed in Razan station, Lime in Charz station, Conglomerates in Paltan station, Marl in Darabkola station, Conglomerates & Sandstone in Sarokola station, Shales & Sandstone in Vaspul station, and Lime & Marl in Kheyroud Kenar station. Table 4 shows correlation coefficients of water quality parameters and variables in this study. Table 5 shows the results of the backward stepwise regression method. As can be seen from Table 5, rainfall and land use showed high correlation with the most water quality parameters while among geology formations, only Tuff & Marl group formation which is not widespread in the study area showed high correlation with water quality parameters. The effect of land use on surface water has been investigated in a lot of studies such as that observed by Amiri & Nakane [15] who had reported a significant relation between land use and water quality. Also Na+ and SAR did not show significant correlation with effective parameters.
Table 4: Correlation coefficients of effective variables and water quality parameters in the study area.

Table 5: Results of stepwise regression procedure via backward method.

A: Area(km2); P: Annual rainfall(mm); Lime & Marl: Lime & Marl formations (%); Tuff & Marl: Tuff & Marl formations (%); Lime: Lime formations(%); Lime & Sandstone: Lime & Sandstone formations(%); Lime & Shales: Lime & Shales formations(%); Sandstone: Sandstone formations(%); DF: Dry land Farming(%); AGR: Irrigated land farming(%); BL: Barren Land(%); R: Rangeland(%)
Table 6: Results of stepwise regression procedure via backward method.

Considering to the results of the backward stepwise regression method in SAR, Na+ and Cl- parameters, Tuff & Marl geology group, in EC & TDS parameters, Tuff & Marl, Lime & Marl geology group, in pH parameter, area & rainfall factors and Barren land & rangeland, Sandstone, Lime & Shales, Lime & Sandstone, Tuff & Marl, Lime, in K+, Mg2+ and Ca2+ parameters rainfall and Tuff & Marl factors, in HCO3’, area, agriculture, dry land and rangeland and Shales, Tuff & Marl geology group, in CO32" parameter area, rangeland and Lime & Shales, Lime & Sandstone, Tuff & Marl and Lime geology groups, in SO42" parameter, rainfall factor, rangeland and Barren Land and Tuff & Marl geology group, were chosen as effective variables. Since there were no differences between results modelling using the four different types of MFs, the results of ANFIS procedure using g bell MF are shown in Table 6. Use of ANFIS for modeling water quality parameters have been used in a lot of previous studies [7,16]. In general, the ANFIS model has a low efficiency and high error for estimating water quality parameters except EC, Cl- and Ca +. The major influence of point sources may mask the effect of wider basin attributes on water quality parameters [9]. This result is in agreement with Rothwell et al. [9] findings for predicting orthophosphate concentrations in North West rivers. Also, the effect of point pollutant sources on water quality in the rivers of Mazandaran province has been indicated by Nasirahmadi et al. [3].
Conclusion
The purpose of the current study was to model the relationship between water quality parameters and characteristics of the watersheds of rivers using ANFIS in Mazandaran province. This study has found that generally sampling sites with the highest values of water quality are located in the western areas of the province. On the other hand, rainfall and land use showed high correlation with most of the other water quality parameters. Therefore, it is recommended to use the results of this study in order to improve water quality management in the rivers of Mazandran province. The suitable management practices can be used for water pollution control in the rivers of the Mazandran province. In addition, according to low efficiency of ANFIS models, other modeling methods viz. support vector machines were used for modeling water quality parameters. Also, ANFIS models could be successfully used in estimating EC, Cl- and Ca2+ using watershed characteristics. The current study was unable to model some biological water quality parameters (e.g. DO, BOD) due to the data unavailability.
References
- Sargaonkar A, Deshpande V (2003) Development of an overall index of pollution for surface water based on a general classification scheme in Indian context. Environmental Monitoring and Assessment 89(1): 4367.University SCIENCE A 8(9): 1482-1487.
- Zhao Y, Nan J, Cui F, Guo L (2007) Water quality forecast through application of BP neural network at Yuqiao reservoir. Journal of Zhejiang University SCIENCE A 8(9): 1482-1487.
- Nasirahmadi K, Yousefi Z, Tarassoli A (2012) Zoning of water quality on Haraz river bases on national sanitation foundation water quality index. J Mazandaran Univ Med Sci 22(92): 64-71.
- Singh KP, Basant A, Malik A, Jain G (2009) Artificial neural network modeling of the river water quality- a case study. Ecological Modelling 220(6): 888-895.
- Abghari H, Mahdavi M, Fakherifard A, Salajegheh A (2009) Cluster analysis of rainfall- runoff training patterns to flow modeling using hybrid RBF Networks. Asian Journal of Applied Sciences 2(2): 150-159.
- Vafakhah M (2012) Application of artificial neural networks and adaptive neuro-fuzzy inference system models to short-term stream flow forecasting. Canadian Journal of Civil Engineering 39(4): 402-414.
- Areerachakul S (2012) Comparison of ANFIS and ANN for estimation of biochemical oxygen demand parameter in surface water. International Journal of Chemical and Biological Engineering 6: 286-290.
- Ranković V, Radulović J, Radojević I, Ostojić A, Čomić L (2010) Neural network modeling of dissolved oxygen in the Gruža reservoir, Serbia. Ecological Modelling 221(8): 1239-1244.
- Rothwell J, Dise N, Taylor K, Allott T, Scholefield P, et al. (2010) Predicting river water quality across North West England using catchment characteristics. Journal of Hydrology 395(3): 153-162.
- Zarrin H, Sharifi F, Vafakhah M, Mahdian M (2009) Regional analysis of low flow in Karkheh and Karoon Watersheds. Journal of Applied Sciences 9(6): 1141-1146.
- Ahmadi H, Feiznia S (2006) Quaternary formation (Theoretical and applied principles in natural resources): University of Tehran, Iran.
- Bihamta MR, Zare Chahuki MA (2011) Statistics of Natural Resources: University of Tehran, Iran.
- Jang JS (1993) ANFIS: adaptive-network-based fuzzy inference system. IEEE Transactions on Systems, Man, and Cybernetics 23(3): 665-685.
- Ahangar AG, Soltani J, Abdolmaleki AS (2013) Predicting Mn concentration in water reservoir using artificial neural network (Chahnimeh1 reservoir, Iran). International Journal of Agriculture and Crop Sciences 6(20): 1413.
- Amiri BJ, Nakane K (2009) Modeling the linkage between river water quality and landscape metrics in the Chugoku district of Japan. Water Resources Management 23(5): 931-956.
- Safavi H (2010) Prediction of river water quality by adaptive neuro fuzzy inference system (ANFIS). Journal of Environmental Studies 36(3): 1-10.
© 2018 Mehdi Vafakhah. This is an open access article distributed under the terms of the Creative Commons Attribution License , which permits unrestricted use, distribution, and build upon your work non-commercially.
Editor In Chief


.jpg)


Signup for Newsletter

Quick Links
 Editorial Board Registrations
 Submit your Article
 Refer a Friend
 Advertise With Us
Our Recent Edition

.jpg)


Top Editors


.jpg)


.bmp)
.jpg)
.png)
.jpg)


.jpg)


.png)

.png)


.png)


Financial Support

Sponsors

Latest e-Books

Latest Video

 a Creative Commons Attribution 4.0 International License. Based on a work at www.crimsonpublishers.com.
Best viewed in
a Creative Commons Attribution 4.0 International License. Based on a work at www.crimsonpublishers.com.
Best viewed in