- Submissions
Full Text
Environmental Analysis & Ecology Studies
Determination of Appropriate Water Tariff for Kandy City, Sri Lanka: An Application of Choice Modeling Approach
Sunil Thrikawala* and LHP Gunaratne
The Open University of Sri Lanka, Sri Lanka
*Corresponding author: Sunil Thrikawala, The Open University of Sri Lanka, Nawala, Nugegoda 10250, PO Box 21, Sri Lanka
Submission: January 12, 2018; Published: February 23, 2018

ISSN: 2578-0336 Volume1 Issue3
Abstract
A large scale sewerage treatment plant has been proposed as a remedial action to the water pollution of Mahaweli River, the main source for domestic and industrial water in the Central hill country of Kandy, Sri Lanka. However, an appropriate tariff structure has not been properly studied and designed though it has been decided to charge sewerage treatment through increased water tariff. This study attempted to employ choice modeling approach to determine the appropriate tariff rate for sewerage treatment. Even though the results are inconclusive this study shows how choice modeling can be applicable to solve such a research question.
Keywords: Sewerage treatment; Choice modeling; Tariff rate
Introduction
Kandy, the central capital, also known as the cultural capital, is a major tourist attraction of Sri Lanka. The city highly populated with population density of 660 persons per square kilometer. The surface flow of drainage and waste water coming from the highly populated areas finally reaches the Mahaweli River along few tributaries. Unfortunately this is the main source of water to cater the people and industry within Kandy Municipal area. As a remedial action the National Water Supply and Drainage Board (NWSDB) and the Kandy Municipal Council (KMC) have jointly proposed a centralized Sewerage Treatment Plant (STP) for Kandy city. The main objective of the STP is to lower the pollution of Mahaweli River through adoption of improved wastewater management practices. The STP is a Rs. 14 billion project with an estimated Operation and Management (O&M) cost of Rs. 11 million per month (as per the estimates in the year 2007). It has been proposed to recover the O&M cost from the users through increased water tariff. However, peoples' willingness to join the system, and their willingness to pay for the service and the amount have to be evaluated to decide the appropriate tariff rates. Choice modeling (CM) is a family of survey-based methodologies for modeling preferences for goods. These goods are described in terms of their attributes and of levels that each attribute take. The underlying basis of a choice experiment is the idea that any good can be described in terms of its attributes, or characteristics, and the levels that these attributes take [1j.
In CM, respondents are presented with various alternative description of a good, differentiated by their attributes which consist of different levels and asked to indicate their most preferred options [2j. The set of options contained in each question is known as a choice set. A choice set involves a choice between a constant "status quo" situation and a number of different "proposed" situations. By including price/cost as one of the attributes of the good, WTP can be indirectly recovered from people's ranking, ratings or choices. CM has been widely used in market research and transport literature and started application in environment literature as well. There are also few applications of CM in the water sector. A study done by MacDonald et al. [3] used CM for estimating implicit prices associated with urban water supply [4j. It has also been attempted to use CM in irrigation water supply policy and management. The authors showed that provision of local public goods requires full understanding of local people’s preferences over policy design, and their willingness to switch from status quo to new regimes of public goods or institutions [5j.
Theoretical framework of choice modeling
The choice experiment (CE) was first developed by Louviere & Hensher [6] and Louviere & Woodworth [7j. This is based on Lancaster's characteristics theory of value (Lancaster, 1966) and states any good can be described as a bundle of characteristics, and the levels. CE also based on random utility theory [8] which expresses a Person's preferences could be represented by a utility function, U as
U = U(X1...Xm ; Z1..zn)
Where utility depends on the levels of X=1...m marketed goods and services consumed, and on Z=1...n environmental goods consumed. Here, elements X and Z are unobservable to a researcher but observable with an error. To tackle this, the utility function U (.) is broken down into two parts: deterministic and observable V (.), and an error part, e (.). Hence, the equation is written as:
U = U (X1 ...Xm; Z1..Zn) = V (X) + e( X, Z)
(The bold letters represent vectors) If a person is being asked to choose between two alternative goods, which are different by their attributes and levels, (alternatives g and h) (This list of "all available selections/options" is referred to as the choice set). The probability that any person "i" prefers option g in the choice set to option h, can be considered as the probability that the utility associated with option g exceeds that associated with all other options, as

This implies that person "i" will select option g over option h if the difference in the deterministic parts of their utilities is greater than the difference in the error parts [8] stated that the distribution of the error term could be represented by logistic distribution. The empirical model used in this study is a binomial log it model based on the Attribute Based model presented by Holmes & Adamovicz [9]. The dependent variable is binomial in nature and where consumers were confronted with two choice sets including different combinations of the levels of the attributes. Then depending on the level of each attribute selected effects codes were formulated using the procedure given by Holmes & Adamovicz [9]. These effects codes were used as the independent variables along with other explanatory variables such as income, assets, household size etc.
Empirical work
Selection of attributes and levels: Several key informant interviews were conducted with officials attached to the NWSDB, and the KMC including the mayor of the KMC and randomly selected general public in order to select the attributes and the levels of each attribute. The developed questionnaire was pretested in the study area to finalize the attributes and the levels with public opinion. The selected attributes and the levels of each attribute are given in (Table 1)All attribute were selected with 3 levels to make the analysis part easier.
Table 1: Attributes and levels.

Data Collection
A household survey was conducted in the Kandy Municipal area in order to find out the appropriate tariff structure for proposed sewerage treatment. The study area was divided into three strata according to the economic status in which strata 1 (Heeressagala and Dangolla) and Strata 2 (Katukele and Aniwatta) were considered as the middle to high income areas while Suduhumpola area was considered as the low income area. This exercise also used a structured questionnaire which was pretested few times. Eighty households were interviewed from each strata. Households were interviewed for their mode of sewer and waste water disposal, concern on the water pollution, awareness about the proposed STP, their opinion on STP and its possible advantages etc. Prior to the interview a picture of the proposed STP depicting the location of the treatment plant, pumping stations and the pipe system was shown and a basic description on the project costs, benefits and a narrative description of all the attributes and their levels were provided. Finally each household was given to choose from four pairs of choice sets one pair at a time. Each pair was printed on cardboard in Sinhalese as well as English to facilitate in selecting a particular choice set. In obtaining data households were categorized into two groups i.e. households who use less than 20m3/month and more than 20m3/month.
Results and Discussion
Descriptive statistics
The descriptive statistics of the system of sewerage disposal, public opinion on water pollution, awareness of proposed STP,? and their opinion on STP were tested in the study and the results are given (Table 2). In presenting the results, fist two strata were pooled into high-medium income area. Except in one household in Suduhumpola area, every household is having at least a septic tank to dispose sewerage. Though it has been recommended to have a soaking pit along with the septic tank, only 30% of the households had both together in the study area. However, the situation is slightly better in the high-medium income areas where on average 40% of the households had both of these. This implies that 60% of the households, even in high-medium income areas, directly dispose there kitchen waste to drains and thereby to the water bodies. The results showed that more than 80% of the households were willing to have sewerage and wastewater system for Kandy city and only just above 50% of the population knows about the proposed STP for Kandy, irrespective of the living status. Further, most of the people who came to know about STP were from friends. These imply awareness program that has been implemented by both NWSDB and KMC was not effective. In consistent with the above findings most people (on average 87%) felt that STP should be implemented right away. Interestingly, people living in densely populated areas like Suduhumpola were more likely to have the STP than the high-medium income areas (94% to 74%) despite the fact that economically they are less capable of paying the tariff.
Table 2: Descriptive statistics of the sample across strata.
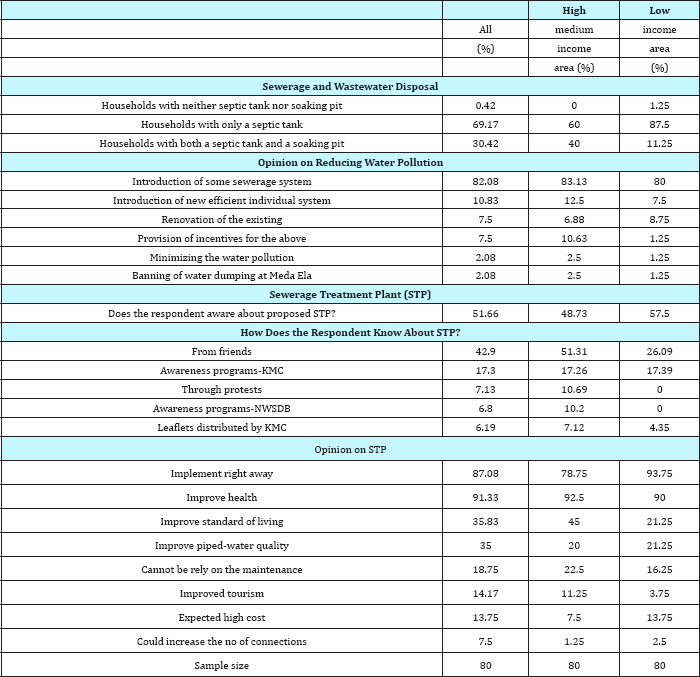
Table 3: Results of the consumer preference on the two institutions.

The results of the general opinion of the people on the potential impacts of the STP are also shown in (Table 2) given above. Overall, more than 90% and 35% of the households thought that STP would improve the health status and standard of living of the people living in Kandy respectively. Results also showed some evidence that STP would improve water quality. This study also evaluated the water supply service provided by the KMC, in terms of its service, maintenance, institutional service, water quality and the tariff rates (Table 3). According to the results, people are generally satisfied with the overall drinking water supply provided by the KMC. However, a significant proportion of the households is unsatisfied with KMC's maintenance, institutional services and water quality. Most significantly 46% of the households in Suduhumpola area are unsatisfied with institutional service (problem solving and handling the complaints). Further 10% of the households are highly unsatisfied about the service in terms of maintenance, institutional service. As an institution the KMC is lacking the required technical knowhow, financial support and the human capacity to provide an efficient service even though the existing staff is committed to do so. As expected people are satisfied with the water rates as the water rates are much lower than that of the NWSDB's rates. This is more prominent in the lowest income Suduhumpola area where the average consumption of water is around 15m3/month compared to the other areas where households consume around 25m3/month on average.
Preference for the levels of attributes
Table 4: Overall preference to different levels of attribute (%).
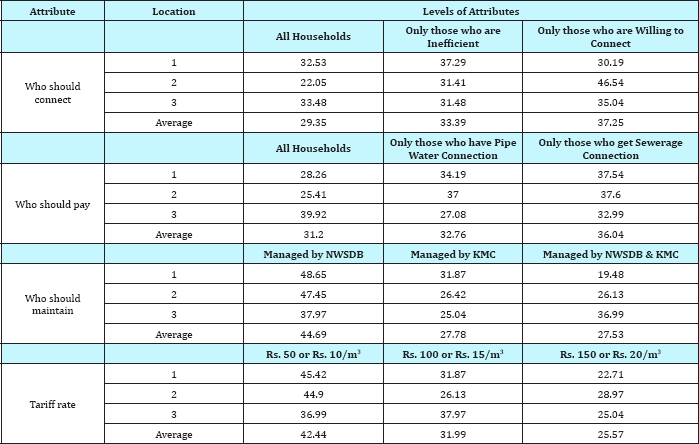
Table 4 depicts the descriptive statistics of the preference of level of each attribute. In general, people prefer if they have the choice of whether connecting to the STP. However, the crosstabs for each strata it show that people in Heeressagala and Dangolla areas prefer those people who are inefficient in sewerage disposal should connect to the STP. The results of the second attribute 'who should pay for the sewerage system' indicate that only the households who get connected to the STP should pay the tariff. However, households in Suduhumpola area believe that all households should pay the sewerage tax. This is a rational decision because they only consume a small quantity of water and they have to pay only a smaller tax when it is dispersed over a larger number of consumers. In contrast, the people in other two areas who are mostly heavy water users and they think that the sewerage tax is going to be another burden and prefer to avoid if possible.
The results also show that the most preferred level for the third attribute 'who should manage the system’ is when STP is managed by the NWSDB rather than the management is by the KMC or jointly by both institutions. This also may be due to the experiences of weaknesses of the KMC in handling maintenance activities. This may be due to the fact that the NWSDB is becoming popular as an institution that has the capacity to manage a project like STPs. As expected, in general, most people prefer lower tariff rates for sewerage than the higher tariff rates indicated by the decreasing preference with increasing prices of water.
Table 5: Preference on who should connect to the STP at two water consumption levels (%).
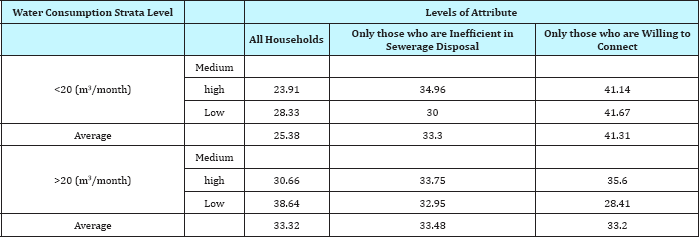
The preferences at two different consumption levels (below 20 and over 20m3/month) were also tested and the results of the attribute one are given in Table 5. Low water consumers prefer to have the choice of connection to the STP while high water consumers are indifferent among the three levels. The results are in consistence with the previous results that the preference for freedom to connect to STP is most prominent in Aniwatta and Katukele areas at both water consumption levels. However, high water consumers at Heeressagala, Dangolla and Suduhumpola areas believe that all households should connect to the STP. This may be the intension of reducing the sewerage tariff with more people contributing to it. Except the fact that high water consumers at Suduhumpola area, mostly prefer that all residents should pay the sewerage tariff there is no much deference between high and low water consumers among levels of the other attributes.
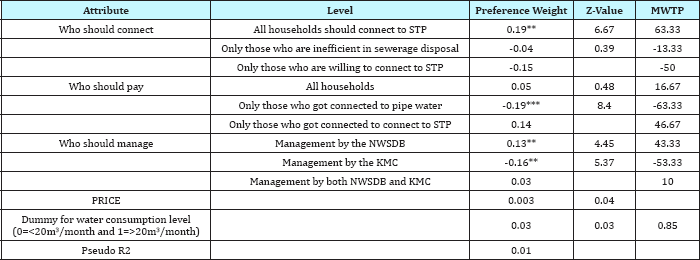
Table 6: Estimates of Binomial Log it for the whole sample.
Econometric estimations
Table 7: Estimates of Binomial Log it at each consumption level.
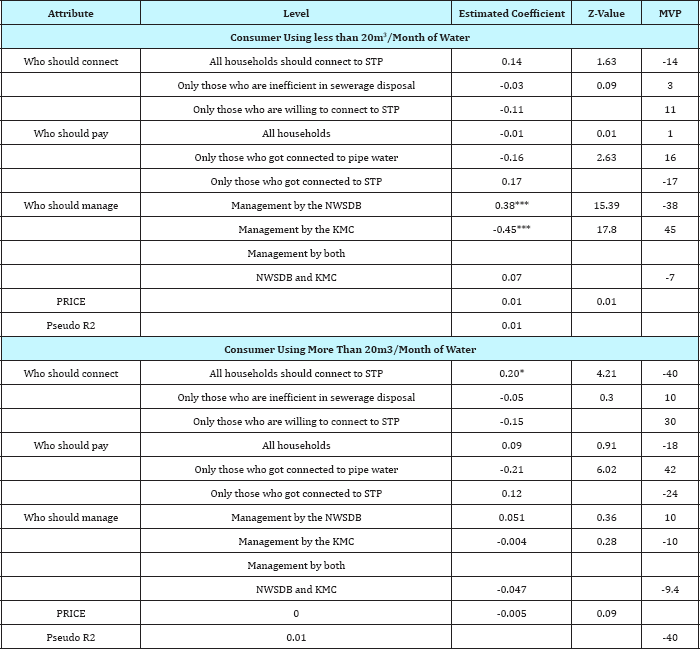
The model equation was estimated using the whole data set together with a dummy variable for the water consumption level and for each water consumption level separately (Table 6 & 7). Preference weights for the base attribute levels were calculated as the sum of -1 times the preference weights on the included levels of each attribute. Marginal willingness to pay (MVTP) values was then calculated by dividing the preference weight by the marginal utility of money (-1 times the preference weight for the price attribute) [9]. Even though some of the estimates are statistically significant the price variable is not significant and the Pseudo R2 values are very small in all of the three regressions. Hence the marginal WTP was not calculated and the results were not used for further interpretations.
Conclusion
The study attempted to use choice modeling exercise to determine the appropriate tariff rate for improved sanitation services in the Kandy district of Sri Lanka. Results showed that the consumers should be given the choice to connect to the STP. The people with higher income people viewed that that only the customers those who get connected to the STP should bear the cost, where as low income groups wanted to share the cost among all residents. Most people wanted the management of the STP should be given to the NWSDB which has the capacity to do so. Always the lower tariff preferred by the people irrespective of the area they live and the level of income. Unfortunately the price variable was not significant and consequently the willingness to pay for sewerage treatment was not estimated. Choice modeling which is consistent with consumer theory is a superior methodology in valuation of environment as clearly shown by Hanley et al. [1]. In this study we have presented how the methodology could be applicable in determining appropriate tariff rates for sewerage treatment despite being inconclusive. As the descriptive results show the awareness programme of the STP has not been implemented adequately and therefore the significant number of choice selection could have been done without proper thinking. Consequently we were unable to get the expected results. By increasing the sample size and awareness programmes prior to the survey could avoid the consequences in this nature.
References
- Hanley N, Mourato S, Wright RE (2001) Choice modeling approaches: a superior alternative for environmental valuation. Journal of Economic Surveys 5(3): 435-462.
- Rolfe J, Bennett J, Louviere J (2000) Choice modeling and its potential application to tropical rainforest preservation. Ecological Economics 35(2): 289-302.
- MacDonald DH, Barnes M, Bennett J, Morrison M, Young MD (2005)Using a choice modeling approach for customer services standards in urban water. Journal of the American Water Resources Association 41(3): 719-728.
- Katayama A, Liu X, Musharrafiyeh H, Sarr M, Swanson T (2009) Understanding farmers preferences for water policy design: an application of choice experiment to portugal-guadiana river basin. In: Koundouri P (Ed.), The use of economic valuation in environmental policy, Rouledge, UK.
- Barton DN, Bergland O (2010) Valuing irrigation water using a choice experiment: An individual status quo modeling of farm specific water scarcity. Environment & Development Economics 15(3): 321-340.
- Louviere J, Hensher DA (1982) Using discrete choice models with experimental design data to forecast consumer demand for a unique cultural event. Journal of Consumer Research 10(3): 348-361.
- Louviere J, Woodworth G (1983) Design and analysis of simulated consumer choice and allocation experiments: An approach based on aggregate data. Journal of Marketing Research 20(4): 350-367.
- McFadden D (1973) Conditional logit analysis of qualitative choice behavior. In: Zarembka P (Ed.), frontiers in econometrics, Academic Press, New York, USA.
- Holmes TP, Adamowicz WL (2003) Attribute based methods. In: Champ PA, KJ Boyle, Brown TC (Eds.), The economics of non-market goods and services. Kluwer Academic Publishers, Netherlands, USA.
© 2018 Sunil Thrikawala, et al. This is an open access article distributed under the terms of the Creative Commons Attribution License , which permits unrestricted use, distribution, and build upon your work non-commercially.
 a Creative Commons Attribution 4.0 International License. Based on a work at www.crimsonpublishers.com.
Best viewed in


.jpg)


 Editorial Board Registrations
 Submit your Article
 Refer a Friend
 Advertise With Us
.jpg)


.jpg)


.bmp)
.jpg)
.png)
.jpg)


.jpg)


.png)

.png)


.png)


