
- About Us
- Information
-

The Author ensures that the research has been conducted responsibly and ethically with adherence to all relevant regulations. read more..
- For Authors
- For Reviewer
- Manuscript Guidelines
- Membership
- Publication Ethics
-
- Journals
- Reprints
- e-Books
- Videos
- Policies
- Contact Us
 COVID-19
- Submissions


Full Text
Environmental Analysis & Ecology Studies
Analysis and Characterization of Kainji Reservoir Inflow System
Mohammed J Mamman1*, Otache Y Matins2 and Jibril Ibrahim3
1,3Department of agricultural technology, College of agriculture Mokwa, Nigeria
2Department of Agricultural, Bioresources Engineering, Federal University of Technology, Nigeria
*Corresponding author: Mohammed J Mamman, Department of Agricultural Technology, College of Agriculture Mokwa, Niger State Nigeria
Submission: December 04, 2017; Published: January 04, 2018

ISSN: 2578-0336 Volume1 Issue1
Abstract
Resilience (m) often used to characterize reservoirs as within or over year systems describes how quickly a system is likely to recover from failure. This study characterize the Kainji reservoir system adopting Vogel stedinger relationship on reservoir resilience and boundary conditions. Inflows data between 1990 2014 obtained from Kainji Dam hydrological station were used in characterizing the reservoir system. The demand levels were hypothetically fixed at 0, 0.2, 0.4, 0.6 and 0.8 in line with reservoir boundary conditions (i.e. if 0 Keywords: Resilience; Characterization; Reservoirs; Coefficient of variation
Introduction
Reservoirs are built usually to serve multiple purposes such as irrigation, municipal and industrial water supply, hydropower generation, navigation and flood control among others. As a result of high variability of annual rainfall and conflicting demands on scarce water resources, the study and operation of reservoir systems through adequate management has assumed great significance to meet the short and long-term requirements. One of the ways of improving the efficiency of water management is increasing the efficiency of the utilization of reservoirs. Hence, it is necessary to study the system and determine optimal reservoir operation guides for each scheme [1].
Without a surface water reservoir system, surface water supplies must be drawn directly from the river. Such systems have water supply yield reliabilities which depend solely on the natural variability of the river and thus, such systems are subject to long periods of drought when river discharges fall below expected yields. Surface water reservoirs are designed to increase both the water supply yield and its associated reliability, while simultaneously providing downstream ecological flow releases among other benefits [2].
Two general classes of reservoir systems exist: over year (alternatively known as carry over) and within year systems. Within year systems are characterized by reservoirs which typically refill at the end of each year. Such systems are particularly sensitive to seasonal and even daily variations in both the hydrological inflows and the system yield. Over year systems do not typically refill at the end .of each year. In this study a failure is defined as the inability of a reservoir system to provide the contracted demand in a given year. Water supply failures for within year systems tend to be short lived in comparison with over year systems since within year systems tend to refill on an annual basis. Naturally, all reservoir systems exhibit some combination of over year and within year behavior [3].
It suffices to note that for, reservoir systems having an equal steady state probability of a failure year q, one being a system dominated by exclusively over year behavior, for an n year period, one would expect nq failures. But for the within year system these failure sequences will typically last only a few .days or months whereas for the over year system a typical failure may last years (if no new water is imported and demand curtailment programmes are not implemented), [3]. A prerequisite to the proper operation, management and design of over year and within year reservoir systems is a thorough understanding of the likelihood, duration and magnitude of potential reservoir system failure sequences. Considering the fact that two basic general categories of systems of reservoirs can be identified, it is imperative that any analysis should take cognisance of this fact. According to Richard & Vogel [3], Hazen, followed by Sudler & Hurst [4], introduced one of the most useful indices of reservoir system performance, here defined as the resiliency index:
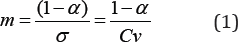
Where α is the annual yield as a fraction of the mean annual inflow μ, σ is the standard deviation of the annual inflows, and Cv is the coefficient of variation of the annual stream flows. Figure 1 shows the relationships among m, σ and Cv given in equation (1). According to Vogel et al. [3], Perrens and Howell (1972), termed m the standardized inflow and that after its use by Hurst, the non dimensional index m has subsequently found use in both analytical investigations in "water storage theory" and in Monte Carlo investigations of the storage reliability yield relationship. Vogel & Stedinger [5] suggest that as long as 0 ≤m≤1, the system is dominated by over year behavior, σ whereas if m>1, the system is dominated by within year behaviour. It is eluded that m is related to the probability that a storage reservoir will recover from a failure and hence it is an ideal measure of reservoir system resiliency. Over year reservoirs with values of m near 0 are less likely to recover from a failure than reservoirs with values of m near unity [3].
Figure 1: The demand level α as a function of the resiliency index m and coefficient of variation of the inflows Cv [3].

Systems with low resiliency (m near zero) are characterized by having either very large values of Cv or α or both (Figure 1). Similarly, reservoirs with values of m near or above unity are more likely to refill once empty and hence such systems are more likely to exhibit within year rather than over year behavior [3].
Since resilient reservoir systems (large resiliency index m) tend to have small demand levels α or small coefficients of variation, one expects that regions with low stream flow variability will contain more resilient reservoir systems than regions with high stream flow variability, for a fixed demand level. Similarly, demand levels generally increase over time, and so one expects a general reduction in the overall resiliency of reservoir systems over time [6]. This research therefore tends to characterize Kainji reservoir system, in an attempt to ascertain the reliability of the inflows for power generation.
Materials and Methods
Material
The hydrological data employed for this study were stream flow.
The study area
Geographically, Kainji hydroelectric dam is located in New Bussa town now headquarter of Borgu local government area of Niger State, Nigeria. The lake created behind the dam span between latitude 9° 8' to 10°7' and between longitude 4°5' to 4°7'E with reference point 9.54N and 4.38E northwest of the Federal Capital Territory (FCT, Abuja) [7].
Hydrology of the niger river system
The average rainfall at the headwaters of Niandan and Milo rivers at the source of the Niger at the Fouta Djallon Mountains in Guinea and its exit to the sea in Nigeria is 2200mm. The river flow regime is characterized by two distinct flood periods occurring annually namely the White and Black floods. The black flood derives its flow from the tributaries of the Niger outside Nigeria (flow lag October to May) and arrives at Kainji reservoir (Nigeria) in November and lasts until March at Jebba after attaining a peak rate of about 2,000m3/sec in February [8]. The White flood is a consequent of flows from local tributaries especially the Sokoto Rima and Malendo river systems. The White flood is heavily laden with silts and other suspended particles (flow lag June to September) and arrives Kainji in August in the pre Kainji Dam River Niger having attained a peak rate of 4,000 to 6,000m3/sec in September October in Jebba. The critical low flow period into the Kainji reservoir is March and July each year Figure 2.
Figure 2: Location of Kainji Hydroelectric Dam, Source [11].

Data collection
The reservoir daily inflow data for twenty five years (1990 2014) were collected from the hydrological unit of Kainji Hydropower station in Nigeria.
Data analysis and classification of reservoir system
The Characterization of the reservoir system was done by employing equation (2) as suggested in [3].
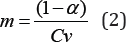
Where m is the resiliency index, CV the coefficient of variation, whereas α is the demand. The resiliency index (m) was determined by taking the ratio of demand subtracted from one and the coefficient of variation (CV); similarly CV was computed by taking the ratio of the standard deviation to the means of the inflows. On the other hand, the demand levels were hypothetically fixed at 0, 0.2, 0.4, 0.6 and 0.8 in line with reservoir boundary conditions (i.e. if 0≤m≤1, the reservoir system is dominated by over year behavior, whereas if m>1) the system is dominated by within year behavior) as recommended in the works of Vogel & Stedinger [5], Sharad [9], Issa et al. [10]. On the basis of this, two reservoir states were identified, (1) within year storage (2) over year storage.
Results
Classification of reservoir system
The result of the reservoir classification or characterization is as presented in Table 1 below.
Table 1: Values of resilience (m), Demand level (α), and Coefficient of Variation (CV) Obtained to characterize the reservoir System.

Table 1 shows the characterization of the reservoir system, the reservoir system is characterised as within year system considering the reservoir characterisation boundary condition that if (m>1) and the coefficient of variation is low, the reservoir is within year system. The resilience indices m increases with reduction in the demand level which depicts that the higher the demand level the less the reservoir resilience [11].
Conclusion
The reservoir system is characterized as within year system indicating the reservoir's high resiliency. The research also shows that the reservoir refills within the year and strongly reliable for water supply for hydropower generation.
References
- Bosona F, Gebresenbet E (2010) Evaluating the human impacts on estuaries water and atmosphere, Niwa Hamilton, US, Army Corps of Engineers (1978) Reservoir Yield Hydrology Eng Center, Davis, California, USA (8): 126-136.
- Kuria FW (2014) Uncertainty analysis of water supply reservoir yield estimates PhD Dissertation, Tufts University, USA, pp. 43-56.
- Vogel RM, Mcmahon TA (1996) Approximate reliability and resilience indices of over-year reservoirs fed by ar (1) gamma and normal flows. Hydrological Science Journal 41(10): 75-96.
- Sudler CE, Hurst (1985) Storage required for the regulation of stream flow. Trans Am Soc Civil Eng 61: 622-660.
- Vogel RM, Stedinger JR (1987) Generalised storage-reliability-yield relationships. Journal of Hydrology 89: 302-326.
- Bolognese RA, Richard MV (1995) Storage reliability resistance yield relations for over-year water supply systems. Water Resources Research 31(3): 645-654.
- Dukiya JJ (2013) Spatial analysis of the impacts of kainji hydropower dam on the down stream communities an overview. A Journal of Geoinformatics & Geostatist 4(4): 105-113.
- Oyebande L, Sagua VO, Ekpenyong JL (1980) The effect of kainji dam on the hydrological regime, water balance and water quality of the river niger. The influence of man on the hydrological regime with special reference to representative and experimental basins Iahs-Aish Publ 130.
- Sharad K, Jain D (2010) Investigating the behaviour of statistical indices for performance assessment of a reservoir. Journal of Hydrology 391(1- 2): 90-96.
- Issa SO, Rozi A, Majid M (2014) The critical period of reservoir systems considering performance indices on Malaysia rivers. International Journal of Engineering & Technology 3(2): 166-173.
- Salami AW (2013) An overview on reservoir operational impact of kainji, jebba on and shiroro dams the environment. Paper presented at the one day seminar on reservoir operation organized by federal ministry of water resources, dams & Reservoir operation department, Nigeria.
© 2017 M Anwar Hossen, et al. This is an open access article distributed under the terms of the Creative Commons Attribution License , which permits unrestricted use, distribution, and build upon your work non-commercially.
Editor In Chief


.jpg)


Signup for Newsletter

Quick Links
 Editorial Board Registrations
 Submit your Article
 Refer a Friend
 Advertise With Us
Our Recent Edition

.jpg)


Top Editors


.jpg)


.bmp)
.jpg)
.png)
.jpg)


.jpg)


.png)

.png)


.png)


Financial Support

Sponsors

Latest e-Books

Latest Video

 a Creative Commons Attribution 4.0 International License. Based on a work at www.crimsonpublishers.com.
Best viewed in
a Creative Commons Attribution 4.0 International License. Based on a work at www.crimsonpublishers.com.
Best viewed in