- Submissions

Full Text
Determinations in Nanomedicine & Nanotechnology
Phenol and Polyphenol Removals in Olive Mill Effluent with Nano-ZnO-Magnetite Composite Via Photocatalysis
Delia Teresa Sponza* and Balaban M
Department of Environmental Engineering, Turkey
*Corresponding author:Teresa Sponza D, Department of Environmental Engineering, Turkey
Submission: May 2, 2019;Published: May 15, 2019

ISSN: 2832-4439 Volume1 Issue1
Abstract
Olive mill wastewater (OMW) contains high concentration of organic matter, acidic pH values, suspended solids and high content of phenols and polyphenols which are toxic substances. The aim of this study is the removals of total phenol and two polyphenols namely tyrosol and hydroxytyrosol in the OMW by Nano-ZnO-Magnetite composite via photocatalytic degradation. For photocatalytic degradation under UV, with the optimum concentration of Nano-ZnO-Magnetite (3mg per liter), maximum 75% total phenol yield, 80% and 51% tyrosol and hydroxytyrosol removals was obtained at an irradiation time of 30 minute and at a UV power of 300W
Keywords: Olive mill effluent; Nano-ZnO-Magnetite composite; Phenol; Tyrosol; Hydroxytyrosol; Photocatalysis
Introduction
Most researchers concentrated their studies on TiO2 as photocatalyst compared to the other metal oxides for the degradation of environmental pollutants [1]. ZnO is better because it absorbs large fraction of the solar spectrum and more light quanta than TiO2 [2]. Researchers have highlighted the performance of ZnO on degradation of some organic compounds [3]. In addition, ZnO has more functions than TiO2 [4]. Recently, researchers have pointed out that ZnO can also be used in the acidic or alkaline conditions through proper treatment [5]. Furthermore, the optimum pH reported for ZnO process is close to neutral value, whereas the optimum pH for TiO2 mostly lies in acidic region. Hence the ZnO process is more economical for the treatment of industrial effluents. ZnO has been reported to be more efficient than TiO2 in some processes such as the advanced oxidation of pulp mill bleaching wastewater [6], the photooxidation of phenol [7] and photocatalyzed oxidation 2-phenyl phenol [8]. In particular, ZnO has attracted much attention with respect to the degradation of various pollutants due to its high photosensitivity, stability and wide band gap. While TiO2 is widely employed as a photocatalyst, ZnO is a suitable alternative to TiO2 as it has a similar band gap energy (3.2eV) [9], with larger quantum efficiency. Higher photocatalytic degradation efficiencies of contaminant dyes have been reported [9]. Therefore, the aim of this study is the removals of total phenol, and two polyphenols (tyrosol and hydroxytyrosol) in the OMW via photocatalytic processes at increasing 3mg/L Nano-ZnO-Magnetite concentration at increasing irradiation times (30min, 60min, 90min, 180min and 240min) and at pH4.
Materials and Methods
Synthesis of Nano-ZnO-magnetite composite under laboratory conditions
Nanoparticle is produced under laboratory conditions and immobilization method is used for this purpose. The magnetite sample was ground and sieved to 200-mesh size, then is washed with demineralized water for 3-4 times. The slurry of magnetite was prepared in water and it was stirred for 1h, kept overnight, filtered under vacuum and the resultant solid cake was exposed to slow evaporation till the completely dry material was obtained. 10g of magnetite was added to a solution containing 2g zinc acetate dihydrate dissolved in 250ml of N, N-dimethyl formamide and the mixture was sonicated for about 3h in order to obtain homogeneous suspension. To this solution, 100ml of 0.1M NaOH/H2O solution was added with constant stirring for 1h. The nanocomposite powder was obtained after successive centrifugation and dispersions in alcohol and the solid mass was dried at 75 ˚C under vacuum incubator for 4h. Then it is calcinated at 200 ˚C for 2-3h in a Muffle furnace. The dried Nano- ZnO-Magnetite nanocomposite was then is used for photocatalytic experimentations.
Analytical methods
A HPLC Degasser (Agilent 1100), a HPLC Pump (Agilent 1100), a HPLC Auto-Sampler (Agilent 1100), a HPLC Column Oven (Agilent 1100) and a HPLC Diode-Array-Detector (DAD) (Agilent 1100) were used for phenol and 2 polyphenol measurements namely tyrosol and hydroxytyrosol determined in the OMW. About 10mg of a standard of phenolic acids (phenol, tyrosol and hydroxytyrosol) was weighed accurately and they were dissolved into volumetric flasks containing 10mL 1:1 MeOH/distilled water to obtain stock solutions. For calibration curves, the stock solution was diluted with 1:4 MeOH/distilled water to obtain the concentration sequence. The linear range and the equations of linear regression were obtained through such a sequence of 50mg/L, 20mg/L, 10 and 5mg/L. Mean areas generated from the standard solutions were plotted against concentration to establish calibration equations. R2 values of calibration graphs of caffeic acid, was found as 0.99.
Photocatalytic reactor and operational conditions
Photocatalytic degradation experiments were carried out in self-designed quartz glass reactors. The dimensions of the reactors were 38 and 3.5cm and the constant power of the UV lamps was 300W. The experiments were performed at room temperature and the pH of the reaction mixture was 4. Photocatalytic experiments were carried out with a known quantity of Nano-ZnO-Magnetite (3mg/l) composite at different irradiations times (30min, 60min, 90min, 180min and 240min).
X-ray diffraction (XRD) analysis
XRD measurements were carried out with the RIGAKU DMax 2200PC. X-ray diffraction were used for the identification of crystalline materials and their structure. Each crystalline solid has its unique characteristic X-ray powder pattern and can be used for the characterization of crystalline properties of materials. Preliminarily, the material was characterized, X-ray crystallography may be used to determine the atom distribution in the crystalline structure and the distance between atoms and angles [10].
Fourier transform infrared (FT-IR)
FTIR spectra were determined using a Perkin Elmer System with a Spectrum of BX. Fourier transform infrared spectroscopy (FTIR) is a technique which is used to obtain an infrared spectrum of absorption, emission, photoconductivity or Raman scattering of a solid, liquid or gas. FTIR spectrometer catch resolution with high spectrum data. This advantage of the spectrometer cause determining the intensity of wavelengths [11].
Results and Discussion
X-ray diffraction (XRD) analysis results
XRD was used to verify the chemical composition and the crystal structure of Nano-ZnO-Magnetite nanocomposite [12]. Figure 1 represents the XRD pattern of Nano-ZnO-Magnetite core/ shell. Considering this figure, it is shown that after coating, we have enhancement in peak intensity which is caused by overlapping of Fe3O4 peaks [13]. No peaks corresponding to the impurities are detected, indicating that Fe3O4-ZnO heterostructure were formed during the photodegradation process [14].
Figure 1:XRD patterns of Nano-ZnO-Magnetite.

FT-IR analysis results
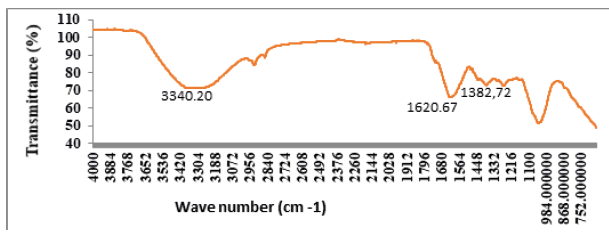
Figure 2 shows the FT-IR spectra of Nano-ZnO-Magnetite. The absorptions at 1395.25/cm and 1591.29/cm are special peaks of the COO-Fe bond. This bond appeared via the hydroxide groups on the outer layer of the magnetite [15]. These peaks reveal that Fe3O4 has been successfully immobilized onto the surface of ZnO. Combining the XRD results, it can be concluded that ZnO had been coated on the Fe3O4, successfully. Therefore, crystal form of Nano- ZnO-Magnetite composite converts the amorphous shape. As a result, the peak number in the Nano-ZnO-Magnetite composite decreases in the amorphous shape.
Figure 2:FTIR spectrum of Fe3O4, ZnO, Nano-ZnO-Magnetite and Nano-ZnO-Magnetite.
Effect of İrradiation times on the removals of phenol in the OMW
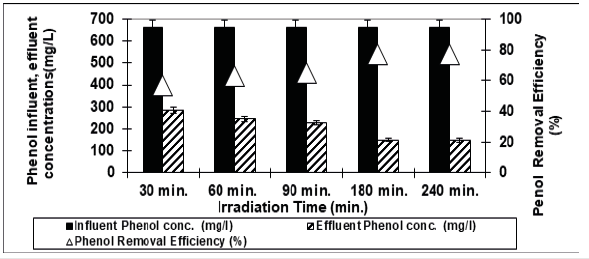
Figure 3 shows the effect of different UV irradiation times (30min, 60min, 90min, 180min and 240min) on photodegradation of phenol at a pH of 4.60 at a temperature of 20 ˚C after at a 3g/L concentration of Nano-ZnO-Magnetite nanocomposite with an UV lamp with a power of 300W. From Figure 3 it can be seen that as the irradiation time were increased from 30min, to 60min, to 90min, and to 180min, the phenol yield increased from 57%, to 63%, to 65%, to 77%, and stabilized to 77%. Further increase of adsorption time to 240min did not increase the phenol yield. The optimum irradiation time can be considered as 180min for the maximum removal efficiency of phenol (77%). The percentage of degradation of phenol was 65.5% under UV light after 150min irradiation time. The phenol degradation was only 52% when pure ZnO was used, which is lower than that in the presence of either Fe3O4-ZnO.
Figure 3:The effect of Irradiation time on phenol yield (Influent Conc.: 660mg/L, T: ±20 ˚C, pH: 4.00, Nano-ZnO-Magnetite concentration: 3g/L, UV power: 300W).
Polyphenol analysis results
According to the results of chromatograms in HPLC analysis, 112.6mg/L concentration of hydroxytyrosol and 172.7mg/L concentration of tyrosol was identified in raw OMW illustrated in Figure 4. In a study investigated by Manouchehr et al. [13] polyphenols were analyzed in the olive oil mill effluents. 115.9mg/L and 50.3mg/L concentration of hydroxytyrosol and tyrosol were found, respectively, and these data are consistent with our results [16].
The results showed that hydroxytyorosl and tyrosol were most abundant phenolic compounds in OMW (Figure 4). Hydroxytyrosol and caffeic acid show a powerful antioxidant activity [16] Hydroxytyrosol inhibits human LDL oxidation, inhibits platelet aggregation and exhibits anti-inflammatory and anticancer properties [17]. Tyrosol showed similar concentrations with hydroxtytrosol in the OMW (Figure 4). Samuel et al. [18] reported that hydroxytyrosol is very effective in preserving cellular antioxidant defenses [18]. By using 3g/L Nano-ZnO-Magnetite nanocomposite with 30 min irradiation time at pH4 and a temperature of ±20 ˚C with an UV power of 300W during photooxidation. The removal efficiencies of tyrosol and hydroxytyrosol were obtained as 80% and 51%, respectively. Their concentrations decreased from 172.7mg/L to 34.8mg/L for tyrosol and from 112.6mg/L to 55.2mg/L for hydroxytyrosol, respectively, after treatment with 3g/L Nano-ZnOMagnetite nanocomposite under 300W UV irradiation after 30min irradiation time (Figure 5); (Table 1).
Figure 4:The concentration of tyrosyl and hydroxytyrosol found in raw OMW.
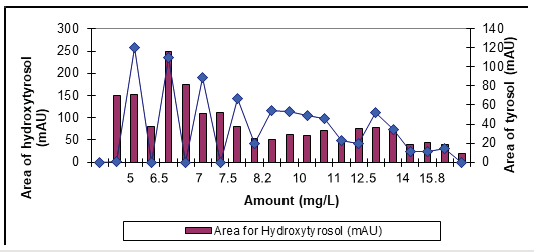
Figure 5:The concentration of tyrosyl and hydroxytyrosol found in treated OMW with UV photooxidation.
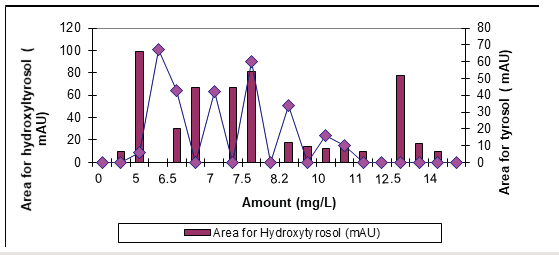
Table 1:Removal efficiencies of polyphenols (tyrosol and hydroxytyrosol) in OMW.

Acknowledgement
The authors thanks to TÜBİTAK - Turkish National Scientific Research Foundation for its financial support to the project.
References
- Mantzavinos D, Kalogerakis N (2005) Treatment of olive mill effluents. Part I: Organic matter degradation by chemical and biological processesan overview. Environ Int 31(2): 289-295
- Komilis DP, Karatzas E, Halvadakis CP (2005) The effect of olive mill wastewater on seed germination after various pretreatment techniques. J Environ Manage 74(4): 339-348.
- Nieto LM, Hodaifa G, Rodríguez S, Giménez JA, Ochando J (2011) Degradation of organic matter in olive-oil mill wastewater through homogeneous Fenton-like reaction. Chemical Engineering Journal 173(2): 503-510.
- Niaounakisand M, Halvadakis CP (2004) Olive-mill Waste Management- Literature Review and Patent Survey. Typothito-George Dardanos, Athens, Greece.
- Roig A, Cayuela ML, Sanchez-Monedero MA (2006) An overview on olive mill wastes and their valorisation methods. Waste Manag 26(9): 960- 969.
- Roostaei N, Tezel FH (2004) Removal of phenol from aqueous solutions by adsorption. J Environ Manage 70(2): 157-164.
- Chen GH, Lei LC, Yue PL (1999) Wet oxidation of high concentration reactive dyes. Industrial and Engineering Chemistry Research 38(5): 1837-1843.
- Kiril Mert B, Yonar T, YaliliKilic M, Kestioğlu K (2010) Pre-treatment studies on olive oil mill effluent using physicochemical, Fenton and Fenton-like oxidations processes. J Hazard Mater 174(1-3): 122-128.
- İnan H, Dimoglo A, Şimşek H, Karpuzcu M (2004) Olive oil mill wastewater treatment by means of electro-coagulation. Separation and Purification Technology 36(1): 23-31.
- Ma P, Xiao C, Li L, Shi H, Zhu M (2008) Facile preparation of ferromagnetic alginate-g-poly (vinyl alcohol) microparticles. European Polymer Journal 44(2008): 3886-3889.
- Griffiths P, De Hasseth JA (2007) Fourier transform infrared spectrometry. (2nd edn), Wiley-Blackwell, Hoboken, New Jersey, USA.
- Hasanpour A, Niyaifar M, Asan M (2012) Synthesis and characterization of Fe3O4 & ZnO Nanocomposites by Sol- Gel Method, Proceedings of the 4th International Conference on Nanostructures. (ICNS4) 12-14 March, Kish Island, Iran.
- Manouchehr N, Mehriana A, Reza L, Mohammad HR (2014) The optimum conditions for synthesis of Fe3O4/ZnO core/shell magnetic nanoparticles for photodegradation of phenol. J Environ Health Sci Eng 12(1):21.
- Vohra MS, Selimuzzaman SM, Al-Suwaiyan MS (2010) NH4 +-NH3 removal from simulated wastewater using UV-TiO2 photocatalysis: Effect of copollutants and pH. Environ Technol 31(6): 641-654
- Nassar NN (2012) Iron oxide nanoadsorbents for removal of various pollutants from wastewater: An overview. In: A Bhatnagar (Ed.), Application of Adsorbents for Water Pollution Control, Bentham Science Publishers, United Arab Emirates.
- Anandan S, Vinu A, Venkatachalam N, Arabindoo B, Murugesan V (2006) Photo catalytic activity of ZnO impregnated Hb and mechanical mix of ZnO/Hb in the degradation of monocrotophos in aqueous solution. J Mol Catal A-Chem 256: 312-320.
- Bouallagui Z, Bouaziz M, Lassoued S, Engasser JM, Ghoul M, et al. (2011) Hydroxytyrosol acyl esters: Biosynthesis and activities. Appl Biochem Biotechnol 163(5): 592-599.
- Samuel SM, Thirunavukkarasu M, Penumathsa SV, Paul D, Maulik NJ (2008) Akt/FOXO3a/SIRT1-mediated cardioprotection by tyrosol against ischemic stress in rat in vivo model of myocardial infarction: Switching gears toward survival and longevity. J Agric Food Chem 56(20): 9692-9698.
© 2019 Delia Teresa Sponza. This is an open access article distributed under the terms of the Creative Commons Attribution License , which permits unrestricted use, distribution, and build upon your work non-commercially.
 a Creative Commons Attribution 4.0 International License. Based on a work at www.crimsonpublishers.com.
Best viewed in


.jpg)


 Editorial Board Registrations
 Submit your Article
 Refer a Friend
 Advertise With Us
.jpg)


.jpg)


.bmp)
.jpg)
.png)
.jpg)


.jpg)


.png)

.png)


.png)


