
- About Us
- Information
-

The Author ensures that the research has been conducted responsibly and ethically with adherence to all relevant regulations. read more..
- For Authors
- For Reviewer
- Manuscript Guidelines
- Membership
- Publication Ethics
-
- Journals
- Reprints
- e-Books
- Videos
- Policies
- Contact Us
 COVID-19
- Submissions


Full Text
Developments in Clinical & Medical Pathology
Determination of Toxic Heavy Metals in Theobromine Using Quadrupole Inductively Coupled Plasma Mass Spectrometry (Q-ICPMS)
Sheth Jateen1, Kumar K Poonam2, Suthar Vaishali3, Lee Jae-won4, Baek Il-Hyun5, Kumar K Santhosh6, Indra Neel Pulidindi6 and Pankaj Sharma3*
1School of Liberal Studies and Education, Navrachana University, India
2Sun Pharma Advance Research Center, India
3Department of Applied Chemistry, Faculty of Technology and Engineering, The Maharaja Sayajirao University of Baroda, India
4Department of Energy Engineering, Republic of Korea
5Greenhouse Gas Center, Korea Institute of Energy Research, Republic of Korea
6School of Science, GSFC University, India
*Corresponding author:Pankaj Sharma, Department of Applied Chemistry, Faculty of Technology and Engineering, The Maharaja Sayajirao University of Baroda, Vadodara-390 001, Gujarat, India
Submission: November 25, 2022;Published: January 06, 2023

ISSN:2690-9731 Volume2 Issue3
Abstract
Theobromine (3,7-dimethylpurine-2,6-dione), is used as vasodilator, a blood vessel widener), bronchodilator, as an aid in urination and as a heart stimulant, asthma and cough. Therefore, it is important to evaluate the biocompatibility of theobromine to ensure the safety of people consuming it. Furthermore, a quick and easy method has been optimized and validated to determine the quantity of heavy metals like V, Co, Ni, Cd, Hg, Pb and As, present in commercial theobromine by using quadrupole inductively coupled plasma mass spectrometry (Q-ICP-MS). The detection limits were between 0.16 and 7.23μg/L and quantification limits were between 1.5 and 60μg/L. The mean recoveries±standard deviations were varied between 83.1±0.5% and 106.7±2.1% and the coefficients of variation were between 0.2% and 3.1%. The method precision, in terms of relative standard deviation, was below 2.23%. The method uncertainty expressed as expanded uncertainty was found to be≤3.6%..
Keywords:Theobromine; Elemental impurities; Class 1 and 2A; Q-ICP-MS; Analytical method validation; Concurrent analysisz
Introduction
Theobromine, also known as Xantheose, a xanthine alkaloid compound bitter in taste, obtained in seeds and leaves of cacao plants as well as in some other foods like tea leaves and kola nut. Theobromine is classified as dimethyl xanthine. Theobromine is consumed by adults and children worldwide daily in the form of chocolates and chocolates containing food products like candies, cakes, biscuits, ice cream, tea, coffee, and beverages due to its flavour, texture and eating pleasure [1-7]. Theobromine, the pharmacologically active substance was ignored by various researchers by stating that it doesn’t stimulate the Central Nervous System (CNS). Theobromine exists in the form of white powder material and is mainly produced from cocoa husks as a by-product of chocolate manufacture. Theobromine is medically applied as a diuretic, a smooth muscle relaxant, a myocardial stimulant, and a vasodilator as well as bronchodilator both. It has been found as a very mild CNS stimulant and it has antioxidant as well as pro-oxidant properties. Theobromine plays an important role in renal thermodynamics, affecting renal blood flow and glomerular filtration rates and useful in dentistry by inhibiting dental caries [8].Theobromine is currently not in use as a medicinal drug due to its low potency but it is used as an intermediate in the manufacturing of pentoxifylline which is used as an Active Pharmaceutical Intermediate (API). But Theobromine has a bright future due to its long history of medical use as a PARP- 1 inhibiting, dental strengthening and antitussive agent indicates that theobromine seeks attention of researchers and after sufficient R&D the medicinal, curative, and preventive properties can be fully explored and it can be widely used different field of medical science [8,9].
Table 1: Impurities classification and specification limits.

Recent development of worldwide awareness on hazardous effect on human health, regulatory and legislative authorities like International Council for Harmonisation of Technical Requirements for Pharmaceuticals for Human Use (ICH), European Medicines Agency (EMA) and United States Food and Drug Administration (U.S.FDA) enforced very strict regulations to ensure that eatable and pharmaceutical products introduced to the market should be effective, safe and have minimum risk on human beings. They also strictly ensure that potentially toxic and harmful elemental impurities present in drug products and ingredients should not beyond the permissible limit by regulatory authorities like WHO, AOAC, USFDA, ICH and USP (Table 1). Values quoted in (Table 1) are calculated considering daily intake of the drug product (formulated using the API under analysis) not more than 10g and oral route of administration using below formula provided in ICH Q3D guideline. Concentration (μg/g)=(PDE(μg/day))/(Daily amount of drug product (g/day)) Option 1 of ICH Q3D quoting common permitted concentration limits of elements across drug product components for drug products with daily intakes of not more than 10 grams considered for calculation of permitted concentration of each element in substance under analysis. The identification and quantification of toxic metals like V, Co, Ni, Cd, Hg, Pb and As involves a lot of complications especially in case of Hg. Despite very high toxicity, Hg is extensively used by various industries to produce several products which are not only used but consumed also by humans and living organisms. Determination of Hg is a challenging task due to its low sensitivity, a smaller number of ions for individual isotopes and loss of the element during digestion process, its volatile nature and during storage in High Density Polyethylene (HDPE) containers. The aim of the present work validate a fast, effective, simple, and accurate method for identification and quantification of seven toxic metals V, Co, Ni, Cd, Hg, Pb and As in theobromine by quadrupole inductively coupled plasma mass spectrometry (Q-ICPMS). The different important parameters like Limit Of Detection (LOD), Limit Of Quantification (LOQ), linearity and working range, accuracy, uncertainty, and precision, of method were evaluated according to ICH Q2(R1) guidelines. As per our information and literature survey, there is no previous report published and no data is available on this topic.
Experimental
Materials and methods
Reagents and solutions:Nitric acid (65%), Hydrochloric acid (37%) and certified reference metal stock standard solutions (1000mg/L) of V, Co, Ni, Cd, Hg, Pb and As prepared in 2-3% HNO3 were purchased of analytical grade from Merck (Darmstadt, Germany). Theobromine sample was generously donated by Mr. Punam Shah on behalf of Bajaj Health Care Pvt. Ltd. Savli, Karachiya, Gujarat. Deionised water was prepared using a Milli-Q plus water purification system from Millipore (Bedford, MA, USA). Yttrium standard for ICP TraceCERT®, 1000mg/L Y in nitric acid, bismuth standard for ICP TraceCERT®, 1000mg/L Bi in nitric acid, gold standard for ICP TraceCERT®, 1000mg/L Au in hydrochloric acid, nitric acid ≥69.0%, TraceSELECT™ for trace analysis from Honeywell were used for the study. All the autosampler vials and glassware’s, centrifuge tubes, plastic bottles, were cleaned by soaking in 20%v/v HNO3 analytical grade reagent for 4h, then after rinsing three times with deionized Milli-Q water. Element impurities according to ICH Q3D, Standard 1 (containing 15 ppm of Arsenic (As), 5ppm each of Lead (Pb) and Cadmium (Cd), 30ppm of Mercury (Hg), 50ppm of Cobalt (Co), 100ppm of Vanadium (V), 200ppm of Nickel (Ni) and other 3 elements i.e., 150ppm each of Selenium (Se) and Silver (Ag) and 8ppm of Thallium (Tl).
Sample preparation
250mg of sample was taken in 50mL polyethylene tube and 0.2mL of 1000mg/L gold standard solution was added and then make up to 25mL with 2% nitric acid to make 10mg/mL sample solution.
Calibration standard preparation
For calibration standard stock solution preparation, according to ICH Q3D, Standard 1 containing 15ppm of As, 5ppm each of Pb and Cd, 30ppm of Hg, 50ppm of Co, 100ppm of V, 200ppm of Ni was diluted to 20mL with 2% HNO3. Then 0.2mL of 1000mg/L gold standard solution was added to each of them, and this stock solution was further diluted as per below table to make different level calibration standards (Table 2).
Table 2:Dilution for calibration standards. 100% level calibration standard solution was used as system check solution and the same was injected periodically to check performance of the system.

Spiked sample preparation
250mg of sample was taken in 50mL polyethylene tube, added amount of calibration standard stock solution as per below table, 0.2mL of gold standard solution and make up to 25mL with 2% nitric acid to make respective level spiked sample solution. In blank, calibration standards, sample blank, samples and spiked samples preparation 0.1mL of internal standard containing 5mg/L each of Yitrium and Bismuth were added to make final concentration as 20μg/L (Table 3).
Table 3:Dilution for spiked sample preparation.

Q-ICP-MS instruments optimization
The quantities of heavy metals were determined by quadrupole inductively coupled plasma mass spectrometry (Q-ICP-MS). Thermo Fisher Scientific, Model: iCAP RQ ICP-MS using Qtegra Intelligent Scientific Data Solution (ISDS) software equipped with Q Cell Collision Reaction Cell, RAPID Lens, with a quartz spray chamber, glass concentric nebulizer, online Internal Standard (ISTD) addition kit, exchangeable skimmer cones. The optimization of Q-ICP-MS is important because the nebulizer gas and make up gas flows should be adjusted to ensure plasma stability. The Q-ICP-MS was allowed to stabilize for 1h and the performance was optimized based on Radio Frequency (RF) power, autotune function in the control software and A tune B solution, the quadrupole ion deflector voltages were optimized to step wise find the settings that maximize signal intensity over the mass range, as well as mass calibration of Li, Co, In, Ba, Ce, Bi and U, sampling depth, argon flow rate, collision cell gas flow rate, lens voltage, sample uptake rate. The instrument was in helium Kinetic Energy Discrimination (He KED) technology mode which allow measurement of all analytes in a single mode. KED mode for analysis of V, Co, Ni, Cd, Hg, Pb and As.
Method validation criteria
Several parameters have been considered and evaluated for the method validation Like Linear Dynamic Range (LDR), method linearity, accuracy, precision, Limit of Detection (LOD), Limit of Quantification (LOQ), and Measurement of Uncertainty (MU). Analytical method validation of Q-ICP-MS for analysis of V, Co, Ni, Cd, Hg, Pb, and As was applied in accordance with ICH Q2(R1).
Q-ICP – MS analysis
The Q-ICP–MS-method used 6 replicate readings of 30 sweeps over the analyte mass-range with a dwell time of 100 μs for each mass per sweep. Sample aspiration followed by rinse program with 2% HNO3 kept for 60s. For running the instrument in KED-mode, 4.34mL min-1 of He gas was used.
Results and Discussion
Role and importance of internal standard in the detection of heavy toxic metals
The choice of an appropriate internal standard while using Q-ICP-MS for elemental analysis is very important since it shows very good impact on accuracy and precision of the result. The main role of internal standards is to stabilize the Q-ICP-MS instrument, rectification, or minimization of non-spectral reversible and irreversible matrix interferences. Non-spectral interferences can be divided in reversible, that is occurring while the sample is being measured, and irreversible matrix effects, that is clogging of the nebulizer and sampling orifices or deposition on the torch or in the ion lens stack. The errors associated with non-spectral interferences can be eliminated by appropriate calibration procedures, adapted sample preparation or limitation of the amount of sample delivered to nebulizer, plasma, and sampling devices, for example by the application of flow injection.
Optimization of Q-ICP-MS parameters
For accurate and correct results various instrumental parameters like torch alignment, the nebulizer gas and make up gas flows, Kinetic Energy Discrimination (KED), lens and mass calibration and resolution, detector voltage, dual detector should be optimized to achieve maximum instrumental performance. The plasma stability and position are most important parameter since this determine the sensitivity of instrument. To ensure this, the nebulizer gas and make up gas flows had to be adjusted. This instrumental requirement has been achieved by adjusting torch position and tuning for reduced oxide and doubly charged formation with a standard tuning solution containing 10ng/g of 7Li, 89Y, 140Ce and 205Tl in 2% HNO3. The various optimized Q-ICP-MS parameters are reported in (Table 4).
Table 4:Typical ICP-MS instruments parameters for analysing samples. aRF: Radiofrequency; bQP: Quadrupole; cOctP: Octupole.

Method validation
Two decades ago, researchers were not completely aware of selectivity and specificity of an analytical method. On many occasions, they were intermixing these two very important terms, selectivity, and specificity. To create an awareness among analytical scientists for analytical methods, J. Vessman, differentiated these two important terms in detail in a report entitled, “Selectivity in Analytical Chemistry (IUPAC Recommendations 2001)”. One very clear definition of selectivity of a method refers to the extent to which it can determine analyte(s) in a complex mixture without interference from other components in the mixture. However, the same meaning has often been given to the term “specificity”. IUPAC clarified this overlap by expressing the view that “Specificity is the ultimate of Selectivity”. This is very important for all researchers who are working in analytical chemistry [10]. Primary isotopes of each element, 51V, 59Co, 60Ni, 111Cd, 202Hg, 208Pb and 75As were used in the present study to investigate the selectivity of the present method. Validation study was performed to determine and establish the reliability of the present method.
Estimated LOD
The term LOD is defined as the lowest concentration at which the instrument can detect but not quantify and the noise to signal ratio for LOD should be 1:3. LOD was estimated from the calibration function using Eq. (1) [11].

where, σ is standard deviation, S is slope derived from the calibration curve.
The estimated LODs were found to be 3.05, 1.66, 7.23, 0.25, 0.82, 0.16, 0.58μg/ L for V, Co, Ni, Cd, Hg, Pb and As, respectively. The minimum practical concentrations of tested elements in the analysed samples, which can be determined with acceptable accuracy (as per USP general chapter 233), were performed by analysing 3 replicates at 30μg/L for V, at 15μg/L for Co, at 60μg/L for Ni, at 1.5μg/L for Cd and Pb, at 9.0 μg/L for Hg and at 4.5μg/L for As, respectively. The results are reported in (Table 5).
Practical LOQ
The term LOQ is defined as the lowest concentration at which the instrument can detect and quantify. Control Threshold values (which is 30% of the PDE of the specific elemental impurity under consideration) as per ICH Q3D (R1) para 5.6 considered for verification as LOQ values and based on successful verification of precision, linearity (from LOQ) and recovery at LOQ level, below values considered as LOQ. The noise to signal ratio for LOQ should be 1:10. The estimated LOQs were found to be 30, 15, 60, 1.5, 9.0, 1.5 and 4.5 mg/ L for V, Co, Ni, Cd, Hg, Pb, and As, respectively. The results are reported in (Table 5).
Table 5:Results of estimated LODs, practical LOQs, and maximum permissible limits number of replicates=06.

Method linearity
According to Magnusson and Ornemark, if the value of calibration curve coefficient of determination (R2) is higher than 0.995, quantification result will be accurate as analytical response will be linear over certain concentration ranges. The method linearity was investigated over specific working range from different concentrations of reference standards [12,13].
Linearity of the calibration curves: The dynamic linear range found to be linear from 30 to 150μg/L for 51V, 15 to 75sup>μg/L for 59Co, 60 to 300μg/L for 60Ni, 1.5 to 7.5μg/L for 111Cd, 208Pb, 9 to 45μg/L for 202Hg and 4.5 to 22.5μg/L for 75As, respectively (Table 5) [14,15].
Method linearity: The method linearity was checked using seven different levels of samples at 0, 3.0, 5.0, 10.0, 15.0, 20.0, 25.0mg/L for 51V, 0, 1.5, 2.5, 5.0, 7.5, 10.0, 12.5mg/L for 59Co, 0, 6.0, 10.0, 20.0, 30.0, 40.0, 50.0mg/L for 60Ni 0, 0.15, 0.25, 0.50, 0.75, 1.00, 1.25mg/L for111Cd & 208Pb, 0, 0.9, 1.5, 3.0, 4.5, 6.0, 7.5mg/L for 202Hg and 0, 0.45, 0.75, 1.50, 2.25, 3.00, 3.75mg/L for 75As, respectively.
Method accuracy
In the context of an analytical method, according to ICH guidelines, accuracy ‘is sometimes termed trueness’. The trueness of an analytical procedure reflects the closeness of agreement between the value that is either accepted as conventional true value or an accepted reference value with the observed value. Therefore, accuracy is an expression of both trueness and precision since both of these influences the result [16]. Accuracy can be measured by spiking the sample matrix with a known concentration of analyte standard and analyzing the sample using the “method to be validated.” The results of the accuracy are presented in (Table 6).
Table 6:Results of accuracy/recovery test of elements.

Precision study - repeatability and reproducibility
Precision of a method is the degree of agreement among individual test results when the procedure is applied repeatedly to multiple samplings [17]. According to ICH [18], precision may be considered at three levels: repeatability, intermediate precision, and reproducibility (Figure 1). The precision was calculated in terms of relative standard deviation (RSD) by Eq. 2 and single estimation of precision uncertainty is calculated by Eq. 3, respectively [11].
Figure 1: Graphical abstract.

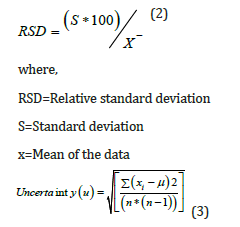
where,
xi=ith reading in the data set
μ=Mean of the data set
n=Number of readings in the data set
The results of repeatability test expressed as RSD were found to
be 2.15%, 1.07%, 1.36%, 2.16%, 2.23%, 2.01% and 1.95% for 51V,
59Co, 60Ni, 111Cd, 202Hg, 208Pb and 75As, respectively. The results of the
precision study are presented in (Table 7) and Linear regression
analysis results are reported in (Table 8).
Table 7:Results of precision test of elements.

Table 8:Linear regression analysis.

Estimation of measurement uncertainty
According to S L R Ellison and A Williams (Eds). Eurachem/CITAC guide: Quantifying Uncertainty in Analytical Measurement, Third edition, (2012) ISBN 978-0-948926-30-3. available from www. eurachem.org., the term uncertainty (of measurement) is defined as “A parameter associated with the result of a measurement, that characterizes the dispersion of the values that could reasonably be attributed to the measurand”. There are various contributing factors like weighing of samples, sample and standard preparation, instrumental measurements, linearity measurement, laboratory repeatability and reproducibility. The expanded uncertainty was measured by multiplying the combined uncertainty, by using a coverage factor (k) of 2, at confidence level of 95% (Figure 2). The measurement uncertainties expressed as expanded uncertainties were estimated to be 10.18, 4.98, 19.69, 0.48, 3.03, 0.50 and 1.60mg/L for V, Co, Ni, Cd, Hg, Pb and As, respectively. The results of uncertainty of each element are presented in (Table 9).
Figure 2:Method linearity (a) V (3.0-25.0mg/L), (b) Co (1.5-12.5mg/L), (c) Ni (6.0-50.0mg/L), (d) Cd (0.15-1.25mg/ L), (e) Hg (0.9-7.5mg/L), (f) Pb (0.15-1.25mg/L) and (g) As (0.45-3.75 mg/L).

Table 9:Result of uncertainty tests of elements.

Bias study (recovery test)
The spiking levels used for recovery test were at 30, 100 and 150μg/L for 51V, 15, 50 and 75μg/L for 59Co, 60, 200 and 300μg/L for 60Ni, 1.5, 5 and 7.5μg/L for 111Cd, 208Pb, 9, 30 and 45μg/L for 202Hg and 4.5, 15 and 22.5μg/L for 75As, respectively. The mean recoveries±standard deviations at different levels varied between 83.1±0.5% and 106.7±2.1% with coefficient of variation expressed as relative standard deviation (RSD) were varied between 0.2% and 3.1% [19,20]. The results of recovery test are presented in (Table 6).
Conclusion
Table 10:Comparison of uncertainty statistics in three different commercial samples.

A Q-ICP-MS technique was used to validate the analytical method for simultaneous determination and quantification of seven toxic metals V, Co, Ni, Cd, Hg, Pb, As in theobromine (Table 10). The accuracy of the present method is (30-150% of target value) and precision value (n=6) were successfully achieved the criteria defined by WHO, AOAC, USFDA, ICH and USP 232/233. The validated method has been successfully evaluated in terms of LOD, LOQ, linearity, repeatability, reproducibility, accuracy, and precision. The proposed validated method is very simple, quick, easy, cost effective and reliable; therefore, it can be very useful for quantification of these toxic metals in routine laboratories analysis.
Acknowledgement
The help of Mr. Punam Shah, Bajaj Healthcare Private Ltd, Vadodara, Gujarat, India is gratefully acknowledged for providing three commercial samples of theobromine.
References
1. Lo dico GA, Galvano F, Dugo G, D’ascenzi C, Macaluso A, et al. (2018) Toxic metal levels in cocoa powder and chocolate by ICP-MS method after microwave-assisted digestion. J of Food Chem 245: 1163-1168.
- Vītola V, Ciprovica I (2016) The effect of cocoa beans heavy and trace elements on safety and stability of confectionery products. Rur Sust Res 35(330): 19-23.
- Dias ARM, Wickramasinghe I (2013) Determination of toxic metals in chocolate confectionery wrappers used by the chocolate manufacturers in Sri Lanka, and it’s migration to chocolates under different storage conditions. Int J of Sci and Res 5(1): 2319-7064.
- Aculey PC, Snitkjaer P, Owusu M, Bassompiere M, Takrama J, et al. (2010) Ghanaian cocoa bean fermentation characterized by spectroscopic and chromatographic methods and chemometrics. J of Food Sci 75(6): 300-307.
5. Devi P, Bajala V, Garg VK, Mor S, Khaiwal R (2016) Heavy metal content in various types of candies and their daily dietary intake by children. Env Monit Assess 188(2): 86.
- Mohammed AI, Ahmed AA, Lot T. Solomon M (2020) Assessment of some heavy metals in some chocolate brands and bread sold in maiduguri. borno state nigeria. Mat Sci Res J 2(4): 71-75.
- Prakash P, Rajan G, Elavarasi V, Priyadharsani TKP, Thamaraiselvi K (2014) Assessment of heavy metal contamination (nickel and arsenic) using GF-AAS in local brand chocolates and candies from Tiruchirappalli. India Int J of Comp App, p. 25.
- Fredholm BB (2011) Handbook of experimental pharmacology; springer-verlag berlin heidelberg, Germany.
- (1991) International Agency for Research on Cancer (Iarc) World Health Organisation (WHO), Iarc Monographs on the Evaluation of Carcinogenic Risks to Humans, Coffee, Tea, Mate, Methylxanthines and Methylglyoxal.
- Vessman J, Stefan RI, Van staden JF, Danzer K, Lindner W, et al (2001) Analytical chemistry divisioncommission on general aspects of analytical chemistry . Pure Appl Chem73(8): 1381-1386.
11. Mohamed R, Zainudin BH, Yaakob AS (2020) Method validation and determination of heavy metals in cocoa beans and cocoa products by microwave assisted digestion technique with inductively coupled plasma mass spectrometry. Food Chem 303: 1-6.
- Cameán AM, Jos A, Calleja A, Gil F, Linares AI, et al. (2014) Development and validation of an inductively coupled plasma mass spectrometry (ICP-MS) method for the determination of cobalt, chromium, copper and nickel in oral mucosa cells. Microchem J 114: 73-79.
- Ghuniem MM, Khorshed MA, Souaya ER (2019) Method validation for direct determination of some trace and toxic elements in soft drinks by inductively coupled plasma mass spectrometry. Int J of Env Anal Chem 99(6): 515-540.
- Perelonia KBS, Benitez KCD, Banicod RJS, Tadifa GC ,Cambia FDU, et al. (2021) Validation of an analytical method for the determination of cadmium, lead and mercury in fish and fishery resources by graphite furnace and cold vapor atomic absorption spectrometry. Food Control 130: 108363.
15. Webster AB, Ganswindt A, Small C, Rossouw R (2021) Optimised ICP-MS quantification method for using animal faeces as a measure of protected area ecosystem health. Methods X 8: 101441.
- ICH Topic Q2 (R1) (1995) Validation of analytical procedures: text and methodology. European Medicines Agency, CPMP/ICH/381/95, Netherlands.
- (1994) International Organisation for Standardisation ISO 5725-6 accuracy (trueness and precision) of measurement methods and results –part 6: use in practice of accuracy values. Iso org geneva, Switzerland.
- (2005) ICH Harmonised Tripartite Guideline, Validation Of Analytical Procedures: Text and Methodology, Ich Working Group.
19. Gu X, Zhu S, Yan L, Cheng L, Zhu P, et al. (2021) Development of a sample preparation method for accurate analysis of 24 elemental impurities in oral drug products by ICP-MS according to USP/ICH guidelines. J Anal At Spectrom 3: 512-517.
20. Patidar R, Rebary B, Bhadu GR, Patel G (2020) ICP-MS method development and validation for determination of trace elemental impurities in caustic potash. Int J of Mass Spect 454: 116356.
© 2023 Pankaj Sharma. This is an open access article distributed under the terms of the Creative Commons Attribution License , which permits unrestricted use, distribution, and build upon your work non-commercially.
Editor In Chief


.jpg)


Signup for Newsletter

Quick Links
 Editorial Board Registrations
 Submit your Article
 Refer a Friend
 Advertise With Us
Our Recent Edition

.jpg)


Top Editors


.jpg)


.bmp)
.jpg)
.png)
.jpg)


.jpg)


.png)

.png)


.png)


Financial Support

Sponsors

Latest e-Books

Latest Video

 a Creative Commons Attribution 4.0 International License. Based on a work at www.crimsonpublishers.com.
Best viewed in
a Creative Commons Attribution 4.0 International License. Based on a work at www.crimsonpublishers.com.
Best viewed in