
- About Us
- Information
-

The Author ensures that the research has been conducted responsibly and ethically with adherence to all relevant regulations. read more..
- For Authors
- For Reviewer
- Manuscript Guidelines
- Membership
- Publication Ethics
-
- Journals
- Reprints
- e-Books
- Videos
- Policies
- Contact Us
 COVID-19
- Submissions


Full Text
Developments in Anaesthetics & Pain Management
For Severe Traumatic Brain Injury, Thermoregulation Contributes to Controlling Cerebral Perfusion Pressure in Only 50% of Cases, Irrespective of Anesthetic Agent
Hermann Prossinger1*, Hubert Hetz2, Alexandra Acimovic2, Reinhard Berger2, Karim Mostafa3, Alexander Grieb3 and Heinz Steltzer2,3
1Department of Evolutionary Biology, University of Vienna, Austria
2Department of Anaesthesiology and Intensive Medical Care, Trauma Center Vienna, Meidling, Austria
3Faculty of Medicine, Sigmund Freud Private University, Vienna, Austria
*Corresponding author:Hermann Prossinger, Department of Evolutionary Biology, University of Vienna, Vienna, Austria
Submission:September 15, 2022;Published: October 20, 2022

ISSN: 2640-9399 Volume2 Issue3
Abstract
Traumatic Brain Injury (TBI) is a serious injury of the brain, caused by blunt forces to the cranium (as, for example, in traffic accidents). Severe TBI is life-threatening and clinicians in Intensive Care Units (ICUs) strive to avert death, minimize long-lasting damage, and enable the restoration of as many brain functions as possible post release from the ICU. In TBI patients, the difference between Mean Arterial Pressure (MAP) and Intracranial Pressure (ICP) should be above a threshold in order to maintain adequate oxygen supply to the damaged brain. One possible intervention to achieve this involves thermoregulation, often via hypothermia: cooling the body so as to increase the temperature gradient between oxygen-supplying blood and the febrile, damaged brain. Here, we investigate whether (or: to what extent) this strategy is successful, not restricting ourselves to cases of hypothermia alone.
Our analysis of the 5 vital parameters MAP, ICP, TEMP (core body temperature), etCO2 (end-tidal Carbon Dioxide, a proxy for oxygen metabolism) and HR (heart rate) of 32 TBI patients during their stay in an Intensive Care Unit (ICU) showed that relying on TEMP values for thermoregulation is not warranted.
We discovered that the above parameters are interdependent, and TEMP is not a predictor in 50% of the 12 models that were eligible as predictor models (5 further models were also examined and were excluded for statistical reasons). We also considered the possibility that the reliability of TEMP as a predictor may depend on the anesthetic agent (15 patients were administered propofol; 17 patients sevoflurane; assignment was random); we found that the unreliability does not depend on the anesthetic used. Because the interdependence of vital parameters is so high, we conclude TEMP should not be used as a predictor variable.
Keywords: TBI (Traumatic Brain Injury); ICP (Intracranial Pressure); CPP (Cerebral Perfusion Pressure); Thermoregulation; Propofol; Sevoflurane; KDE (Kernel Density Estimation) algorithms; AICc (Akaike’s Information Criterion)
Introduction
Traumatic Brain Injury (TBI) occurs when blunt forces to the cranium accelerate/
decelerate the brain, resulting in mechanical insults that cause a host of disruptions to this
highly complex organ, both on a macroscopic scale (for example: cerebrovascular structures)
and on a molecular processes scale (for example: a shift towards anaerobic metabolism).
Worldwide, the mortality rate for severe TBI is ~40% (3.0-3.6 million deaths), irrespective of
age [1]. The disruptions from TBI lead to dysfunctions [1], such as a reduction in Mean Arterial
Pressure (MAP) and an Increase In Intracranial Pressure (ICP). Maintaining an adequate
difference between MAP and ICP, called Cerebral Perfusion Pressure CPP (CPP=MAP-ICP) in
TBI patients during their stay in an Intensive Care Unit (ICU) is a
primary concern for clinicians caring for them [1-4]. Only if CPP is
high enough can an adequate rate of oxygen supply to the brain be
maintained [2]. Two issues are:
A. What treatment strategies are available? and
B. Which of these treatment strategies can be employed?
The brain functions optimally when there is a slight temperature gradient between brain temperature and core (body) temperature TEMP [2-5]. ICU clinicians infer (via TEMP) the frequent occurrence of elevated brain temperature in TBI patients, occasionally ascribing it to a fever [5-7]. The elevated brain temperature reduces the cooling ability via the cerebral blood flow and, it can be argued, increases ICP. The challenge is to reduce ICP so that CPP is high enough (the recommended level is above 60mm Hg [3,8] to ensure adequate oxygen supply to the (damaged) brain. One possible intervention strategy is to lower TEMP, thereby increasing the temperature gradient, hoping that this will improve the cooling of the brain and, in turn, expecting that this cooling will reduce ICP. Another strategy could be to increase the cerebral blood flow, perhaps by moderately increasing the Heart Rate (HR). One publication [9] deals with the possibility that the thermoregulatory centers in the hypothalamus may be resistant to such strategies. It is hypothesized that these centers may, via feedback cycles, counter-react to the clinician’s intervention by changing other processes so that the brain is forced to return to its previous (unhealthy, precarious) state.
We know of no publication that has shown how to externally drive these thermoregulatory centers into a desired state of (chaotic) equilibrium. We approach this physiological issue in TBI patients by investigating phenomena that may indicate that there is indeed an underlying mechanism which potentially frustrates several intervention strategies, primarily those listed above. Further details are presented below.
This paper investigates two topics that relate to the issue of maintaining CPP at a high enough level [2]. One topic is the question whether there is an observed difference in thermoregulatory interventions when propofol or sevoflurane is used as an anesthetic agent. The other is whether there exist vital parameters (in statistical parlance: predictors) for CPP as a dependent variable that might perhaps help clinicians maintain it at, or above, the recommended level. While TBI patients are being treated, clinicians monitor many vital parameters, intervening wherever necessary [2,4,10]. Some studies have researched whether controlling other vital parameters in addition to temperature-in particular oxygen metabolism [11-13] can prevent ICP from rising above safe levels [14].
Consequently, this paper investigates (1) whether-and, if yes, how-CPP and other vital parameters interdepend or (2) CPP depends on only some or all vital parameters as predictors. In the first case, all vital parameters interdepend with no single one dependent on the others; in the second case, CPP is predicted by other vital parameters. Not only do we analyze putative interdependencies, but we also investigate which-if any-vital parameters model dependencies of CPP on predictors (namely each vital parameter individually) and then calculate various algebraic combinations (including algebraic products, often called interactions). CPP implies a linear combination of MAP and ICP, so neither MAP nor ICP can be included in the modelling. If the vital parameters as predictors are not interdependent, then the inclusion of interaction terms must exhibit a superior predictability. We test such predictions.
We also look at the distribution of CPP entries, patient by patient, in order to quantify differences-if there are any-in modes and expectation values and test whether such differences are due to administering propofol or sevoflurane as anesthetic agents. Finally, we look for those interdependencies that must be excluded from the analysis because they are attributable to statistical noise.
Materials and Methods
Patients
32 patients treated for TBI in an ICU were included in this study: 6 females and 26 males. For each patient, the date of birth, the date and time of the event that led to TBI, as well as the time of release from the ICU (the latter two to the nearest hour) were registered. The age of each patient at the time of the TBI event was calculated to the fraction of a day, using an algorithm that implements the Gregorian calendar. These ages were then converted to centuries, scaling ages to the interval 0-1. Likewise, each patient’s Length of Stay (LoS) in the ICU was calculated to the nearest 1/4 day. LoS varied considerably Figure 1 & 2. However, as elaborated in the Discussions section, the variability of LoS among patients is of lesser concern because in this paper we analyze dependencies patient by patient. Patients’ attributes, such as (biological) sex, age ranges in fractions of years, ranges of LoS in the ICU, etc. are listed in Table 1.
Table 1:Patient data. The age of each patient at the time of the event that led to a TBI has been calculated to the nearest day, using date of birth, date of TBI event and a Gregorian calendar algorithm. Ages for each (biological) sex are Beta distributed, as are the ages with both sexes combined. Maximum likelihood ratio and Wilks’ Theorem shows that it is improbable that the male and female samples are drawn from different (statistical) populations. Hence the males together with the females can be considered a homogeneous sample for the analyses in this paper. Because the ML Beta distributions are asymmetric about the mode, we use the ±34.1%-quantiles about the mode to estimate the uncertainty of the mode. Expectation is the expectation value of the ML Beta distribution for patient ages of each sex.

Figure 1:A grid showing the duration (length of stay, LoS; d…days, h…hours), the number of complete quintuples (‘registrations’), the number of missing registrations, the fraction of missing registrations, as well as the fraction (in %)λ21/λ11 +λ22 +λ23 +λ24 of the square of the Frobenius norm explained by the first singular value. The patients with a large fraction of missing quintuplets have an about one-week length of stay; this is an indication that these patients had a need of many interventions with a non-registration as a consequence. The fraction of the square of the Frobenius norm explained by the first singular value ranges from 97.9% to 99.6%.

Figure 2:The 32 CPP samples and the modes of their ML distributions that have been analyzed in this paper. Data for patients treated with sevoflurane are color-coded brown with gray background, those with propofol blue with pale yellow background. The red vertical lines with orange background mark the ranges when the registrations are less than 60mm Hg; the percentages labeled in red are the percentages of the registrations when CPP was less than 60mm Hg for the patient during his/her stay in the ICU (mean percentages in Table 2). The short horizontal lines show the modes of the distributions of CPP for each patient; these are drawn as stacked in the pastel blue rectangle on the right, which includes the boxplot. It is visually evident that the distributions of modes overlap and therefore there is no significant difference between CPP modes for patients treated with propofol versus those treated with sevoflurane; indeed, a rigorous statistical test shows there is no significant difference (result of log-likelihood test in Table 2).

Patients arriving at the emergency room were alternately assigned to propofol or sevoflurane. Since emergency room admissions (no two of them were on the same day) depended on external events (such as, but not restricted to, traffic accidents), the assignment to either of the two anesthetic agents must be considered to be adequately random [15-20].
Measurement of vital parameters
For each patient, the five vital parameters MAP, ICP, TEMP, etCO2, and HR were registered at the beginning of their stay in the ICU and thereafter every 1/4 day (6am, noon, 6pm and midnight). TEMP was measured by using a RüschTM sensor (Teleflex Medical, Ireland) with a catheter for urinary drainage. ICP was measured with a Spiegelberg parenchymal catheter utilizing an air bladder technology (Spiegelberg GmbH & Co.KG, Hamburg, Germany). MAP and HR were measured using the MIRUS System [20]; etCO2 was measured with an Option Capnoplus*/CO2** device (Drägerwerke AG & Co, KGaA, Lübeck, Germany). The data was stored in a data management system (PDMS COPRA®). Occasionally, when one of a patient’s vital parameter registrations is missing (most often due to a patient being in an operating theater); the quintuple is incomplete. For the subsequent analysis, we excluded incomplete quintuples. The grid Figure 1 shows each patient’s number of registrations as well as his/her number of incomplete quintuples. For the analysis of interdependencies, the gaps do not matter, because the entries are indexed in the matrix matP (see Appendix); one matrix for each patient P.
Statistical metho
The methods of analysis we use in our investigations necessitate a toolkit of advanced statistics. Although all statistical tools we used are well established and their descriptions have been published [16,17], reading these sources is challenging as they include detailed mathematical formalisms. We therefore supply an Appendix with a simplified description of these tools.
Test for homogeneity of the sample
We use Maximum Likelihood (ML) methods [18,19] to estimate the most likely Beta distributions of patient ages, by each sex separately and by sexes combined, in order to test whether the sample of patients is sufficiently homogeneous. If so, our sample of TBI patients can be considered as a sampling from one statistical population [15].
Comparing anesthetic agents: propofol versus sevoflurane
Patients were either sedated with propofol or with sevoflurane. Fully aware of published findings that contribute to the debate [21- 24] as to which is the more advantageous anesthetic agent and which has potential drawbacks, we compare all interdependencies of the vital parameters CPP, TEMP, HR, and etCO2 (end-tidal Carbon Dioxide, as a proxy for cerebral oxygen metabolism)-patient by patient during their stay in an ICU. We then investigate whether there is some distinguishing aspect between those patients that have been anesthetized with propofol versus those with sevoflurane.
Distribution tests
For each patient, we calculate the CPPs from the registered MAPs and ICPs and look for the Most Likely Distribution (ML distribution), its mode and its expectation value. We then find the ML distributions of the modes for patients treated with propofol and modes for those treated with sevoflurane. We use the maximum likelihood ratio test and Wilks Theorem [15,18,25,26] to find the probability that the distributions of modes have been drawn from one population or two statistically distinct ones. We repeat the above analysis for LoS, likewise comparing propofol patients with sevoflurane patients. Interdependencies of vital parameters. Each patient’s vital parameters were scaled; we calculated the SVD (singular value decomposition; [27]) of the patient’s data matrix matP. The singular values were used to statistically estimate interdependencies and the extent of statistical noise.
Models predicting CPP
If CPP depends on other vital parameters, CPP must be some function (here: polynomial) of these. We regressed 17 polynomials with various combinations of the other vital parameters as predictors. We used AICc (Akaike’s Information Criterion, corrected for finite sample size; [28,29]) to determine which model had the most predictive power without modelling noise and to prevent overfitting [30].
Bayesian probability for predictor models per anesthetic agent
As shown in the Results section, not all models of CPP with minimum AICc included TEMP as a predictor. The counts of how many models do and how many do not are the parameters in a Beta distribution of the Bayesian probability. We construct a confusion matrix (true versus false positives, see Appendix) derived from these distribution parameters; one for propofol, one for sevoflurane. We find the ML Beta distribution of LoS for each anesthetic agent. We use KDE (kernel density estimation; see Appendix) to estimate two non-parametric pdfs in 2D (TEMPMAX versus time of TEMPMAX); one for propofol, one for sevoflurane. We use the same Bayesian analysis to determine the confusion matrix of whether the TEMPMAX versus time of TEMPMAX depends on which anesthetic agent was administered.
Results
Modes of CPP
Table 2 lists the frequencies of ML distributions of CPP registrations for each patient; modes are graphically displayed in Figure 2 Only a small fraction (propofol: 26.7%; sevoflurane: 17.6%) of CPP registrations is symmetrically distributed about the mode. The 15 modes for propofol and the 17 modes for sevoflurane are each Beta-distributed, albeit with different parameters α and β (Table 2). The log-likelihood ratio test, together with Wilks’ Theorem, shows that the probability that the modes are drawn from the same population is reasonably high, namely 9.1%-indicating that the modes for propofol and for sevoflurane are not significantly different. (Note, however: one publication [31] rejects choosing a specific significance level, preferably choosing none at all). We conclude that the modes of registrations of CPP for the patients do not depend on whether they were treated with propofol or with sevoflurane.
Table 2:The distributions of CPP registrations of TBI patients, depending on whether they were treated with propofol or with sevoflurane, together with the mean percentage of registrations below 60mmHg. For both anesthetic agents, most (more than half) CPP registrations were log-normally distributed. The modes of the modes (Figure 2) were Beta distributed, yet the modes of these Beta distributions were not significantly different.

Interdependencies of the vital parameters
We exemplify the results of SVD-1 smoothing by displaying the outcomes for Patient No. 17 and No. 30 (Figure 1, Figure 3a & Figure 3b). The fractions of the squares of the Frobenius norms Figure 1 explained by SVD-1 smoothing are 99.2% and 99.3%, respectively. The local spikes and local minima of the variability of the vital parameters CPP, TEMP, etCO2 and HR are partially suppressed by the smoothing. We postulate that the differences between the observed registrations and the SVD-1 smoothed values are arguably attributable to noise (to some extent) but most likely attributable to clinicians’ interventions shortly before, or at, an anticipated imminent steep increase or decrease. In any case, the deviations from smoothing are very small (0.8% overall), despite their deceptive largeness in the graphs.
The visual inspection of the graph is only suggestive, as we have smoothed the scaled vital parameter registrations; consequently, the unscaled peaks appear exaggerated. We have neither smoothed MAP nor ICP directly, as they are not linearly independent; only CPP has been included in the smoothing. This procedure has been adopted because SVD ensures that none of the four vital parameters is a predictor of the other three. In Patient No. 17 Figure 3a and Patient No. 30 Figure 3b, ICP stays below the 13 to 20mm Hg threshold [32] throughout their stay in the ICU. A comparison of spike behavior of CPP (raw values) occurring in these two patients shows that some of these spikes occur along with spikes in other vital parameters-yet not always. As we elaborate below, using the results provided by multi-variable regression machinery Table 3, this spike behavior indicates that there is no single vital parameter that always predicts spikes in CPP.
Table 3a:Listing of the 17 predictor models for CPP as a dependent variable. (a) The models that include temperature (TEMP) as one of the predictors have been highlighted with a gray background; for these, the Model Nos. and their frequencies of occurrence are in bold typeface. AICc is needed to determine which model minimizes the Kullback-Leibler distance, as well as to prevent overfitting [30]. Based on this analysis, five models are excluded (Nos. 4, 6, 7, 14, 15) and three are sparse models of patients’ CPP response with only one predictor. (b) The coefficients ak are estimated using oLSq regression. Eight (out of 15, 53.3%) patients treated with propofol had a CPP response independent of temperature, and seven (out of 17, 42.2%) patients treated with sevoflurane did. The confusion matrix (see text) shows that these differences are not significant.

Table 3b:

Figure 3:The progression in time of the vital parameters for (a) Patient No. 17 and (b) Patient No. 30 during their stay in the ICU. The green rectangle shows the region where CPP is considered satisfactorily high by clinicians (above 60mm Hg; [2]); the pale red rectangle shows the region where intervention is warranted. The gray band marks the region where ICP is in the region of surpassing intervention threshold (between 13mm Hg and 20mm Hg; [32]). All ordinate values are in actual units of registration; the results of SVD-1 of the scaled entries in the data matrix (yielding the smoothed polygons) have been rescaled back for these graphs. The fluctuations above and below the SVD-1 smoothed polygons are, we argue, random fluctuations or results of clinicians’ interventions. The SVD-1 smoothing shows how the vital parameter scores move almost in ‘parallel’; this is the consequence of only the first singular value being significant (compare Figure 1). (a) For Patient No. 17; only two gaps (midnight from Day 8 to Day 9 and also midnight from Day 9 to Day 10) occur. ICP spikes above threshold have not been observed, so spikes in CPP occur in phase with spikes in TEMP, HR and etCO2. The SVD smoothing shows, however, that clinicians’ interventions have successfully controlled the events that have led to these spikes; they disappear within less than two days. (b) Patient No. 30; three gaps occur (Figure 1, row 4): two at the beginning of stay in the ICU and one at midnight from Day 3 to Day 4. The temporal progression of raw ICP shows that clinicians’ interventions are not based on ICP levels exceeding threshold. We note that frequently very high CPP events occur along with local peaks in TEMP and HR (indicating that surges in TEMP are not the sole predictor of surges in CPP), and the time progressions of smoothed CPP almost parallels that of smoothed HR.

Predictor models
Table 3 & Figure 4 show which models are the most likely models that predict CPP as a dependent variable. Of the 17 models for 32 patients: (a) only 9 patients (28.1%, roughly one fourth) have TEMP as a sole predictor of CPP; (b) 15 patients (46.9%, slightly less than one half) do not have TEMP as a predictor. Although CPP could not be best predicted for all patients by including TEMP, no single other vital parameter was a superior predictor of CPP (Table 3).
Figure 4:The calculated posterior likelihoods of the Bayesian probability s that TEMP alone or an algebraic expression involving TEMP is a predictor for CPP. One likelihood curve is for propofol, the other for sevoflurane. The most likely probability that TEMP is included in the predictor model for propofol is 47%; for sevoflurane it is 58%. These deviations from 50% are insignificant, however, as demonstrated by the large areas of false attributions (false positives) for each anesthetic agent. The confusion matrix shows that models that include TEMP as a predictor insignificantly differ with the choice of anesthetic agent; furthermore, the probability of predictor models that include temperature deviate insignificantly from pure chance (50%).

Independence of models on choice of anesthetic agent
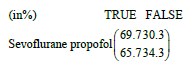
Of the 15 patients treated with propofol, models for 7 patients (46.7%) included TEMP as a predictor variablene, 10 models (58.8%) included TEMP as a predictor variable (Table 3b). The confusion matrix below (derived from Figure 4) is evidence that the predictor models that include temperature for sevoflurane and those for propofol are not significantly different:
In summary, the best predictor models for CPP (for 17 out of 32 patients: 53.1%) include temperature as a predictor, but they are not significantly different regarding the use of propofol versus sevoflurane as an anesthetic agent. There is no significant difference between the distributions of patients’ LoS dependency on the applied anesthetic agent (Table 4; Figure 5). Furthermore, the bivariate non-parametric distribution (estimated via KDE) of maximum core body temperature (TEMPMAX) versus the time when TEMPMAX occurred during the patient’s stay in the ICU Figure 6 shows no significant difference between the anesthetic agents, as evidenced by the confusion matrix.
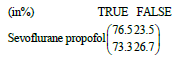
Figure 5:The probability density distributions, the boxplots and the rug plots of propofol (blue) and sevoflurane (brown) of LoS (in days). Some of the small vertical lines of the rug plots have a multiplicity (Figure 1). The mode of LoS for propofol and sevoflurane are projected as dashed lines onto the boxplots; these modes are always less than the medians and the expectation values (Table 4). The ML distributions are not significantly different (sig > 29% Table 4).

Figure 6:A contour plot resulting from using KDE (kernel density estimation) of the maximum TEMP observed versus the time when it occurred. Color-coded contours show constant pdfs. The comparable, observed scatter indicates that there is no significant difference between the contour plots for the two sedation substances. The confusion matrix confirms this observation. Regression would only be permissible if one assumes that the time of the occurrence of TEMPMAX is a predictor of TEMPMAX; it clearly isn’t (the residuals would have to be much smaller).

Table 4:The point estimators for the length of stay of the patients, depending on whether they were administered propofol or sevoflurane. Apart from the maxima and minima, the displayed estimators have been calculated using the ML distributions (which are Beta distributions; Figure 5), not the raw data (furthermore, we note that modes can never be estimated from raw data). Wilks shows that the probability that the two samples have been drawn from the same statistical population is high; in other words, the ML distributions are not significantly different, implying that length of stay is independent of the anesthetic agent administered.

Discussion
Relevance of statistical methods
An issue of utmost importance when comparing effects in medical fields is the issue of randomness in assigning a patient to either one or another group [19]. Strictly speaking, TBI patients cannot be assigned randomly, as this would require close to infinitely large sample sets. Therefore, the more appropriate question is whether a pseudorandom assignment is sufficiently random for an analysis. In our case, the issue of sufficient randomness is moot; since we do not detect any significant differences in the two patient groups, it does not matter whether randomization is adequate [15,33]. We do, nonetheless, argue that alternately assigning patients to each group by the sequence in which they were admitted to the emergency room after a TBI event is very close (indeed: adequately close) to being pseudorandom [15]. Furthermore, the argument about adequate randomness is only relevant when discussing whether putative differences between the two anesthetic agents include sufficiently small entries in the off-diagonal of the confusion matrix.
Communicating null results is difficult (especially in a way
that will satisfy peer reviewers). We challenge any objection that
suggests we have not found an effect because we did not use
the appropriate analysis. We address why such objections are
unwarranted in our subsequent arguments. SVD is a method that
is a blanket method; if there is an effect that separates groups, it
will be detected, albeit not necessarily in a graphical rendition.
We also showed that we investigated more predictor models
than needed (arguably far more than suspected by clinicians) and
therefore discovered, using AICc, that some (five out of seventeen
models, 29.4%; Table 3) were to be eliminated; they were clinically
irrelevant for our TBI patients. The methods we applied are deeply
investigative; we insist that our claim that the lack of an effect
between using propofol versus using sevoflurane is rigorously
supported.
There are two reasons why scaling the parameters is necessary
A. Pending numerical analysis, the units of registrations may not
be included in the random variable realizations being analyzed
with statistical methods, and
B. The numerical ranges of the scaled registrations should be
comparable, because many numerical algorithms (also the
ones used in this paper) include calculations of squares of
realizations and large discrepancies would suppress the
contributions of some or many other realizations. We suspect
that several inconsistencies in published findings may be
due to inappropriate scaling or outright absence thereof. In
any case, the mean of a sample, being a good estimator of the
expected value of the distribution from which the sample has
been drawn, is a suitable scale.
SVD-smoothing [27] is an extraordinarily powerful tool to analyze interdependencies. As noted earlier, in an ICU, clinicians constantly intervene in order to, among other therapeutic goals, maintain an adequately ‘safe’ CPP level. We find the clinicians’ therapeutic interventions do not necessarily change vital parameters that are intended to readjust CPP to ‘safe’ levels. For some patients, intervening via hypothermia [34] may alter CPP levels; however, the statistical strengths of the relevant predictor models are not known to the intervening clinician - the best predictor models are only known in hindsight. In some models we find TEMP levels as possibly being a predictor variable (albeit with high likelihood), but rarely in others. The predictor HR, for example, is a predictor for ‘only’ four patients (12.5%) and the best predictor model was Model No. 3 Table 3. SVD is an analysis that overcomes the cause↔effect dilemma by determining interdependencies and not ascribing one variable as being caused/predicted by one or several others. What must be noted: the (perhaps random) fluctuations about the SVD-1 smoothed time progressions of the vital parameters are only a small fraction (frequently less than 1%) of the square of the Frobenius norm (Figure 1). The fluctuations about the SVD-1 smoothed signal may not be solely noise. Since clinicians are constantly intervening, a large fraction of the (small) fluctuations may be due to their efforts to keep the values of the vital parameters within acceptable bounds. As temperature was perceived by clinicians as a predictor variable, changing it via intervention should have changed-in their assessment-MAP (and CPP). This was not always the case, we discovered.
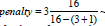
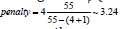
Our predictor models are linear models, so called because they are linear in the estimated coefficients k a [35]. They need not be linear in the predictor variables. In many of the linear predictor models we used, registrations of the vital parameters themselves are included nonlinearly. Since the number of complete quintuples N_P varies from patient-to-patient Figure1, we need to assess, in addition to the number of degrees of freedom in the models we are comparing, the number of quintuples included in each penalty term for each patient. The ‘penalty term’ [30] ( 1)

The patient with the smallest number of complete quintuples is 16, so even for the most complicated predictor model,


The application of Bayesian probability avoids two problematic applications of Frequentist statistics; namely comparing the point estimators-such as averages and standard deviations-of the samples and using (questionably estimated) confidence intervals about these point estimators. Jaynes [36] has elaborated rigorously why using these point estimators is misguided: there is no guarantee that a data set will reveal the true differences between populations from which the data sets have been drawn. Bayesian inference avoids the Prosecutor’s Fallacy [37] and stringently compares hypotheses.
Implications for clinical practice in an ICU
The (retrospective) study we present here is a novel approach to this issue of clinicians monitoring vital parameters; we looked for possible vital parameter interdependencies rather than predictor functions. That is to say, when clinicians alter one vital parameter they may-and, as we show, often do-uncontrollably alter the others, but not in the same way in every patient, and not necessarily always in the direction desired to achieve the treatment strategy. Presenting an analysis of summary statistics of a group of patients is therefore futile. The possible interdependencies occasionally include second-degree polynomials, demonstrating that there exist feedback mechanisms within the (damaged) brain and therefore making clinical interventions so challenging.
We Tested How Medically Relevant TEMP is as a predictor for MAP intervention by using a suite of 11 models that include temperature or an algebraic expression involving temperature as a predictor versus six models that exclude temperature as a predictor. Of the 11, five had to be excluded, based on the AICc not being a minimum Table 3. We found regression evidence for six models that include TEMP and six models that exclude TEMP. Since TEMP is a predictor only half of the time, the strategy of using hypothermia as a means to lower ICP is not always warranted (if at all). Our findings help to clarify why there are no definitive evidencebased recommendations regarding the use of hypothermia to control for ICP swings [38]: prospective multicenter trials have not found any benefit [39]. We thus provide further evidence that predictor models for CPP are insufficiently verified in the published literature. Huschak et al. [39] found no support for the hypothesis that brain temperature correlates with ICP. Our findings suggest why: TEMP is not always a predictor of MAP. The insufficient evidence documented in the publications [38,39] concerning predictor models corroborates our finding that, by using SVD, CPP is interdependent with (and not dependent on) the other vital parameters TEMP, HR and etCO2. This interdependence is equally valid for both anesthetic agents.
Our statistical analysis does not use summary statistical estimators of all the patients together as one sample. Rather, we extract the statistical parameters, one distinct set for each patient. Using this intra-patient analysis, we find a mosaic of vital parameter interdependency patterns, but also a general theme: as the centers of temperature regulation within the brain are involved in feedback cycles, lowering TEMP results in a response that may or may not lower CPP. Clinicians cannot always control CPP by direct manipulation of TEMP. One possible scenario involving these temperature-regulating centers is perhaps the following: the patients for whom TEMP is predicted by a function (polynomial) of other vital parameters are those with intact temperature regulating centers (i.e., centers not under duress due to high ICP). We do not, however, have direct measurable evidence for this hypothesis and it may be impossible to obtain such evidence directly in an ICU setting. Based on our analyses, we can confirm and clarify why Huschak et al. [39] did not find a clinically useful correlation: other vital parameters ‘interfere’. That is to say, they become clinically more relevant during intervention.
Diringer et al. [40] found that elevated body temperature independently contributes to increased LoS in ICU patients. They support their claim of independent contribution by constructing a path analysis; it shows that elevated body temperature couples to other variables (severity, number of complications, and LoS). Of all the couplings in their published pathway model, one coupling-LoS with elevated body temperature-is remarkably small. So small, in fact, that we question its relevance-especially when the coupling between LoS and the number of complications during an ICU stay is around 200 times higher. Our analysis here deals with parameters not studied by Diringer et al. [40]. We studied feedback between physiological parameters of the patients individually during their stay, whereas Diringer et al. [40] studied population effect
Our findings of couplings between physiologically vital parameters Table 3 are evidence of the existence of physiological feedback cycles which are ‘at the mercy’ of the (largely robust?) temperature regulating centers in the human brain. Indeed, we are tempted to interpret our findings in the following manner: because not all feedback models include temperature as being a statistical signal, perhaps in only some patients one or several of the temperature regulating centers have been damaged during TBI. In any case, the effect of increased LoS found by Diringer et al. [40] is an uncannily indirect support of our findings, because the number of complications that couple with LoS may indicate damage to these temperature regulating centers. Interventions that include HR and etCO2 may also be necessary [41]. The predictor models show that some patients respond to some degree of thermoregulation interventions. Further research is warranted to find clinical indicators and strategies when thermoregulation is employed to no avail [42-46].
Conclusion
Our findings show that employing thermoregulation in an ICU setting is beneficial to only some patients, if at all. The interdependencies of the vital parameters CPP, TEMP, HR, and etCO2 are highly significant, so using thermoregulation to control TEMP may change the other parameters, with the attendant risk of frustrating the effects of thermoregulation. Our findings show that there is no marked (significant) difference between the use of propofol or sevoflurane as an anesthetic agent for TBI patients while they are in an ICU..
Author contribution
HS supervised the project. HH, AA, and RB collected the data. KM and AG checked the data and filled in gaps wherever possible. HP designed the analyses, analyzed the data and constructed the models. HP wrote the manuscript; HS and HH made corrections and modifications.
Acknowledgement
We thank the hospital staff not only for their intensive care of the patients, but also for their painstaking dedication to collecting reliable patient parameters. We also thank V. Prossinger-Beck and E. Steltzer for editing a first version of the manuscript.
References
- Juškys R, Hendrixson V (2019) Pathophysiology of severe traumatic brain injury and management of intracranial hypertension. Lietovos Chirurgija 18(2): 62-71.
- Wijayatilake DS, Shepherd SJ, Sherren PB (2012) Updates in the management of intracranial pressure in traumatic brain injury. Curr Opp Anesthesiol 25(5): 540-547.
- Stocchetti N, Zanier ER (2013) Brain Temperature. In: LeRoux PD, Levine JM, Kofke WA (Eds.), Monitoring in Neurocritical Care. Elsevier Saunders, Philadelphia, USA, pp. 367-371.
- Burnstein R, Carter J (2009) Therapeutic options in neurocritical care: optimizing brain physiology. In: Whitfield PC, Thomas EO, Summers F, Whyte M, Hutchinson PJ (Eds.), Head injury: A multidisciplinary approach. Cambridge University Press, UK.
- Kilpatrick MM, Lowry DW, Firlik AD, Yonas H, Marion DW (2000) Hyperthermia in the neurosurgical intensive care unit. Neurosurgery 47(4): 850-856.
- Commichau C, Scarmeas N, Mayer SA (2003) Risk factors for fever in the neurological intensive care unit. Neurology 60: 837-841.
- Kuo JR, Lo C J, Wang CC, Lu CL, Lin SC, et al. (2011) Measuring brain temperature while maintaining brain normothermia in patients with severe traumatic brain injury. J Clin Neurosci 18(8): 1059-1063.
- Osilla EV, Sharma S (2019) Physiology, temperature regulation. Stat Pearls Publishing, FL, USA.
- Kanosue K, Crawshaw LI, Nagashima K, Yoda T (2010) Concepts to utilize in describing thermoregulation and neurophysiological evidence for how the system works. Eur J Appl Physiol 109: 5-11.
- Juul N, Morris GF, Marshall SB, Marshall LF (2000) Intracranial hypertension and cerebral perfusion pressure: Influence on neurological deterioration and outcome in severe head injury. The Executive Committee of the International Selfotel Trial. Journal of Neurosurgery 92: 1-6.
- Cruz J, Jaggi JL, Hoffstad O J (1995) Cerebral blood flow, vascular resistance, and oxygen metabolism in acute brain trauma: Redefining the role of cerebral perfusion pressure? Crit care Med 23(8): 1412-1417.
- Spiotta AM, Stiefel ME, Heuer GG, Bloom SB, Maloney WE, et al. (2008) Brain hyperthermia after traumatic brain injury does not reduce brain oxygen. Neurosurgery 62(4): 864-872.
- Rao GSU, Durga P (2011) Changing trends in monitoring brain ischemia: From intracranial pressure to cerebral oximetry. Curr Opp Anesthesiol 24(5): 487-494.
- Soukup J, Zauner A, Doppenberg EMR, Menzel M, Gilman C, et al. (2002) The importance of brain temperature in patients after severe head injury: relationship to intracranial pressure, cerebral perfusion pressure, cerebral blood flow, and outcome. J Neurotrauma 19(5): 559-571.
- Prossinger H, Hetz H, Acimovic A, Berger R, Mostafa K, et al. (2019) Can conventional randomization in clinical trials with small sample sizes be considered adequately random? a case study of tbi patients sedated with sevoflurane or propofol. Internat Journ Sci Env Tech 8(4): 938-954.
- Hastie T, Tibshirani R, Friedman J (2017) The elements of statistical learning. data mining, inference, and prediction. Springer, New York, USA, pp 745.
- Murphy KP (2012) Machine learning. A probabilistic perspective. The MIT Press, Cambridge, USA, p. 1071.
- Eliason SR (1993) Maximum likelihood estimation: Logic and practice. Sage Publications, Newbury Park, USA, p. 87.
- Huelsenbeck JP, Crandall KA (1997) Phylogeny estimation and hypothesis testing using maximum likelihood. Annual Review of Ecology and Systematics 28: 437-466.
- Romagnoli S, Chelazzi C, Villa G, Zagli G, Benvenuti F, et al. (2017) Critical Care Medicine Journal 45: e925-e931.
- Bonhomme V, Boveroux P, Hans P, Brichant JF, Vanhauderhuyse A (2011) Influence of anesthesia on cerebral blood flow, cerebral metabolic rate, and brain function connectivity. Current Opinion in Anesthesiology 24(5): 474-479.
- El Beheiry H (2012) Protecting the brain during neurosurgical procedures: strategies that can work. Curr Opin Anesthesiol. 25(5): 548-555.
- Zuo Z (2012) Are volatile anesthetics neuroprotective or neurotoxic? Medical Gas Research 2: 1-9.
- Chui J, Mariappan R, Mehta J, Manninen P, Venkatraghavan L (2014) Comparison of propofol and volatile agents for maintenance of anesthesia during elective craniotomy procedures: Systematic review and meta-analysis. Can J Anesth 61(4): 347-356.
- Wilks SS (1937) The large-sample distribution of the likelihood ratio for testing composite hypotheses. Phil Trans Roy Soc A 231: 60-62.
- Prossinger H, Bookstein FL (2003) Statistical estimators of frontal sinus cross section ontogeny from very noisy data. Jour Morphol 257(1): 1-8.
- Leon SJ (1998) Linear algebra with applications. Prentice Hall, Upper Saddle River, USA, p. 491
- Akaike H (1973) Information theory as an extension of the maximum likelihood principle. In: Petrov BN, Csaki F (Eds.), Second International Symposium on Information Theory. Akademiai Kiado, Budapest, Hungary.
- Takeuchi K (1976) Distribution of informational statistics and a criterion of model fitting. Suri-Kagaku (Mathematical Sciences) 153: 12-18.
- Burnham KP, Anderson DR (2002) Model selection and multimodel inference: In: A Practical Information-Theoretic Approach. (2nd edn), Springer, New York, USA, pp. 488.
- Arnheim A, Greenland S, McShane B (2019) Retire statistical significance. Nature 567: 305-307.
- Prossinger H, Hetz H, Acimovic A, Berger R, Mostafa K, et al. (2019) The intervention threshold for intracranial pressure of traumatic brain injury patients can be determined by clustering algorithms and is observed to be 13mm Hg. Clinical Medicine Research 8: 6-15.
- Jerath A, Panckhurst J, Parotto M, Lightfoot N, Wasowicz M, et al. (2017) Safety and efficacy of volatile anesthetic agents compared with standard intravenous Midazolam/Propofol sedation in ventilated critical care patients: A meta-analysis and systematic review of prospective trials. Anesthesia & Analgesia 124: 1190-1199.
- Lewis SR, Evans DJW, Butler AR, Schofield R, Alderson P (2017) Hypothermia for traumatic brain injury (Review). Cochrane Database of Systematic Reviews 9: 1-8.
- James G, Witten D, Hastie T, Tibshirani R (2015) An introduction to statistical learning with applications in R. science+business, Springer, New York, USA, p. 426.
- Jaynes ET (1976) Confidence Intervals vs. Bayesian Intervals. In: Harper, Hooker (Eds.), Foundations of Probability Theory, Statistical Inference, and Statistical Theories of Science. D Reidel Publishing Company, Dordrecht, Holland, Netherlands.
- Krzywinski M, Altman N (2013) Significance, P values and t-tests. Nature Methods 10: 1041-1042.
- Marion DW, Regasa LE (2014) Revisiting therapeutic hypothermia for severe traumatic brain injury… again. Critical Care 18: 160.
- Huschak G, Hoell T, Wiegel M, Hohaus C, Stuttmann R, et al. (2008) Does brain temperature correlate with intracranial pressure? J Neurosurg Anesthesiol 20(2): 105-109.
- Diriniger MN, Reaven NI, Funk SE, Ulman GC (2004) Elevated body temperature independently contributes to increased length of stay in neurologic intensive care unit. Crit Care Med 32: 1489-1495.
- Biersteker HR, Andriessen TC, Horn J, Franschman G, Van NJ (2012) Factors influencing intracranial pressure monitoring guideline compliance and outcome after severe traumatic brain injury. Crit Care Med 40(6): 1914-1922.
- Akaike H (1981) Likelihood of a model and information criteria. Journal of Econometrics 16(1): 3-14.
- Kruschke JK (2015) Doing bayesian data analysis: A Tutorial with R, JAGS and Stan. In: (2nd edn), Academic Press & Elsevier London, UK, p.759.
- Bishop M (2006) Pattern recognition and machine learning. Springer, New York, USA, p. 738.
- Jeffreys H (1932) On the theory of errors and least squares. Proc Roy Soc 138: 48-55.
- Nelson RB (2006) An introduction to copulas. In: (2nd edn). Springer, New York, USA, p.269.
© 2022 Hermann Prossinger. This is an open access article distributed under the terms of the Creative Commons Attribution License , which permits unrestricted use, distribution, and build upon your work non-commercially.
Editor In Chief


.jpg)


Signup for Newsletter

Quick Links
 Editorial Board Registrations
 Submit your Article
 Refer a Friend
 Advertise With Us
Our Recent Edition

.jpg)


Top Editors


.jpg)


.bmp)
.jpg)
.png)
.jpg)


.jpg)


.png)

.png)


.png)


Financial Support

Sponsors

Latest e-Books

Latest Video

 a Creative Commons Attribution 4.0 International License. Based on a work at www.crimsonpublishers.com.
Best viewed in
a Creative Commons Attribution 4.0 International License. Based on a work at www.crimsonpublishers.com.
Best viewed in