
- About Us
- Information
-

The Author ensures that the research has been conducted responsibly and ethically with adherence to all relevant regulations. read more..
- For Authors
- For Reviewer
- Manuscript Guidelines
- Membership
- Publication Ethics
-
- Journals
- Reprints
- e-Books
- Videos
- Policies
- Contact Us
 COVID-19
- Submissions


Full Text
COJ Technical & Scientific Research
Effects of Water in Inactive Room and Pillar Coal Mines on Causing and Preventing Surface Subsidence
Yi Luo*
Department of Mining Engineering, West Virginia University, USA
*Corresponding author: Yi Luo, Department of Mining Engineering, West Virginia University, Morgantown, WV, USA
Submission: August 30, 2021; Published: November 02, 2021

Volume3 Issue4November, 2021
Abstract
After sealing a portion of or closing an underground room and pillar coal mine, the mined spaces are likely to be filled with water. In many cases, the mine water accumulated in the mined spaces could weaken the remnant mine structures which might lead to their failure in larges areas and subsequent surface subsidence. In some other cases, the hydrostatic pressure associated with the accumulated mine water acts as a supplemental roof supporting force to prevent the occurrence of surface subsidence. The mechanisms for mine water to cause or prevent surface subsidence over inactive room and pillar coal mines are explained and the appropriate mechanical models to assess the mine water effects have been proposed in the paper. One investigated subsidence case over inactive coal mines caused by the failure of water-weakened mine structures and another by water withdrawal are presented. The root causes, subsidence formation process, and subsidence effects of these subsidence events are analyzed.
Keywords: Water; Coal mine; Surface subsidence; Creeping; Cyclic Weathering; Geology
Introduction
In designing and operating an underground room and pillar coal mine without pillaring (secondary mining), a main intention is not to cause surface subsidence. However, many subsidence events do occur over inactive room and pillar mines and cause severe disturbances to surface structures. It needs a subsidence source, a void of adequate size, created at the mine level to develop a surface subsidence event. In other words, the voids created by normal development mining extractions are not sufficiently large to create surface subsidence events and the mining voids are subsequently expanded by post-mining failure of mine structures (i.e., floor, pillars and roof) to reach the adequate size. Many factors could cause the post-mining failure of mine structures including the time-dependent strength creeping, cyclic weathering, unexpected external forces (e.g., earthquake, multi-seam mining interaction), mine water, etc. Among these post-mining factors, the accumulation of mine water in inactive room and pillar mines is often unavoidable and could be responsible for most of the observed surface subsidence events. However, mine water can play dual roles either to cause or to prevent the development process leading to surface subsidence events. In the following two sections, the mechanical models for assessing the effects of mine water on causing or preventing surface subsidence have been developed. A real case for each of the two conditions is presented for the purpose of validating the developed models. Due to the possibly large differences of root causes and overburden geology, the time for forming a subsidence source and for strata failure propagating through the overburden strata, a surface subsidence event over room and pillar mines could occur nearly immediately or decades after the mining operation. Emphasis is also placed on the quantification of the occurrence timing of a surface subsidence event associated with mine water.
Water as Cause of Surface Subsidence
A subsidence source of sufficient size is the necessary and essential condition for creating a surface subsidence event. The subsidence source could be the void created by mining operations, and/or the roof-to-floor convergence due to deformation or failure of mine structures (i.e., roof, pillar and roof) or their combination. The size of a subsidence source includes its thickness and lateral extent of the void formed in the mine level. Two forms of surface subsidence (i.e., trough or sinkhole) events can occur over room and pillar mines. The lateral dimension (i.e., the width of a rectangular void or the smaller lateral dimension of an irregular void) of the subsidence source should exceed an effective width (We), ranging from 0.3 to 0.4 times of the overburden depth (h), for a trough type of subsidence to form on ground surface. Sinkhole subsidence typically occurs over shallow mines with very weak overburden strata. Determining the critical dimension of the subsidence source for a sinkhole event is more complicated and will be addressed later. Commonly, one of the intentions for employing room and pillar mining method is not to cause surface subsidence, therefore, the mining-created voids are far smaller than the effective width. However, many subsidence events have been reported over room and pillar mines either after the closure of an old mine or sealing of a part of an active mine indicating that the effective width had been reached or exceeded. The possible causes for the expansion of the mined voids into a subsidence source could be many. However, the strength-weakening effects of mine water on the mine structures is the most possibly cause for creating a subsidence source as the accumulation of mine water in sealed mine is inevitable and strength reduction effect of mine water on clay-rich rocks is very pronounced. In this section, the mechanism, the conditions and a real case for mine water to induce surface subsidence event is presented.
Subsidence Causing Mechanism
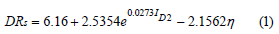
In many mineable coal formations, clay-rich nondurable rocks (i.e., claystone, mudstone, clay shale, mud shale and siltstone, etc.) are present as the mine floor, seam partings and roof of the mined coal seams. The nondurable nature of such rocks depends on the content of clay materials such as palygorskite, halloysite, illite, kaolinite and chlorite [1]. Through absorbing moisture, these nondurable rocks can be greatly weakened by water, deform plastically and swell considerably thereafter. On the other hand, the water-weakening effects on durable coal-measure rocks such as sandstone, limestone and coal are typically very minor. The easiest way to differentiate durable and nondurable rocks are through conducting slake durability tests. Richardson [2] relate the durability rating of shale type rocks (DRs) to the 2-cycle slake durability test (2-cycle, 10 minutes and 200 revolutions per cycle) index (ID2, %) and the natural moisture content (h, %) in Equation 1.
When the resulting durability rating (DRs) is below 50, the shale is considered soil-like, nondurable and can be weakened considerably by mine water. Therefore, for assessing the water’s strength-weakening effects on mine subsidence, only the rocks with their durability ratings smaller than 50 are considered. For example, for a typical underclay-claystone mine floor in the Illinois underground coal mines with ID2=33% and h=11.7%, the resulting DRs=42.6% confirms its nondurable nature. The frequently encountered floor heaves in the Illinois coal mines and the reported long-term surface subsidence events in the area can be attributed to such nondurable mine floor rocks. The water-weakening effect to nondurable rocks makes them easy to deform and to induce more roof to floor convergence as subsidence source. Hendron [3] developed the following empirical relationship between Young’s modulus and moisture content (h) based on the data measured on gray and black shales in the Illinois Basin.
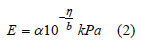
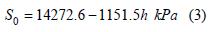
For gray shale in the Illinois Basin, the two coefficients a and b in the empirical formula are 1.717×10⁶ and 6.133, respectively. For black shale, the coefficients are 9.86×10⁶ and 6.36, respectively. Apparently, the black gray is stiffer than the gray shale. Jiang [4] found that the uniaxial compressive strength of claystone can be reduced from 45mPa (6,527psi) at dry state to 5mPa (725psi) at saturated state. Lashkaripour [5] studied the effect of water content on the mechanical behavior of fine-grained sedimentary rocks including mudstones, mudshales, and clay shales. They found that these rocks suffered from more than 90% reduction in strength and 84 % reduction in modulus on saturation. Marino [6] studied the moisture softening effects on floor bearing capacity in Illinois coal mines with thick clay-rich nondurable rock strata as the immediate mine floor. They found that the strength and stiffness of the rock decrease as the moisture content increases. Speck (1979) developed a relationship between the compressive strength of nondurable rock (so) and the moisture content (h, %) as shown in Equation 3.
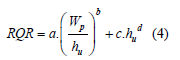
Based on Eq. 3, the compressive strength (so) of nondurable rocks rapidly decreases from 14,272.6kPa (2,070psi) at h=0% to zero at h=12.38%. The compressive strength of rock plays an important role in determining the pillar strength and the load bearing capacities of mine floor and roof. Many different pillar design methods and programs can be used to assess the stability of these mine structures (i.e., floor, pillars and roof) for various mining situations. When any of the mine structures contains significant amount of nondurable rocks and is submerged in mine water, the reduced rock strength should be used in the stability analysis. The effect for mine water to reduce the stability of mine structures containing nondurable rock strata depends not only on the reduced strength (so) but also on the pillar width (Wp) to room width (Wr) ratio and the thickness of the nondurable rock layer (hu). Marino [6] performed numerical analysis to study the reduction of floor bearing capacity for Illinois coal mines. In their simulations, the room width is kept as 20ft (6.1m). The pillar width and the thickness of the nondurable floor strata varied. The resulting ratios of the reduced mine floor bearing capacity to that at unsoftened floor (RQR) from this simulation studies are listed in (Table 1). It shows when the pillar width is equal to the room width and the thickness of the nondurable floor rock is one half of pillar width, i.e., 10ft (3.05m), the floor has the least bearing capacity or 14% of the ultimate bearing capacity at unsoftened condition. A nonlinear regression performed on the simulation results in (Table 1) shows a relationship among the RQR, pillar width (Wp) and thickness of nondurable floor strata (hu) in the form of Eq. 4. In the equation, a, b, c and d are the regression coefficients and the determined values are 0.123, 0.490, 4.71×10⁻³ and 1.08, respectively. The empirical equation fits the simulation results fairly well and could serve as a guide to qualitatively understand the effects of nondurable rock to mine floor stability. It shows the thickness of the nondurable floor strata plays a significant role in the reduction of floor bearing capacity. It is believed that Eq Equation 4 is also applicable to nondurable pillar partings and immediate mine roof.
Table 1: Softened floor bearing capacity in percent of unsoftened capacity (RQR).

The rate for water to degrade the nondurable rocks depends on the apparent or effective porosity, a measure of the inter-connected pores excluding the sealed-off pores in the rocks. Plate bearing tests performed on Illinois underclay/claystone floors after being soaked for only 24 hours showed a decrease in plate bearing of up to 50% [7]. For floor underclay-claystone in the Appalachian coal field it was not uncommon to find when performing rapid plate bearing tests that one-half of the unsoaked strength would be lost after short-term soaking [8]. As the mine structures fail under the influence of mine water, the mine voids expand and could form subsidence sources of sufficient-sizes and cause surface subsidence. A good understanding of the nondurable rocks’ degradation process under the influence of mine water and its effects on forming the subsidence source could lead to certain degree of predictability for the subsidence events over inactive mines – currently classified as the unplanned subsidence. As the moisture content of a nondurable rock after submerged in mine water exceeds the plasticity limit, the rock deforms plastically, and its volume expands. The expansiveness due to moisture degradation is measured by the swelling factor or volumetric swelling strain defined as the ratio of the expanded volume to its original volume at dry state. Van der Merwe [9] shows that that rocks containing more than 17% clay materials and having a plasticity index >23% will have high to very high potential expansiveness. Zhang [10] performed experiments to study the swelling characteristics of two mudstones, the Callovo- Oxfordian (COx) argillite in France and the Opalinus (OPA) clay in Switzerland. Based on their experimental data, it is found that the volumetric swelling strain can be related to the moisture content by the second order polynomials as shown in (Figure 1). It shows that the moisture swelling is typically less than 12% -agreeable with the other studies. However, when fissures and cracks form in the nondurable rocks under external load, the broken rocks also bulk to further increase the expansiveness. As the nondurable rocks in the failed mine structures swell and bulk, the expanded nondurable rocks would fill up portion of the voids and eventually stops the ground subsidence process. Apparently, the thicker and higher expansiveness are the nondurable rocks in the mine structures, the subsidence process will stop sooner, and less surface subsidence can result.
Figure 1: Volumetric swelling strain vs water content for two mudstones.

Case Study A
A subsidence case caused by the raising mine water in an old coal mine was investigated in the early 2000. The subsidence event induced by the water-weakening effect in the old mine caused not only significant roof falls in an active mine in an overlying coal seam but also disturbances to ground surface. The investigation started after a ground crack and a depression zone were reported in early September by a homeowner and extensive roof falls in underground areas of the active mine beneath and near the observed surface problems. The surface ground crack and the depression zone as well as the roof falls were mapped. Through the correlation of the surface and underground observations, the root cause of the surface subsidence events was determined. (Figure 2) shows the investigation site. At that time, the active mine in the upper coal seam was developing its 10-entry mains from east to west direction. The floor elevation contour lines (in unit of ft) in the active mine are also plotted in the figure with a dipping angle of about 1.2o toward northwest. The lower coal seam is located about 90ft (27m) below the upper coal seam. Since the two coal seams are nearly parallel to each other, the coal seams have the similar dipping trend. The portion of the mine in the lower seam under the site was mined in the 1960’s using the room and pillar method. Development mining only (without pillaring) was conducted in an area west of the red solid line while partial pillaring operation was conducted in an area east of the red line.
Figure 2: The overview of the subsidence investigation site for case A.

A large irregular support area, about 250ft (76m) long and 150ft (46m) wide, for protecting a gas well was left in the lower seam. The mapped ground crack and the depression zone on the surface is shown in (Figure 3). The crack was approximately 0.5 to 3 inches (13 to 76mm) wide and was about 200ft (61m) long. It shows that the orientation of the ground crack is roughly parallel to the northern edge of the support area with the horizontal distance ranging from about 15 to 30ft (4.6 to 9.1m). The location of the surface depression zone is shown in (Figure 3). In the depression zone, the grass appeared to be not as green as the other part of the yard-a sign of the lack of adequate drainage for a long period. The depression zone was about 20ft (6.1m) in diameter. It shows that the center of the depression zone was very close to the location of the abandoned gas well and over the central portion of the support area left in the lower coal seam. The underground disturbances in the active mine in the area directly under or near the reported surface problems were also observed. The disturbances include roof falls, roof cutters and floor heaves as shown in (Figure 4).
Figure 3: Mapped ground crack and depression zone on surface.

Figure 4: Mapped roof falls and floor heaves in active mine.

The most serious underground problem is the massive roof falls in the first entry. The falls were about 290ft (88.4m) long and the fallen debris, as observed from accessible sides of the entry and the crosscuts, filled up the entire first entry. This roof fall appeared to coincide with the edge of the support pillar area with the west end of the roof fall extended about 100ft (30m) away from the support area. At the location indicated by the yellow triangle in (Figure 4), the mine roof and floor were apparently dipping from the solid coal rib on the south toward north. The roof line on the north entry rib appeared to be at least 8 inches (203mm) lower than that on the solid coal side resulting in an average tilting of about 3.3%. The mine floor in the area also appeared to bend convexly. Significant floor heave with tension cracks were also observed in the two entries near the north edge the support area left in the lower seam. Although some rib spalls were visible, the pillars in the area, as well as in other parts of the mine, appeared to remain intact. Floor heave, roof cutters were also observed in other parts of the active mine. All these features correlate well with the edges of the barrier pillars in the lower seam. The portion of the mine in the lower coal seam is shown in (Figure 5).
Figure 5: Mine layout in the lower coal seam and measured subsidence in the upper seam.

The lower coal seam was dipping toward northwest direction similar to that shown in (Figure 2). Development mining was practiced in one third of the area in the figure on the left while pillar splitting operations were performed in the area on the right. Between the two areas, large or long barrier pillars were left. Two large irregular shaped support areas to protect two gas wells are also shown in the figure. Most of observed surface and underground problems in the active mine occurred near the support area in the south.
After the mine closure, water level in the closed mine has been rising with time. The recorded water levels in the lower seam at four different dates from the beginning of the year to the end of August are plotted in (Figure 6) along the cross-section A-A’ (shown in Figure 5). During this 8-month period, the mine water level rose about 55ft (16.8m). The location of the support pillar area for the gas well is also plotted in this figure. At the end of August, the water level in the lower seam was from 0 to 8ft (0 to 2.4m) above the roof line at the location of the gas well support area. Using linear interpolation, the possible time when the water level reached the foot of the gas well support pillar area in the lower seam was in the early July. By adding a mining height of 6.5ft (1.98m), it was estimated that the water level would reach the roof line of the support pillar area in the early August – about one month before the reported surface subsidence events. It should be noted that there is a weak clay-rich slate with varying thickness immediately above the lower coal seam. Historically, after being saturated with water this weak slate can deteriorate significantly and cause roof falls in large areas.Figure 6: Water level monitoring results in the closed mine in lower coal seam.

Between 13 and 17 days after the reported surface subsidence events, the mine floor elevations at 27 selected mine intersections in the active mine (red dots in Figure 5) close to the site of surface subsidence events were resurveyed. As the initial surveys were made stepwise as the mine was developed westward, the time elapses between the initial surveys and the resurveys ranged from 8 to 57 days. The elevation differences ranged from +0.58 ft or +177mm (+ sign for ground heave) to -0.85 ft or -259mm (- sign for ground subsidence). It should be noted that most of the initial surveys were made close to and after the time of the reported surface problems and the occurrence time of the large roof fall in the active mine. Therefore, subsidence could have occurred at most, if not all, of the locations before their respective initial surveys.
The distribution of the measured elevation differences in the area below or near the reported surface problems are plotted in (Figure 5). In this figure, the mine map in the lower coal seam is shown in the background. In about two third of the figure on the right depillaring operation was apparent while development-only work was done in the left one third. In the depillared area, each of the 75-ft (22.9m) square pillars was split with “T” cuts. The room width is measured to be 20ft (6.1m), the recovery ratio in the depillared area is 60% and it is 38% in the development only area. For an overburden depth of 385ft, the pillar stability factors are 6.35 and 1.87 for the development only and the depillared areas, respectively indicating that these mine structures will be stable when mine was dry. A line of barrier square pillars, each about 70ft (21.3m) rib-to-rib, was located about 450ft (137.2m) from the left edge of the support pillar area for the gas well. The rising mine water in the lower seam moved from the northwest to the southeast corner of the figure as indicated. The front line of the water pool in the lower seam at the end of August was also plotted in (Figure 5).
At that time, the waterfront line was just past the right edge of the support pillar area and was about 720ft (219.5m) to the edge of the barrier pillar. (Figure 5) shows two zones of significant subsidence (in red color), both located over area between the waterfront line and the edge of the area with development mining. The zone with the larger elevation difference, the maximum being about -0.85ft (-259mm), was located approximately over the central portion between the waterfront line and the edge of the barrier pillar. This subsidence zone coincided with the observed roof and floor inclination shown in (Figure 4). The other subsidence zone, with the maximum being about -0.47ft (-143mm), was located between the two large support pillar areas. A zone of floor heave (shown in yellow color) appeared nearly parallel to the edge of the barrier pillar. By overlaying the distribution of the elevation difference in the upper seam on the mine map and waterfront line in the lower seam, it shows that significant elevation changes occurred over the depillared area that had submerged in the rising mine water. Most of the observed ground control problems shown in (Figure 4) correlate well with the transition zones between the depillared areas and the areas of more competent mine structures (i.e., support pillar areas and development mining zones) in the lower seam.
As mentioned previously, the lower coal seam is characterized by a main coal bench with its thickness suitable for being mined by room and pillar method and a clay-rich drawslate immediate roof (Figure 7a). This drawslate layer typically ranges from 1 to 3ft in thickness. As the rising mine water reaches the drawslate, its strength is considerably weakened by water infiltrated through the preexisting and mining-induced fractures resulting in the failure of immediate roof (Figure 7b-i). After the failure of drawslate layer above mine room, the remaining drawslate located above the pillar begins to fail from pillar perimeter toward its center and leave a hard core where the water in unable to infiltrate to cause further failure. For simplicity, a shear failure angle of 45o is used to delineate the hard core. This hard core transfers the overburden load to the central part of the pillar. When the pillar is relatively narrow (often resulted from depillaring operations as shown in (Figure 5), the hard core acts like a wedge to split the pillar (Figure 7b-i) to cause its failure. Using this approach, the stability factors for the pillars in the main and those in the depillared areas for dry and flooded mine conditions have been determined and listed in (Table 2). Three thicknesses of drawslate roof layer (i.e., 1,2 and 3ft, or 305, 610 and 914mm) are assumed in the calculations. The empirical equation (Equation. 4) has been applied to determine the ratios of the reduced mine roof bearing capacity to that at unsoftened roof (RQR) when mine water has weakened the mine roof. In the area of development mining only, the mine water can reduce the roof bearing capacity to 61% of that at dry condition for 3ft (914mm) drawslate roof layer. However, when the drawslate roof is submerged in mine water, the roof bearing capacity is reduced to 38% of its original value for the 3-ft drawslate roof layer.
Table 2: Pillar stability analysis without and with mine water.

Figure 7: Schematic of water effects to create a subsidence source.

In determining the pillar stability, a reduced coal strength of 800psi (5.52MPa) is used considering the age of the pillars. The pillar stability factors are calculated from the typical 75-ft (22.9- m) square pillar before and after the T-split depillaring operation. The “recovery ratio” is calculated from the contact areas between the remaining drawsalte above the remnant pillars and overlying competent roof. The pillar stability factors in the development only area ranges from 6.53 in dry mine condition to 4.45 when the 3-ft drawslate roof layer is submerged in mine water. It indicates that the pillars in the main development were still stable even they are flooded. In the depillared area with T-split, each of the 75-ft square pillars was split into one 75-ft×27.5-ft (22.9-m×8.4-m) rectangular pillar and two 27.5-ft square pillars. The pillar stability factor in dry mine condition is 1.87-still stable to support the overburden. However, as the rising mine water weakened the drawslate roof layer causing its progressive failure (Figure 7b-i), the pillar stability factors decrease to 0.69, 0.56 and 0.45 for the three thicknesses of 1, 2 and 3ft, respectively. Failure of the remnant pillars can lead to a roof convergence (DH) estimated by Equation. 5 assuming that the debris of the failed remnant pillars and the drawslate roof layer would completely fill the mine void and support the competent roof above.
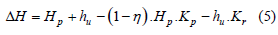
In this equation, Hp is the pillar height, hu is the thickness of the drawslate roof layer, h is the recovery ratio (60% in this case), Kp is the bulking factor of failed pillar and Kr is the bulking factor of the failed drawslate roof layer. In this case, if Kp=1.1 and Kr=1.26 are used, the estimated roof convergences for the 1-, 2- and 3-ft thick of drawslate roof layer would be 3.38, 3.12 and 2.86ft (1.03, 0.95 and 0.87m), respectively. The large roof convergence in the large flooded depillared area forms the subsidence source to induce subsurface and surface subsidence that caused the observed damages to the active mine in the upper coal seam and disturbances on ground surface. Using the estimated 3.12ft (0.95m) roof convergence as the subsidence source, the predicted maximum subsidence (Smax) in the upper coal seam and on ground surface are 2.1 and 1.93ft (0.64 and 0.59m), respectively. The predicted maximum tensile strain (emax) in the upper coal seam is 3.48×10⁻²ft/ft (m/m) – a very high value to cause large tensile ground cracks. The location of the maximum tensile strain is about 15ft (4.6m) inside the edge of subsidence source (the edge of the support area, barrier pillars, the unsplit pillars and the front line of the rising mine water at the time of investigation). The observed massive roof falls in the south entry above the edge of the support area left in the lower coal seam and the other observed problems in the active mine correlate well with the tension zone of the subsidence basin (Figure 4). The predicted maximum tensile strain on the ground surface is 2.29×10⁻² ft/ft (m/m), again significantly larger than the critical tensile strain for inducing ground crack on soil ground –1.3×10⁻² ft/ft (m/m).
Water as preventor of surface subsidence
When an abandoned mine is filled with mine water and the water table is significantly higher than the mining level, the hydrostatic pressure of the mine water plays a role to support the mine roof and to reduce pillar stress. If the mine water is suddenly withdrawn from the mine, the removed hydrostatic pressure could have potential to induce sinkhole or trough subsidence on ground surface. The hydrostatic pressure in the mine is a function of the water level above the coal mine level (hw) and water density (γw) as shown in (Figure 8). The mechanisms for sudden water withdrawal in abandoned underground coal mines to cause trough and sinkhole subsidence will be discussed separately in the following sections.
Figure 8: Schematic of hydrostatic pressure and tributary load method.

Mechanism for trough subsidence
As mentioned previously, a trough type subsidence event over abandoned coal mine is induced by a subsidence source where mine structures (mainly mine pillars) failed in a contiguous area. When a mine is flooded with a water head of hw, the total tributary force supporting the mine roof induced by the hydrostatic pressure is the product of the hydrostatic pressure [11] and the shaded area around the pillar (Figure 8) as defined by Equation. 6.
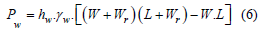
The hydrostatic supporting force reduces the pillar stress. In abandoned coal mines, the remnant pillars are often in irregular shapes and the pillar stress can be related to the recovery ratio (η). For an irregular-shaped pillar, its cross-sectional area (Ap) and perimeter (Cp) can be easily measured using engineering CAD program from mine map and the recovery ratio can be calculated. Therefore, the pillar stress with hydrostatic force can be estimated using Equation. 7.
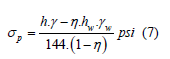
It should be noted that the first term,  is the pillar
tributary load from overburden strata while the second term,
is the pillar
tributary load from overburden strata while the second term,  is the reduced tributary load due to the hydrostatic
pressure. The effects for the hydrostatic pressure to reduce the
pillar stress can be assessed by the ratio of the second term to the
first term in Equation. 7 and the results are plotted in (Figure 9).
In the assessment, the densities of overburden rocks (g) and water
(gw) are 160 and 62lbs/ft3 (2,580 and 1,000kg/m3), respectively.
The water head above the mined coal seam is expressed as a
percent of the overburden depth (hw/h). By this way, the pillar
stress reduction is independent of overburden depth. (Figure
9) shows that the stress reduction increases both with the mine
recovery ratio (h) and the water head (hw/h).
is the reduced tributary load due to the hydrostatic
pressure. The effects for the hydrostatic pressure to reduce the
pillar stress can be assessed by the ratio of the second term to the
first term in Equation. 7 and the results are plotted in (Figure 9).
In the assessment, the densities of overburden rocks (g) and water
(gw) are 160 and 62lbs/ft3 (2,580 and 1,000kg/m3), respectively.
The water head above the mined coal seam is expressed as a
percent of the overburden depth (hw/h). By this way, the pillar
stress reduction is independent of overburden depth. (Figure
9) shows that the stress reduction increases both with the mine
recovery ratio (h) and the water head (hw/h).
Figure 9: Hydrostatic pressure effects on reducing pillar stress.

For example, when the water head is only 20% of the overburden depth, the effect on pillar stress reduction ranges from 2.3% to 6.6% of the tributary stress from the overburden strata when mine recovery ratio varies from 30% to 85%. However, when the water head equals the overburden depth (hw/h=100%), the reduction ranges from 11.6% to 32.9%. It clearly shows that when only development mining was conducted in room and pillar mines, typically resulting in low recovery ratio, the hydrostatic pressure would not significantly affect the pillar stability. However, when depillaring operation had been conducted resulting in high recovery ratio, stress on the remnant pillars would increase significantly after the withdrawal of mine water. If the remnant pillars were critically loaded already, the increased pillar stress could result in failure of these pillars. When the pillar failure occurs in a sufficiently large area, it can induce trough type of surface subsidence event.
Mechanism for sinkhole subsidence
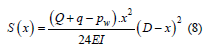
The hydrostatic pressure of mine water also provides supporting force to mine roof. In shallow abandoned coal mines with weak overburden strata, a relatively competent roof layer could often be the last barrier to prevent the development process of sinkhole subsidence event toward ground surface. Losing the hydrostatic pressure due to withdrawal of mine water could lead to the failure of this last competent layer and possibly sinkhole subsidence event. The span of the unsupported mine roof is the most critical factor affecting its stability. Massive roof failures are likely to occur in mines with weak and thinly bedded immediate roof strata in the following two forms: (1) tensile failure at the middle part of mine entry due to excessive roof sag and bed separations, and (2) cutter roofs at the edge of the entry. It is a well-known fact that the entry-crosscut intersection is the most likely originating location for a sinkhole subsidence since it has the longest unsupported roof span. Failure of small remnant pillar between two competent pillars could also create a large roof span. In developing a roof stability model for assessing the potential of sinkhole subsidence, it is assumed that the exposed roof layer is not supported by any significant standing supports and the roof bolts have been eroded to perform their intended functions. In a flooded abandoned mine with a water head of hw, the hydrostatic pressure produces a force pw = hw×γ w to support the mine roof. The exposed immediate roof layer can be treated as a beam of thickness b with fixed ends and is loaded with uniform overburden load Q and its own weight q as shown in (Figure 10).
Figure 10: Scheme for hydrostatic pressure to support mine roof.

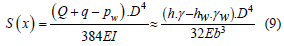
The immediate roof layer would deflect over the mine entry. Based on the beam theory, the deflection of a sagging roof layer at a given point of interest, S(x), is determined by Equation. 8 [11]. In the equation, E and I are the modulus of elasticity and moment of inertia of the beam, respectively.
Equation 8 also shows that the maximum roof deflection, So, with the supporting hydrostatic pressure occurs at the center of unsupported roof (x=D/2) can be determined by Equation. 9. In the simplified equation (the second part), g is the average density of the overburden rock strata including the roof layer. Apparently, the maximum roof deflection depends on, in descending order, the roof span (D), the Young’s modulus (E), the thickness of the competent roof layer (b), the overburden depth (h) and water head (hw).
When the other factors are the same, the ratio of the maximum
roof deflections after and before the withdrawal of mine water with its head being hw can be expressed as  The relationship
between the percent of increase in the maximum roof deflection (So)
and the water head (expressed by percent of the overburden depth)
is shown in (Figure 11). For example, the complete withdrawal
of mine water with its head being 60% of the overburden depth
will increase the maximum roof deflection by 20%. When the
water table reaches the ground surface (hw=h), the maximum roof
deflection would increase by 63% after the water being completely
withdrawn. As a quick reference, the physical and mechanical
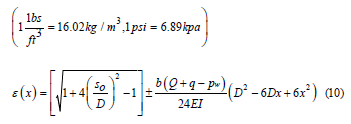
properties of common coal measure rocks in dry condition [12]
are listed in (Table 3). The previous section has discussed the
water’s weakening effect on non-durable rocks. Since it is hard to
accurately determine the tensile strength of rock materials, critical
tensile strain is a better indicator for failure assessment. Therefore,
it is important to determine the strain distribution on the top and
bottom surfaces of the rock layer where maximum strains are to occur. Equation 10 can be used to determine the surface strains
on a sagging roof layer shown in (Figure 10). In this equation,
the first term on the right is the tensile strain caused by the beam
elongation due to sagging while the second term is due to beam
bending. The positive sign (+) in front of the second term is for the
strain on the top surface of the layer and the negative sign (-) is for
the bottom surface. A positive strain is for tension and otherwise in
compression. For coal measure rocks, the tensile strain should be
more critically examined than the compressive strain [13].
The relationship
between the percent of increase in the maximum roof deflection (So)
and the water head (expressed by percent of the overburden depth)
is shown in (Figure 11). For example, the complete withdrawal
of mine water with its head being 60% of the overburden depth
will increase the maximum roof deflection by 20%. When the
water table reaches the ground surface (hw=h), the maximum roof
deflection would increase by 63% after the water being completely
withdrawn. As a quick reference, the physical and mechanical
properties of common coal measure rocks in dry condition [12]
are listed in (Table 3). The previous section has discussed the
water’s weakening effect on non-durable rocks. Since it is hard to
accurately determine the tensile strength of rock materials, critical
tensile strain is a better indicator for failure assessment. Therefore,
it is important to determine the strain distribution on the top and
bottom surfaces of the rock layer where maximum strains are to occur. Equation 10 can be used to determine the surface strains
on a sagging roof layer shown in (Figure 10). In this equation,
the first term on the right is the tensile strain caused by the beam
elongation due to sagging while the second term is due to beam
bending. The positive sign (+) in front of the second term is for the
strain on the top surface of the layer and the negative sign (-) is for
the bottom surface. A positive strain is for tension and otherwise in
compression. For coal measure rocks, the tensile strain should be
more critically examined than the compressive strain [13].
Table 3: Physical and mechanical properties of coal measure rocks in dry condition (Zhao).

Figure 11: Effects of water withdrawal on maximum roof deflection.

Equation 10 shows that the maximum tensile strain in a roof layer always occurs on its top surface at locations directly above the pillar ribs (x=0 and x=D) and is determined by Equation. 11.
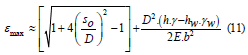
Equation 11 shows the maximum tensile strain on the roof layer is affected by the hydrostatic pressure in two ways, So in the first part and hw in the second part. After withdrawing the mine water, So would increase and hw decreases, both resulting in higher maximum tensile strain. For a bridging roof layer that has been loaded to a nearly critical condition, withdrawing the mine water increases the maximum tensile strain and could potentially cause failure of this layer. As it fails, domino effects could occur to cause propagation of strata movement upwards. If not stopped by an overlying competent stratum, such strata movement could eventually reach the ground surface to form a sinkhole subsidence event.
Case Study B
A previous publication [11] has presented a case study applying the developed mechanical model to identify the water withdrawal as the root cause for a number of sinkholes developed on an interstate highway. In this paper, the mechanical model has been applied in analyzing an abandoned mine subsidence case associated with the withdrawal of mine water. In this case, several trough type of subsidence events occurred in and around a larger commercial building constructed over an underground coal mine that was closed more than 50 years ago. The subsidence events caused many cracks on the building walls, deformations inside the building (marked in Figure 12), tearing on building roof and unevenness in the parking lots. The occurrence of the subsidence events was reported to coincide with a dewatering effort from the closed underground coal mine. After the subsidence events, relative elevation surveys were performed inside and in the vicinity of the commercial building. The measured final “subsidence” is calculated assuming that the paved floor or top of foundation at the time of construction be perfectly level and any vertical deviation from such level plane is considered as subsidence. The measured “subsidence” data and the estimated contour plot of the “subsidence basins” are shown in (Figure 12).
Figure 12: Observed structural damages and measured “Subsidence”.

Two localized subsidence basin bottoms are located, one near the northeast corner and another near the southwest corner of the building with their maximum subsidence being 1.0 and 1.3ft (305 and 396mm), respectively. In the underground room and pillar mine, secondary mining was performed to extract the coal seam between 4.60 and 6.13ft (1.40 and 1.87m) in thickness. The pillar split operation inside the production panels resulted in rows of thin pillars as shown in (Figure 13). The widths of the thin pillars varied from 11 to 32ft (3.35 to 9.75m) with the average being 20.6ft (6.28m). The overburden depth at the site ranges from 230 to 240ft (70 to 73m). The immediate roof of the coal seam is medium to moderately hard shale while the immediate floor of the coal seam is mudstone between 1 and 3ft (305 and 914mm) in thickness.
Figure 13: Overlay of available mine map with the surface structures and the pillars studied.

Three rows of split pillars in the production panel, numbered as
1 to 26 shown in (Figure 13), have been selected for analyzing their
stability under the following six different conditions that represent
the progression that the mine structures in the mine experienced
through:
a) Newly mined with coal in-situ strength si= 900psi (6.2MPa),
no mine water
b) Weathered pillars with si= 800psi (5.5MPa), no mine water
c) Water above coal seam hw=220ft (67m), si=800psi (5.5MPa),
no floor softening
d) Water head hw=220ft (67m), aged pillar si=700psi (4.8MPa),
no floor softening
e) Water head hw=220ft (67m), si=700psi (4.8MPa), mudstone
floor softened
f) Water withdrawn, si=700psi (4.8MPa), mudstone floor
softened
The 220 ft (67m) water head is based on the water surface level
in the natural water pond located below the high area where the
commercial building was constructed. When the mudstone floor
(assuming to be 3ft or 0.91m in thickness) is softened, an approach
similar to that shown in (Figure 7) is used to determine the effective
load bearing area of the pillars. A mining height of 5.25ft (1.6m)
is used in the analyses. The determined stability factors of the six
representative pillars located under the building are listed in (Table
4). It shows the effects of both pillar weathering/aging and floor
softening effects on the stability of the pillars.
Table 4: Determined stability factors for selected pillars under different conditions.

The simulation shows that before the mine was flooded as
conditions 1 and 2, the average pillar stability factors are 2.68
and 2.38 for the in-situ coal strengths of 900 and 800psi (6.2 and
5.5MPa), respectively. When the mine was flooded but the mudstone
floor was not softened (conditions 3 and 4), the average stability
factors are actually larger than before even as the coal pillars were
aged as further reduction in coal strength to 700psi (4.8MPa).
However, when the mudstone floor was softened and mine was
flooded which should be the likely condition (5) existed the longest
time at this site, the average pillar stability factor decreases to 1.31,
but adequate for not producing subsidence sources in mine level. As
the water in the mine was withdrawn and the hydrostatic pressure
disappeared (condition 6), the average pillar stability factor
becomes 0.93. Among the six selected pillars, pillar 8 (marked in
red in Figure 13) has the smallest stability factor at 0.63.
The stability factors of pillars 7, 16 and 17 are also below
1.0 and pillars 6 and 15 have stability factors slightly larger than
1.0. Therefore, as pillar 8 fails first, the load it previously carried
would be transferred to those critically loaded neighboring pillars
causing them to fail subsequently. The cascading failure process
would continue until it meets the panel barrier, or the large
and unsplit pillars. It should be noted that the center of the east
subsidence basin in (Figure 12) is located immediately above pillar
8 in (Figure 13). Based on the analyses performed for this case, it
shows that mine water plays dual roles in causing and preventing
surface subsidence. The water weakening effect to the mudstone
floor considerably reduced the pillar stability. However, due to the
shallow overburden, even with the water-softened floor, the mine
structures remained stable for many decades without causing
surface subsidence at the site. The water withdrawal induced the
necessary triggering force for the cascading pillar failure process in
the mine that resulted in the subsequent surface subsidence events.
Conclusion
Presence of high water in closed underground coal mines is almost unavoidable and needs to be carefully considered in subsidence investigation over such mines. This is particularly true when non-durable strata are presented in the mine level (i.e., mine floor, pillars and roof). The mechanisms for mine water to cause and to prevent surface subsidence events are discussed. Mechanical models are also proposed for quantifying the mine water’s effects on reducing or enhancing the stability the mine structures. Two subsidence cases in the paper are used to demonstrate the applications of the proposed mechanical models in the investigations. The analyses show that mine water can greatly weaken the non-durable strata present in the mine level and then potentially lead to mine structural failure and subsequently surface subsidence events. However, the hydrostatic pressure associated with high mine water in the mine can also help preventing surface subsidence to some degree. Withdrawal of the water in a mine where many of the pillars or roof are already critically loaded can lead to failure of these pillars and roof-leading to possible surface subsidence.
References
- Shahien M (2006) Characterization of a swelling claystone: Physical, mineralogical and mechanical properties. Proceeding second International Conferences on Problematic Soils.
- Richardson DN, Timothy TW (1990) Shale durability rating system based on loss of shear strength. Geotechnical Engineering 116(12): 1864-1880.
- Hendron AJ, Mesri G, Gamble JC, Way G (1969) Compressibility characteristics of shales measured by laboratory and in situ ASTM Winter Meeting on Determination of the In-situ Modulus of Deformation of Rock.
- Jiang Q, Cui J, Feng XT, Jiang Y (2014) Application of computerized tomographic scanning to the study of water-induced weakening of mudstone. Bulletin of Engineering Geology and the Environment 73: 1293-1301.
- Lashkaripour GR, Ajalloeian R (2000) The effect of water content on the mechanical behavior of fine-grained sedimentary rocks. ISRM International Symposium 13(1): 12-20.
- Marino GG, Choi SH (1988) The effect of softening on the bearing capacity of mine floors. Proc America Society of Mining and Reclamation, pp. 459-482.
- Chugh YP (1990) Workshop on design of coal pillars in room-and-pillar mining. Department of Mining Engineering, Southern Illinois University, USA, pp. 1-71.
- Peng SS (1986) Coal mine ground control. (2nd edn), John Wiley and Sons Inc, USA.
- Merwe VDH (1964) The prediction of heave from the plasticity index and percentage clay fraction of soils. The Civil Engineer in South Africa, Institute of Civil Engineers, South Africa, 6: 103-116.
- Zhang CL, Wieczorek K, Xie ML (2010) Swelling experiments on mudstones. J Rock Mechanics and Geotechnical Engineering 2(1): 44-51.
- Luo Y, Yang J (2018) Effects of dewatering flooded abandoned room and pillar mines on surface subsidence. Mining Engineering 70(6): 45-50.
- Zhao J, Undated Lecture Notes, Rock Mechanics for Civil Engineers, Swiss Federal Institute of Technology, Lausanne, Switzerland.
- Luo Y (2015) A design tool for improving safety of highwall mining operations. 2015 SME Transactions 338: 77-86.
© 2021 Yi Luo. This is an open access article distributed under the terms of the Creative Commons Attribution License , which permits unrestricted use, distribution, and build upon your work non-commercially.
Editor In Chief


.jpg)


Signup for Newsletter

Quick Links
 Editorial Board Registrations
 Submit your Article
 Refer a Friend
 Advertise With Us
Our Recent Edition

.jpg)


Top Editors


.jpg)


.bmp)
.jpg)
.png)
.jpg)


.jpg)


.png)

.png)


.png)


Financial Support

Sponsors

Latest e-Books

Latest Video

 a Creative Commons Attribution 4.0 International License. Based on a work at www.crimsonpublishers.com.
Best viewed in
a Creative Commons Attribution 4.0 International License. Based on a work at www.crimsonpublishers.com.
Best viewed in