- Submissions

Full Text
COJ Reviews & Research
Hydrocarbon Source Rock Potential Evaluation of the Paleozoic-Mesozoic of Punjab Platform, Pakistan: A Geochemical Approach
Syed Bilawal AS1* and Manabendra Nath2
1Department of Geology, University of Malaya, Malaysia
2Department of Geology, Gurucharan College, India
*Corresponding author: Syed Bilawal AS, Department of Geology, University of Malaya, Malaysia
Submission: September 19, 2022; Published: October 17, 2022

ISSN 2639-0590Volum4 Issue3
Abstract
The hydrocarbon source rock potential of three formations encountered in Bijnot well, in Punjab platform was investigated using TOC and Rock-Eval pyrolysis measurements. Analysis was performed on sixteen well and core cutting samples of Shinwari, Datta and Khewra formations. Shinwari Formation consists of three distinct units, namely the upper (marl and limestone) middle (sandstone and clay) and lower (limestone and shale). Shinwari Formation have fair TOC 0.54-0.62 wt.%, as indicated by HI vs Tmax plot and lies in mature zone with kerogen Type III. The Datta Formation consists of sandstone and claystone lies in mature zone and having fair TOC 0.60-1.09 wt.%. Genetic potential is insignificant 0.67-1.05mg HC/g rock, low HI values falls in Type III kerogen. The Khewra Formation consists of sandstone with thin claystone beds and have a good TOC 0.80-1.38 wt% at 1630-1641m depth, and fair TOC 0.57wt% at 1710m depth. The HI vs OI and HI vs Tmax plots indicate Type III and mix Type II-III kerogen, having Tmax 441-448 °C and lies. Oil and gas prone mature zone. Based on analysis performed the Khewra Sandstone Formation sediments have poor generative potential.
Keywords: Punjab platform; Bijnot; Geochemical; Rock-Eval; Tmax
Introduction
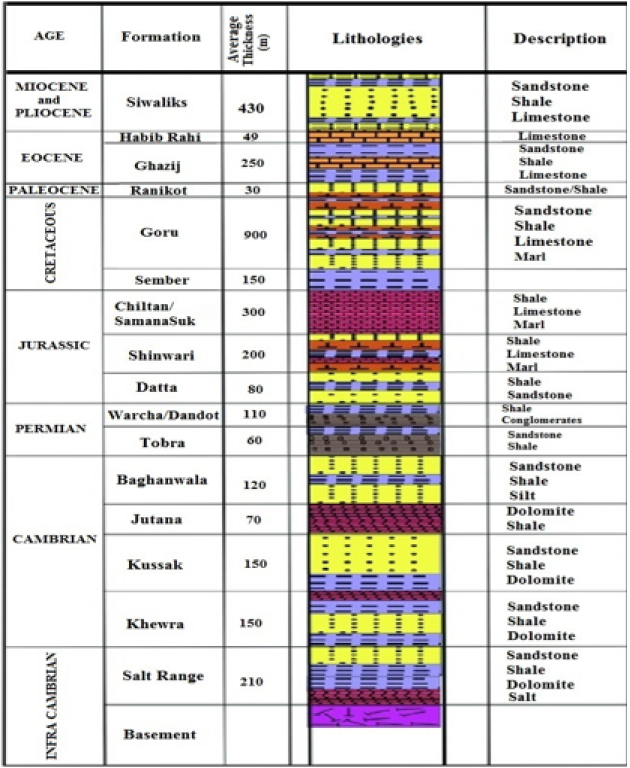
The Punjab platform located in the Middle Indus Basin (MIB) is westward dipping monocline covered by alluvium. MIB has been divided into three units Sulaiman Fold Belt, Sulaiman Depression and Punjab Platform [1]. In MIB is the least deformed part and is dipping gently towards Sulaiman Depression. The Punjab platform is bounded towards north by Sargodha High and south by Mari High, from west Punjab platform merges into Sulaiman depression and in east it extends into Bikaner-Nagaur of India [2]. In this region gas have been produced from these recognized source rock with kerogen Type III and mix Type II-III [3]. In the region three gas fields have been explored in the infra-Cambrian sediments in the region having TOC up to 30% and ranging from 0.80-4% wt.%, [4]. As not much data is available regarding the source rocks of Punjab Platform, and the formations present in southern part of the basin is comparable with Potwar Basin. In the Potwar basin, the major source rocks are Patala Shale, Datta, Shinwari, Hangu, Lockhart and Khewra formations. [4,5], these formations are also present in the study area which influenced this study (Table 1). Of late, there has been a discovery of a gas field in the Punjab Platform nearby the Panjpir Oilfield. The present study tries to interpret and investigate source rock maturity, kerogen type and organic richness for future hydrocarbon exploration and to investigate the source rock potential of proven source rocks formations in other parts of the basin. In this study sixteen well cutting samples of Shinwari, Datta and Khewra formations have been investigated.
Table 1: Stratigraphic column developed from Bijnot Well A (modified after Kadri, 1995; Shah and Shah, 2021; Shah, 2009).
Geological background
The Indian Plate started to rift in Late Proterozoic from Supercontinent Gondwanaland [6] and resulted in sediment deposition of Infra-Cambrian over Precambrian. Because of dragging of Infra-Cambrian strata the second phase of rifting in Punjab Platform is not evidently observable, however the evidence of rifting can be seen on reflectors of seismic profile where in terms of petroleum exploration Punjab Platform has received much more attention due to discovery of various gas and a recent oil field discovery in nearby field in neighboring country India on this Platform [1]. The studied samples are from Jurassic succession in Pakistan mainly represented by limestone, shale and sandstone (Table 2). The stratigraphic succession of the Punjab platform shows mainly marine Paleozoic-Cenozoic rocks of chemical precipitates (carbonates) and clastic origin. The Punjab Platform and Potwar Basin stratigraphy (most of the formations) of Early Triassic age are similar, in southern part stratigraphy of both Punjab platform and Potwar Basin is similar of ages Late Triassic and onwards [7].
Table 2: Paleocene Ranikot Formations was assessed for source rock potential at well A Bijnot, Fort Abbas, the measured values are shown in Table 2.

Material and Methods
From well A in Bahawalpur, Punjab Platform a total of 16 samples have been used i.e., eleven drill cutting samples out of which 04, 07 and 05 are of Shinwari Formation, Datta formations, and Khewra Formation, respectively. Samples were obtained at 10-30 meters interval, the interval was already set by the drilling company and were used with the same interval, samples were of Jurassic and Early-Cambrian ages. Samples details are available in (Table 3). Samples were washed thoroughly with water and then dried, crushed and were subjected to pass through 80m mesh sieve. The crushed samples were subjected to Total Organic Carbon (TOC) analysis, and after TOC analysis the samples were further subjected to Rock-Eval measurements, using Rock-Eval VI apparatus by following Peters [8]. In a helium atmosphere the samples of 100mg were pyrolized for 4mins at 300 °C, followed by programmed pyrolysis at 25 °C per min from 300-550 °C. For evolved hydrocarbons monitoring Flame Ionization Detector (FID) was used [9].
Table 3: TOC and Rock-Eval pyrolysis data of all three formations.
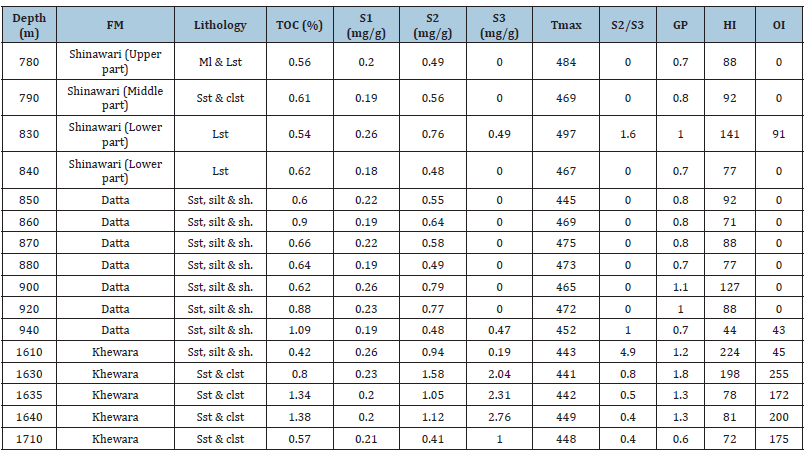
TOC: Total Organic Carbon, wt.% HI: Hydrogen Index = S2 x 100/ TOC, mg HC/g TOC S1: Volatile Hydrocarbon (HC) content, mg HC/g rock S2: remaining HC generative potential, mg HC/g rock S3: Carbon dioxide yield, mg CO2/ g rock Tmax: Temperature at maximum S2 peak GP: Genetic potential OI: Oxygen Index = S3 x 100 / TOC, mg CO2/g TOC.
During isothermal pyrolysis at 300 °C from volatilization of free hydrocarbons the first peak S1 was obtained. S2 the second peak which represents hydrocarbons generated by thermal cracking of kerogen during pyrolysis at 300-500 °C. The third peak S3 which represents CO2 generated from one gram of rock during pyrolysis were analysed by Thermal Conductivity Detector (TCD). Following Shah et al. [10], and Fazeelat et al. [11] maturity and type of organic matter were interpreted. The TOC measurements of rocks were determined by utilizing Leco CR-12 carbon determinator at Hydrocarbon Development Institute of Pakistan (HDIP). To remove carbonate the crushed samples of 100g were treated with 6N HCL and were combusted at 1200 °C in O2 atmosphere. By Thermal Conductivity Detector (TCD) CO2 amount were measured [12].
Results and Discussion
Total organic carbon content and Rock-Eval pyrolysis
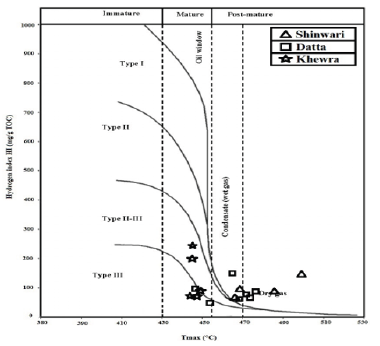
Shinwari Formation has three marginally different lithologic units, the upper unit (from 745-785m depth) consists of marl and limestone, the middle unit (from 790-830m depth) consists largely of sandstone and clay streaks, and the lower unit (from 830-840m depth) consists of limestone and shale [13]. The upper and lower unit have fair TOC ranging between TOC 0.54-0.62 wt.%. From pyrolysis measurements the values of S2 of analysed samples are in poor potential range, ranging from 0.48-0.76mg HC/g rock. These values lie below the standard acceptable values of a source rock hydrocarbon generative potential according to the classification by Peters [8] and indicated by S2 vs TOC plot (Figure 1). The sediments have poor genetic potential and lies in mature zone as indicated by HI vs Tmax plot, the kerogen is Type III. However, the Datta Formation has low is organic content. TOC ranging between 0.60- 1.09wt.%. From pyrolysis measurements the values of S2 indicates poor potential, ranging from 0.48-0.79mg HC/g rock, these values also lie in the below standard acceptable values [14]. The formation has poor potential as indicated by S2 vs TOC plot (Figure 1). Low HI values and HI vs Tmax plot indicates Type III kerogen. Two of the samples of Datta Formation lies in mature zone and five samples lies in post-mature. The genetic potential of the formation is also insignificant 0.67-1.05mg HC/g rock.
The Khewra Formation is mainly composed of sandstone with thin beds of claystone, having fair to good TOC, ranging between 0.57-1.38wt.%. From pyrolysis measurements the S2 ranges from 0.41-1.58mg HC/g rock. And poor to fair potential as indicated by S2 vs TOC plot (Figure 1). HI vs OI (Figure 2) and HI vs Tmax plot (Figure 3) indicates predominantly Type III and mix Type II-III kerogen and having Tmax 441-448 °C, the sediments lie in mature zone as indicated by HI vs Tmax plot (Figure 3) i.e., oil and gas prone also supported by S2/S3 values. The genetic potential of the formation is at marginal 1.24mg HC/g rock. This indicates that gas is expected to have been produced by Khewra Formation as indicated by various plots of HI vs Tmax and is also supported by the Tmax temperature range which lies in gas producing zone. The investigation of Shinwari and Datta formations sediments shows poor generative potential for oil, which is indicated by S2 values which are ranging from 0.48-0.79mg HC/g rock and low HI values ranging from 44-141HC/g TOC (Table 2) and have OI values ranging from 43-91mg CO2/g TOC (Table 2), having predominantly kerogen Type III as indicated by HI vs OI plot and HI vs Tmax plot. Two of Datta Formation sediments lies in maturity zone however rest of the sample lies in post-mature zone. The analysis of Shinwari and Datta formations shows poor generative potential for oil and gas. However, Khewra Formation sediments lies in mature zone, having predominately Type III and mix Type II-III kerogen, the S2 vs TOC plot shows poor to fair generative potential for oil and gas which is also supported by S2/S3 values.
Figure 1:Pyrolysis S2 versus Total Organic Carbon (TOC) plot displaying source rock generative potential [8].
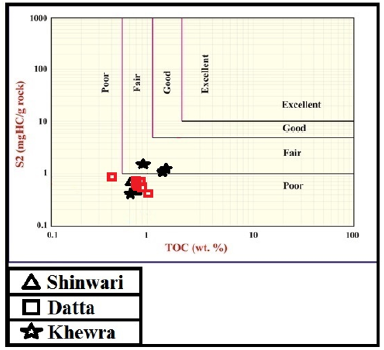
Figure 2:Plot of HI versus OI showing type of organic matter of analysed samples.
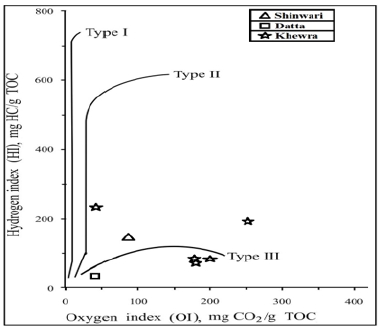
Figure 3:HI versus Tmax displaying thermal maturity and kerogen quality of the analysed samples.
Acknowledgement
The authors are thankful to the Directorate General Petroleum Concession, Pakistan (DGPC) for the provision of data, OGDCL for providing the samples, and University of Malaya for laboratory analysis.
References
- Aadil N, Sohail GM (2014) 3D geological modelling of Punjab Platform, middle indus basin pakistan through Integration of wireline logs and seismic data. Journal of the Geological Society of India 83(2): 211-217.
- Kadri IB (1995) Petroleum geology of Pakistan. Pakistan Petroleum Limited publishers 1: 25-226.
- Wandrey CJ, Law BE, Shah HA (2004) Patala-Nammal composite total petroleum system, Kohat-Potwar geologic province, Pakistan. US Geological Survey 1: 1-18.
- Peters KE, Clark ME, Das Gupta U, McCaffrey MA, Lee CY (1995) Recognition of an infracambrian source rock based on biomarkers in the Baghewala-1 Oil, India. American Association of Petroleum Geologists Bulletin. 79(10): 1481-1494.
- Shah SBA (2022) Evaluation of organic matter in Sakesar and Patala formations in southern and northern Potwar Basin, Pakistan. Petroleum Science and Technology.
- Shah SBA, Abdullah WH (2017) Structural interpretation and hydrocarbon potential of Balkassar oil field, eastern Potwar, Pakistan, using seismic 2D data and petrophysical analysis. Journal of the Geological Society of India 90(3): 323-328.
- Shah SBA, Shah SHA (2021) Hydrocarbon generative potential of cretaceous and Jurassic deposits in the ahmedpur east oilfield subsurface, Punjab platform, Pakistan. Journal of the Geological Society of India 97(8): 923-926.
- Peters KE, Cassa MR (1994) Applied source rock geochemistry. In: Magoon LB, Dow WG (Eds.), The Petroleum System - From Source to Trap. American Association of Petroleum Geologists Memoir 60: 93-120.
- Bernard BP, Welte DH (1984) Petroleum formation and occurrence. Springer Berlin 2: 25-140.
- Shah SBA (2021) Lockhart formation provides source rocks for Potwar Basin. Oil & Gas Journal 119(8): 22-28.
- Fazeelat T, Jalees MI, Bianchi TS (2010) Source rock potential of eocene, paleocene and Jurassic deposits in the subsurface of the potwar basin, northern Pakistan. Journal of Petroleum Geology 33(1): 87-96.
- Espitalié J, Laporte JL, Madec M, Marquis F, Leplat P, et al. (1977) Rapid method for characterizing source rocks, their petroleum potential and their degree of evolution. Journal of the French Petroleum Institute 32: 23-42.
- Shah SBA, Abdullah WH (2016) Petrophysical properties and hydrocarbon potentiality of Balkassar well 7 in balkassar oilfield, potwar plateau, Pakistan. Bulletin of the Geological Society of Malaysia 62: 73-77.
- Shah SBA, Abdullah WH, Shuib MK (2019) Petrophysical properties evaluation of Balkassar oilfield, Potwar Plateau, Pakistan: implication for reservoir characterization. Himalayan Geology 40(1): 50-57.
© 2022 Syed Bilawal AS. This is an open access article distributed under the terms of the Creative Commons Attribution License , which permits unrestricted use, distribution, and build upon your work non-commercially.
 a Creative Commons Attribution 4.0 International License. Based on a work at www.crimsonpublishers.com.
Best viewed in


.jpg)


 Editorial Board Registrations
 Submit your Article
 Refer a Friend
 Advertise With Us
.jpg)


.jpg)


.bmp)
.jpg)
.png)
.jpg)


.jpg)


.png)

.png)


.png)


