
- About Us
- Information
-

The Author ensures that the research has been conducted responsibly and ethically with adherence to all relevant regulations. read more..
- For Authors
- For Reviewer
- Manuscript Guidelines
- Membership
- Publication Ethics
-
- Journals
- Reprints
- e-Books
- Videos
- Policies
- Contact Us
 COVID-19
- Submissions


Full Text
COJ Reviews & Research
Epidemiological Nonlinear Modeling of Middle East Respiratory Syndrome Coronavirus in Saudi Arabia Using Homotopy Perturbation Method
Padma.S1 , Gomathi.A2, Rajendran.L1*
1Department of Mathematics, AMET Deemed to be University, Chennai, Tamilnadu, India.
2Department of Science and Humanities, Hindusthan College of Engineering and Technology, Coimbatore, Tamilnadu, Chennai.
*Corresponding author: Rajendran.L, Department of Mathematics, AMET Deemed to be Univeristy, Chennai, India.
Submission: February 17, 2022; Published: March 15, 2022

ISSN 2639-0590Volum3 Issue5
Abstract
Middle East Respiratory Syndrome (MERS) is a viral respiratory disease caused by a coronavirus transmitted to humans by infected dromedary camels. It is a zoonotic virus transmitted between animals and people, and it is contactable through direct or indirect contact with infected animals. The very first case remained isolated in the Kingdom of Saudi Arabia (KSA) in 2012, and after that, MERS-covid exhibited outbreaks in several regions of the world. In this communication, we propose a mathematical model to analyze the transmission rate of this virus and remedial measures to reduce the transmission rate by applying the Homotopy Perturbation Method.
Keywords: Mathematical modeling; Middle east respiratory syndrome; Nonlinear differential equations; Homotopy perturbation method
Introduction
Since 2012, many countries have reported cases of MERS, including Algeria, Austria, Bahrain, China, Egypt, France, Germany, Greece, Islamic Republic of Iran, Italy, Jordan, Kuwait, Lebanon, Malaysia, the Netherlands, Oman, Philippines, Qatar, Republic of Korea, India, Kingdom of Saudi Arabia, Thailand, Tunisia, Turkey, United Arab Emirates, United Kingdom, United States, and Yemen [1-3]. This virus’s most common symptoms include fever, severe cough and shortness of breath. Some people also had diarrhea and nausea [4-8].
The virus uses its spike proteins as pro inflammatory adhesive factors for entering into the host through a specific receptor called Dipeptidyl Peptidase-4 (DPP4). This receptor is considered a critical factor in the motioning and activation of the developed and essential immune responses in infected patients. Using potent antigens in combination with solid adjuvant may effectively trigger the activation of specific MERS- covid cellular responses as well as the production of neutralizing antibodies. Regrettably, to date, there is no effective approved treatment or vaccine for MERS-covid [2,3]. The means of transmission to humans is not completely defined yet. Still, evidence proposes that MERS-covid can be transmitted to humans via both animals and humans, spreading among people in close contact. Transmission has also been observed from infected patients to healthcare personnel. Camels and bats are known as natural hosts, and evidence of camel to human transmission has been reported [4].
Corona virus’s virions are roughly spherical with a moderate degree of Pleomorphism [5]. The cube-like or petal-shaped spikes emerge from the virion surface as stalks with a bulb-like distal terminus. The mean particle diameter is 118- 136nm, including the contributions of the spikes, which projects 16-21nm from the virion envelope [6,7]. Coronaviruses have helically symmetric nucleocapsids, which consist of a canonical set of 4 major structural proteins: the Spike (S), Membrane (M) and Envelope (E), which are located in the membrane envelope and the Nucleocapsid (N) protein which is found in the ribonucleoprotein core.
A vast number of mathematical models have been proposed to understand the dynamics of the coronaviruses. Many researchers study the SIS, SIR and SEIR models to investigate the dynamics of the corona viruses [8-12]. This paper’s proposed a model that investigates the dynamics of the MERS-covid via the Homotopy Perturbation method [13-17] (Figure 1).
Figure 1: Schematic diagram of the MERS-Covid.

Mathematical Formulation of the Problem
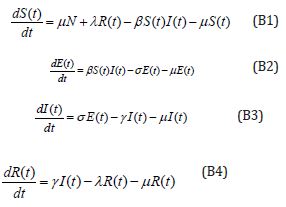
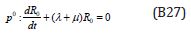
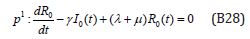
Several models have been projected as tools to recognize epidemics. This section focuses on the SEIR model framework for camel-to-camel transmission [8]. We use the SEIR model to understand the spread of infectious diseases. The SEIR model is one of the epidemiological models. It groups the overall population into distinct sub-populations: a susceptible population S, an exposed population E, an infected population I, and a recovered population R. We make several further simplifying assumptions. We describe the epidemic model of nonlinear differential equations as follows [13]:
Initial conditions are [13]
S (0) = s0=0.79508, E (0) =e0=0.003552, I (0) =i0=0.003552, R (0) =r0=0.197815 (5)
where β is the transmission rate, μ is the natural death and birth rates, N is the population size of camels, σ and γ are rate at which infected camels change status from exposed to infectious and from infectious to recovered respectively. λ is the rate at which recovered camels lose immunity protection due to multiple factors, such as the evolution of the virus, natural loss of immunity [14,15], imports of susceptible juvenile camels, and exports or consumption of recovered adult camels. Susceptible camels could also be exported and consumed for meat. We assumed that the replacement of susceptible camels would be immediate, we also assumed no export or consumption of infectious camels, which is acceptable if the frequency, is less than 10%. The total population size of dromedary camels is assumed to be constant at 2, 70, 000 and the study period went from 1 January 2014 to 31 May 2016 [13,18].
Result and Discussion
So many authors have applied the stated method to various non-linear problems and demonstrated the efficiency of the HPM. Using the Homotopy Perturbation Method (refer to Appendix A), we obtained the approximate solutions of the eqns. (1)-(4) as follows:
Numerical Simulation
We execute numerical simulations of MERS model (1)-(4), for which we use a set of logical parameter values. The simulation is performed using graphmain3 solver written in MATLAB programming. Eqns. (6)-(9) is very closed expressions for the models Eqns. (1)-(4). We compared our analytical solutions obtained by HPM with the numerical simulation obtained by MATLAB software. To test the accuracy of our approximate analytical expressions, the system (1)-(4) is also solved numerically by using MATLAB for all possible values of parameters. The MATLAB program is also given in Appendix B.
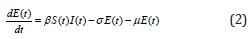
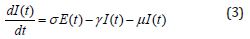
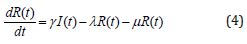
The Homotopy Perturbation method (HPM) was applied to obtain the analytical solution of MERS-covid among dromedary camels in Saudi Arabia, given in the Mathematical model of the first-order nonlinear differential equation. (Figure 2-6) shows the comparison of analytical and numerical solutions. Figure 3 shows that the number of sensitive cases increases when (N) increases. In addition, we can study that HPM provides better accuracy and effective results for various values of parameters. Furthermore, we may wrap up a significant decrease in the spread of the virus when direct or indirect contact with infected animals decreases.
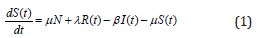
Figure 2: Comparison of our analytical expression of SEIR with the numerical result for the various values of the parameters using eqs.(6)-(9).

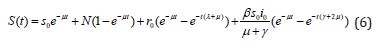
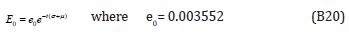
Figure 3: Plot of our analytical expression of susceptible for the various values of the parameters, when s0=0.79508, e0=0.003552, i0 0.003552, r0=0.197815, β=200, and γ=3 using equation (6).

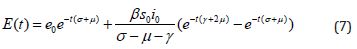
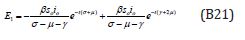
Figure 4: Plot of our analytical expression of exposed for the various values of the parameter when s0=0.79508, e0=0.003552, i0=0.003552, r0=0.197815, β=200, and μ=3 using eq.(7).

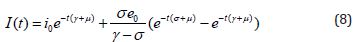
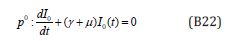
Figure 5: Plot of our analytical expression of infected for the various values of the parameters, when s0=0.79508, e0=0.003552, i0=0.003552, r0=0.197815, β=200, γ=0.3 and μ=0.1 using eq.(8).

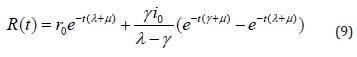
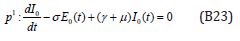
Figure 6: Plot of our analytical expression of infected for the various values of the parameters, when s0=0.79508, e0=0.003552, i0=0.003552, r0=0.197815, β=200, γ=0.25 and μ=0.09 using eq. (9).

Conclusion
This study examined the transmission rate of MERS-covid and preventive measures using the SEIR model with minimizing the direct and indirect contact of infected camels as a remedial action from the ODE system using the Homotopy Perturbation Method. Based on the information presented above, we can observe that the waves followed the waves in camel cases in humans, which implies that camel cases have led to human cases, and by taking adequate measures to identify, diagnose and isolate infected dromedary camels, the transmission rate of MERS-covid may be reduced.
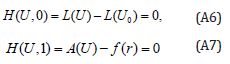
Appendix A: Basic concept of Homotopy Perturbation method (HPM)
To illustrate the basic ideas of this method, we consider the following nonlinear functional equation:
With the following boundary condition:
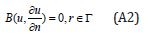
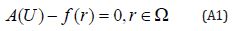
where A is a general functional operator, B a boundary operator, f (r) is a known analytical function and Γ is the boundary of the domainΩ . The operator A can be decomposed into two operators L and N, where L is linear, and N is nonlinear operator.
Eqn. (19) can be, therefore, written as follows:
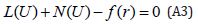
Using the Homotopy technique, we construct a Homotopy which U(r, p) :Ω×[0,1]→ R , satisfies:
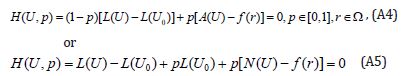
where p∈[0,1] is an embedding parameter, 0 u is an initial approximation for the solution of Eqn. (SA2), which satisfies the boundary conditions. Obviously, from Eqns. (A4) and (A5) we will have:
The changing values of p from zero to unity are just that of U(r, p) from u0(r) to u(r) .In topology, this is called homotopy. According to HPM, we can first use the embedding parameter p as a small parameter and assume that the solution of Eqns. (A4) and (S5) as a power series in p:
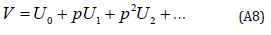
Setting p = 1, results in the approximation to the solution of Eqn. (A8)
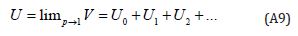
The combination of the Perturbation method and the Homotopy method is called the HPM; which has eliminated limitations of the traditional perturbation techniques. The series Eqn. (A9) is convergent for more cases (Table 1).
Appendix B: Analytical solution on nonlinear Eqns. (1)- (4) using Homotopy Perturbation Method (HPM).
Consider the differential equations
Initial conditions are
S (0) =0.79508, E (0)=0.003552, I(0)=0.003552, R(0)=0.197815 (B5)
The Homotopy form the Eqns. (B1) -(B4) can be constructed as follows:
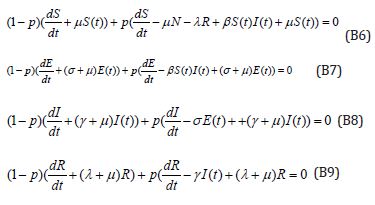
Where p is the embedding parameter and p∈[0,1] ,The approximate solution of (B5) and (B6) are
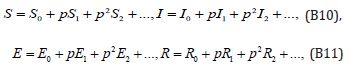
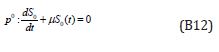
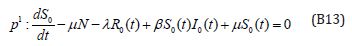
Substituting Eqns. (B10) and (B11) into (B6) - (B9), Comparing the coefficients of like powers of p in Eqn. (B6) gives:
The initial conditions are,

The solution of the Eqns. (B12) and (B13) are given by
 where
where 
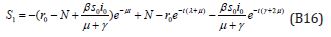
Comparing the coefficients of like powers of p in Eqn. (B7) gives:
The initial conditions are,
The solution of the Eqns. (B17) and (B18) are given by
Comparing the coefficients of like powers of p in Eqn. (B8) gives:
The initial conditions are,
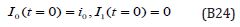
The solution of the Eqns. (B22) - (B23) are given by
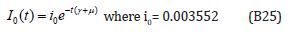
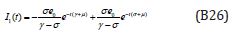
Comparing the coefficients of like powers of p in Eqn. (B9) gives:
The initial conditions are,
The solution of the Eqns. (B27) and (B28) are given by
Table 1: Nomenclature and Units.

Appendix C. Matlab program for the numerical solution of differential Eqns. (1) – (4)
function graphmain3
options= odeset(‘RelTol’,1e-6,’stats’,’on’);
X0=[1;1;1;1];
tspan=[0,3];
tic
[t,X]=ode45(@TestFunction,tspan,X0,options);
toc
figure
hold on
plot(t,X(:,1),’*’);
plot(t,X(:,2),’.’);
plot(t,X(:,3),’+’);
plot(t,X(:,4),’+’);
legend(‘x1’,’x2’,’x3’,’x4’,’x5’)
ylabel(‘x’)
xlabel(‘t’)
return
function [dx_dt] =TestFunction(t,x)
m=2; r=3; beta=0.01; N=2; y=0.1; e=1/2.
dx_dt(1) =m*N+y*x(4)-beta*x(1)*x(3)-m*x(1);
dx_dt(2) =beta*x(1)*x(3)-e*x(2)-m*x(2);
dx_dt(3) =e*x(2)-r*x(3)-m*x(3);
dx_dt(4) =r*x(3)-y*x(4)-m*x(4);
dx_dt = dx_dt’;
return
References
- Saed HZ (2016) Global research trends of Middle East respiratory syndrome coronavirus: a bibliometric analysis. BMC Infectious Diseases 16(1): 1-7.
- Mubarak A, Alturaiki W, Hemida MG (2019) Middle East respiratory syndrome coronavirus (MERS-CoV): infection, immunological response, and vaccine development. Journal of Immunology Research, Article ID: 6491738.
- Mortazavi HS, Monavari SH, Ataei Pirkooh A, Tavakoli A (2014) Middle east respiratory syndrome coronavirus (MERS-CoV): A review article. Iranian Journal of Virology 8(2): 59-68.
- Al-Asuoad N, Rong L, Alaswad S, Shillor M (2016) Mathematical model and simulations of MERS outbreak: Predictions and implications for control measures. Biomath 5: 1612141.
- McIntosh K (1974) Corona viruses: a comparative review. Current Topics in Microbiology and Immunology 63: 85-129.
- Bárcena M, Oostergetel GT, Bartelink W, Faas FG, Verkleij A, et al. (2009) Cryo-electron tomography of mouse hepatitis virus: Insights into the structure of the coronavirion. Proceedings of the National Academy of Sciences 106(2): 582-587.
- Neuman BW, Kiss G, Kunding AH, Bhella D, Baksh MF, et al. (2011) A structural analysis of M protein in coronavirus assembly and morphology. Journal of Structural Biology 174(1): 11-22.
- He S, Peng Y, Sun K (2020) SEIR modeling of the COVID-19 and its dynamics. Nonlinear Dynamics 101(3): 1667-1680.
- Ellison G (2020) Implications of heterogeneous SIR models for analyses of COVID-19 (No. w27373). National Bureau of Economic Research.
- Law KB, Peariasamy KM, Gill BS, Singh S, Sundram BM, et al. (2020) Tracking the early depleting transmission dynamics of COVID-19 with a time-varying SIR model. Scientific Reports 10(1): 1-11.
- Ng TW, Turinici G, Danchin A (2003) A double epidemic model for the SARS propagation. BMC Infectious Diseases 3(1): 1-16.
- Yu J, Jiang D, Shi N (2009) Global stability of two-group SIR model with random perturbation. Journal of Mathematical Analysis and Applications 360(1): 235-244.
- Lin Q, Chiu AP, Zhao S, He D (2018) Modeling the spread of Middle East respiratory syndrome coronavirus in Saudi Arabia. Statistical Methods in Medical Research 27(7): 1968-1978.
- Sabir JS, Lam TTY, Ahmed MM, Li L, Shen Y, et al. (2016) Co-circulation of three camel coronavirus species and recombination of MERS-CoVs in Saudi Arabia. Science 351(6268): 81-84.
- Meyer B, Juhasz J, Barua R, Gupta AD, Hakimuddin F, et al. (2016) Time course of MERS-CoV infection and immunity in dromedary camels. Emerging Infectious Diseases 22(12): 2171-2173.
- Biazar J, Ghanbari B (2012) The homotopy perturbation method for solving neutral functional–differential equations with proportional delays. Journal of King Saud University-Science 24(1): 33-37.
- Swaminathan R, Narayanan KL, Mohan V, Saranya K, Rajendran L (2019) Reaction/diffusion equation with michaelis-menten kinetics in microdisk biosensor: homotopy perturbation method approach. International Journal of Electrochemical Sciences 14: 3777-3791.
- Dighe A, Jombart T, Van Kerkhove M, Ferguson N (2019) A mathematical model of the transmission of middle East respiratory syndrome corona virus in dromedary camels (Camelus dromedarius). International Journal of Infectious Diseases 79(1): 1-150.
© 2022 Rajendran.L. This is an open access article distributed under the terms of the Creative Commons Attribution License , which permits unrestricted use, distribution, and build upon your work non-commercially.
Editor In Chief


.jpg)


Signup for Newsletter

Quick Links
 Editorial Board Registrations
 Submit your Article
 Refer a Friend
 Advertise With Us
Our Recent Edition

.jpg)


Top Editors


.jpg)


.bmp)
.jpg)
.png)
.jpg)


.jpg)


.png)

.png)


.png)


Financial Support

Sponsors

Latest e-Books

Latest Video

 a Creative Commons Attribution 4.0 International License. Based on a work at www.crimsonpublishers.com.
Best viewed in
a Creative Commons Attribution 4.0 International License. Based on a work at www.crimsonpublishers.com.
Best viewed in