- Submissions

Full Text
COJ Reviews & Research
The Future of the Field of Earthquake Forecasting, New Data Assimilation and Fusion Strategy, towards Timely Earthquake Prediction and Warning
Pierre-Richard Cornely* and Gerald T McNeil III
Department of Physics & Engineering, Eastern Nazarene College, USA
*Corresponding author: Pierre-Richard Cornely, Department of Physics & Engineering, Eastern Nazarene College, 23 East Elm Ave, Quincy, MA 02170, USA
Submission: June 12, 2018; Published: July12, 2018

ISSN 2639-0590Volume1 Issue3
Abstract
In 2016, Ecuador and Italy both experienced deadly earthquakes, with death tolls of over 800 people even with a commonly used earthquake prediction system in place. The seismometer system, which is the current system used in earthquake prediction, provided no help or warning of the devastating earthquakes that occurred. This method only looks at patterns of previous earthquakes to give the probability of an aftershock once the first earthquake occurs. The problem with this system is that it does not offer adequate notice to provide people time to evacuate the area before the initial devastation. There is a dire need for a dependable system that predicts earthquakes and gives people enough time to escape the disaster. Current research shows promising evidence of physical changes in the earth that happen perhaps even days before an earthquake occurs. This amount of notice could give people time to evacuate, and save countless lives. With the assimilation and fusion of electron measurements due to pressure build up in rocks, changes in water chemistry, pre-seismic tremors, magnetic field changes, and changes in air chemistry, the field of earthquake prediction comes closer to a more accurate way of making pre-earthquake disaster predictions with enough notice to possibly save hundreds of thousands of lives.
keywordsEarthquake Forecasting; Prediction; Disaster; Total Electron Content; Electric and Magnetic Fields
Introduction
During the course of an earthquake many physical changes occur in the earth’s crust causing waves to form in different patterns and direction: Primary or P-waves which shake in the earth in the direction in which they propagate, Shear or S-waves, which shake the earth perpendicular to the direction from which they propagate [1]. Love waves which shake the earth both perpendicular to and in the direction in which they propagate, and Rayleigh waves which shake the earth in elliptical patterns [2]. For many years, people have attempted to predict earthquakes by picking up P-waves on seismometers to see that an earthquake is about to occur, P-wave tremors are the first signals to reach seismographs and happen only shortly before an earthquake’s main event [3]. As a result, methods that rely on seismometers can send warnings only after an earthquake has already started which would allow only mere seconds warning in ideal conditions. There has also been evidence that P-waves are unreliable for predictions of earthquakes because of possible false data caused by man-made vibrations, lightning strikes, or lack of P-waves before the main event of an earthquake [4,5]. Progress in creating more sensitive seismographs could possibly allow detection of smaller waves in multiple directions possibly longer before the main earthquake strikes than current seismometers allow. Recent studies have shown that the earth has other measurable changes when an earthquake is going to occur even before any tremors begin. These changes likely occur due to pressure put on igneous rocks deep in the earth’s crust causing changes at the atomic level [6]. In the upcoming sections, we review several methods that are relatively new to the current literature and are still being researched in the field of earthquake forecasting.
Development
Earthquakes occur when two tectonic plates either slip against one another, pull apart from one another, or crash into one another. Currently, seismometers are used to measure P-waves from an already occurring earthquake to determine the direction in which the main event will go, this method has yet to warn of an earthquake’s approach more than a few seconds in advance. Though seismic measurements are still being investigated as possible earthquake predictors, there are several other changes that occur in the earth, as a result of an earthquake, which are being investigated for their use as earthquake predictors. Two major fields of study are The Total Electron Content (TEC) of the ionosphere, and water chemistry [7]. These changes likely occur because of shifting tectonic plates breaking unstable peroxy defects, as shown in Figure 1. Breaking peroxy bonds allows electrons to flow freely through igneous rocks. According to Freund [8], the electrical potential generated can travel far and wide. This would mean that the earth’s surface could be affected by these charges. The electrical potential generated by these charges can in turn create surface potentials and time changing Electric and Magnetic fields that travel far and wide, affecting every surface that comes in contact with these charges [8].
figure 1: Schematic representation of the break-up of a peroxy bond in a silicate matrix. Step I marks how the break-up of the dormant peroxy defect occurs. Step II marks the electron transfer from an O2− into the decoupled peroxy bond and the generation of an electron–hole pair (Freund, 2007).
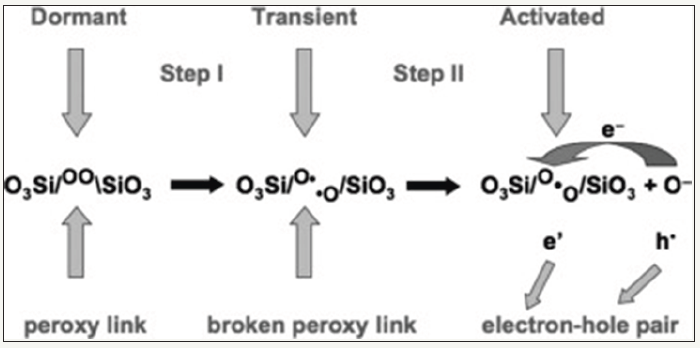
figure 2a: Images of simulations of Total Electron Content (TEC) over the 100 closest receivers to the epicenter of the earthquake a month before the earthquake (February 11, 2011) for four different time points. These points are from the same times of day as (A) the enhancement, (B) depletion, and (C-D) fluctuations. The X- and Y-axes represent the longitude and latitude, respectively (Hammerstrom & Cornely, 2016 Cornely & Hughes, 2018).
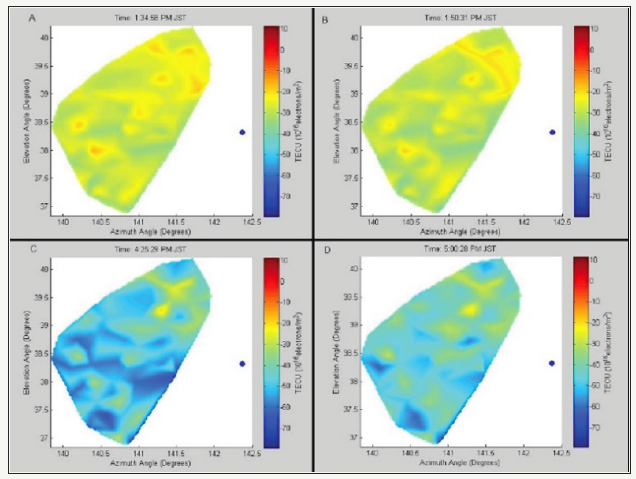
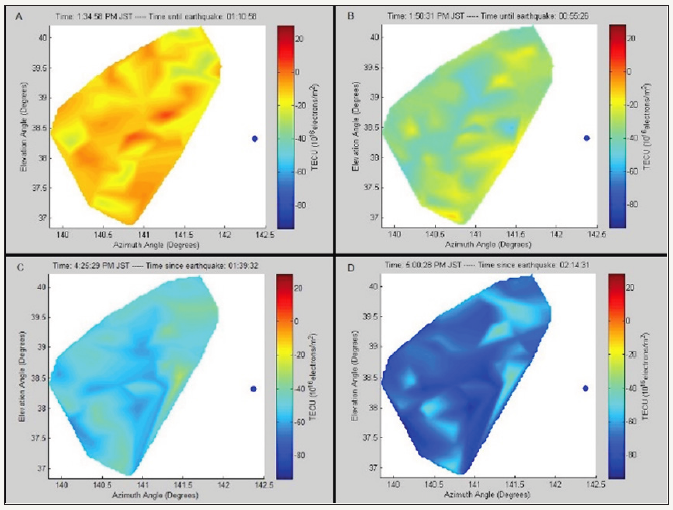
The Total Electron Content (TEC) of the ionosphere is commonly used to eliminate possible errors due to signal delay in GPS tracking [9] TEC data has recently been investigated as a possible earthquake forecasting tool. TEC data was examined from the day of the 9.1 magnitude earthquake which occurred in Japan on March 11th 2011 at 2:46 PM JST, as shown in Figure 2a & 2b. This data showed a spike in TEC an hour before the earthquake occurred, then a drop in TEC shortly before the earthquake and abnormal fluctuations in TEC values for several hours after the earthquake. Normally TEC over a given area would remain stable and any changes that occur will occur slowly and smoothly. Solar activities and magnetic storms, which can cause anomalies in TEC were studied on the days leading up to the earthquake and showed no significant events occurred the day of the earthquake, thus were not likely to have affected the TEC data [10,11].
figure 2b: Images of heat maps of Total Electron Content (TEC) over the 100 closest receivers to the earthquake epicenter on the day of the earthquake (March 11, 2011) at four different times. These times show (A) enhanced TEC, (B) a sudden depletion, and (C-D) the large fluctuations following. The X- and Y-axes represent the longitude and latitude, respectively. (Hammerstrom & Cornely, 2016 Cornely & Hughes, 2018).
Researchers are still investigating magnetic anomalies related to earthquakes. Some research suggests that magnetometers, which record changes in magnetic fields, have picked up disturbances in magnetic fields prior to earthquake main events [12]. However, other studies suggest that these anomalies were likely coincidental sensor errors, as other earthquakes have not had the same effect on magnetometers since that event [13]. Data on magnetic anomalies is difficult to collect, it requires expensive equipment to be placed near the epicenter of an earthquake, and it must be collecting data before, during, and after an earthquake. The fact that we are unable to predict where and when an earthquake will occur makes such magnetic data correlation data relatively rare, the only few cases of such recorded data occurred by coincidence, when a magnetometer happened to be located near the epicenter of an earthquake, collecting the rare data. Though difficult to record, researchers are developing more sensitive magnetometers to better record data from earthquakes [14].
Pre earthquake stress can crack igneous rocks deep in the earth which contain Uranium in significant quantities. Uranium breaks down into daughter product Thorium, Radium, and eventually Radon via alpha decay. Alpha decay is the release of an alpha particle, or helium nucleus, from an unstable radioactive atom which forms and atom of an element two atomic numbers lower [15]. Once Radon gas is formed, it becomes trapped inside of the igneous rocks until some force releases the trapped gas. Pre-seismic pressure on these igneous rocks can crack them, releasing the radon gas. Radon decays to form alpha particles and daughter products; polonium, bismuth, and lead sequentially, each of which also decay forming alpha particles. Specialized sensors which detect alpha particles, then collect data on all of the radioactive decay which could then alert to the possibility of an earthquake. Radon’s short half-life of 3.8 days and the fact that it is easily dispersed by wind and diffusion allows many readings in an area over several days. If the sensors frequently detect radon or its daughter molecules, there is a high likelihood of an earthquake [16].
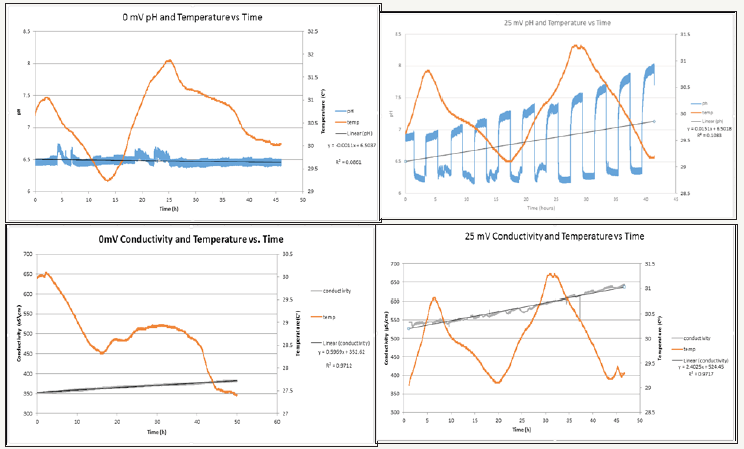
Water chemistry has been studied mostly in simulated earthquake conditions. Experiments reveal high stress induced on igneous rocks caused an electrical potential to form [17]. It is thought that this potential would cause chemical reactions in ground and well water when an earthquake occurs. Another study found anomalies in ion concentrations of water collected from local water shortly after an earthquake [18]. Modern technology allows for constant monitoring of water acidity and ionic changes with devices available to just about everyone. These chemistry sensors could be implemented for use in earthquake forecasting in the near future. One study simulated known electrical changes caused by pre-earthquake conditions in samples of collected pond water then measured chemical changes that occurred as a result of this simulated earthquake. This experiment found significant changes in both pH and conductivity values in the water when compared to control tests, as shown in Figure 3. The data collected also showed evidence that voltages that accumulate in and at the surface of igneous rocks due to pressure caused by tectonic activity, could be immediately detected by pH probes placed in water touching said rocks. Patterns in pH change and observed anomalies in collected data are being investigated for possible indication of earthquake magnitudes and time until earthquake’s main event, as shown in Figure 3 [19].
figure 3 pH and conductivity data from simulated earthquake conditions in comparison to their control tests. pH results show major drops every time voltage is applied which stop immediately as voltage is removed. There are also significant increases in pH and conductivity over time in the experimental tests (25mV) when compared to the controls (0mV) (McNeil & Cornely, 2017).
There is a lot of research currently being conducted hoping to combine several possible earthquake forecasting methods into one unique data assimilation and fusion platform for earthquake forecasting in order to eliminate possible errors due to other sources. Utilizing only one combined precursor to predict earthquakes allows for many failures due to many possible errors in data collection, and combining two or more different forecasting methods can eliminate many possible sources of data errors allowing for more accurate predictions [11].
figure 4 A Venn diagram comparing possible sources of error in three methods being researched for possible use in earthquake forecasting. If the normal alpha value of 0.05 is used for each method, then using all three together would give an alpha value of 0.000125, which is only a 0.0125% chance of a type I error.
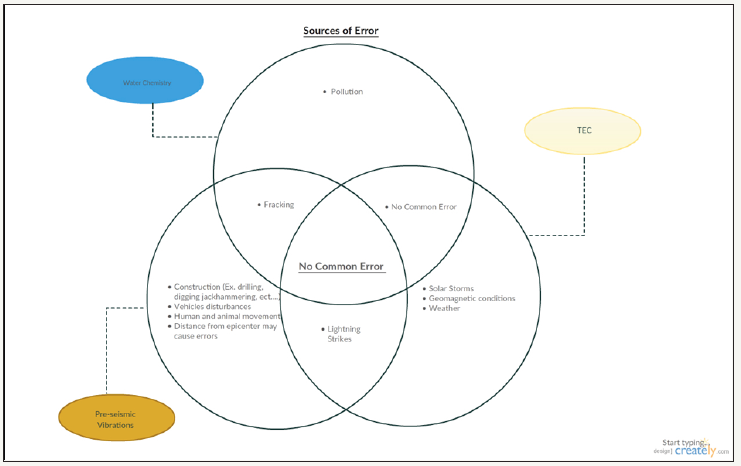
Figure 4 compares possible sources of error in TEC, Water chemistry, and pre- seismic vibrations. While some methods have overlapping sources of errors, when many methods are considered together, they do not share a possible error and therefore viewing the data fusion from all three could predict earthquakes with increased confidence. It is also shown that TEC and Water chemistry do not share a common source of error, reducing the number of data sources that share error sources, which could significantly reduce the cost of making such an earthquake predicting device [20].
Conclusion
Research in the field continues to find new and useful tools for reading the earth to detect warning signs of earthquakes. The possibility of collecting data to look for warnings of an impending earthquake is becoming more possible than ever before. With these advances in the field of earthquake forecasting, we may be very close to creating a functional warning system that gives ample time to save hundreds of thousands of lives.
References
- (2017) Seismic Waves Retrieved.
- Harkrider, David G (1964) Surface waves in multilayered elastic media, Rayleigh and Love waves from buried sources in multilayered elastic half-space. Bulletin of the Seismological Society of America 54(2): 627- 679.
- Allen RM, Gasparini P, Kamigaichi O, Bose M (2009) The Status of Earthquake Early Warning around the World: An Introductory Overview. Seismological Research Letters 80(5): 682-693.
- Kappus ME, Vernon FL (1991) Acoustic signature of thunder from seismic records. Journal of Geophysical Research 96(D6): 10989-11006.
- Lindh AG, Lockner DA, Lee WH (1978) Velocity anomalies: an alternative explanation. Bulletin of the Seismological Society of America 68(3): 721- 734.
- Scoville J, Sornette J, Freund FT (2015) Paradox of peroxy defects and positive holes in rocks Part II: Outflow of electric currents from stressed rocks. Journal of Asian Earth Sciences 114: 338-351.
- Balk M, Bose M, Ertem G, Rogoff DA, Rothschild LJ, et al. (2009) Oxidation of water to hydrogen peroxide at the rock–water interface due to stressactivated electric currents in rocks. Earth and Planetary Science Letters 283(1-4): 87-92.
- Freund FT (2007) Pre-earthquake signals – Part II: Flow of battery currents in the crust. Nat. Hazards Earth Syst. Sci 7(5): 543-548.
- Hagen JB (2009) Radio-Frequency Electronics: Circuits and Applications. Cambridge University Press.
- Hammerstrom JA, Cornely PJ (2016) Total Electron Content (TEC) Variations and Correlation with Seismic Activity over Japan. JYI 31(4).
- Cornely Pierre-Richard Jean (2017) Data Assimilation & Fusion Platform for Earthquake Forecasting.
- Fraser-Smith AC, Bernardi A, Mcgill PR, Ladd ME, Helliwell RA et al. (1990) Low-Frequency Magnetic Field Measurements Near The Epicenter Of The Ms7.1 Loma Prieta Earthquake. Geophysical Research Letters 17(9): 1465-1468.
- Thomas JN, Love JJ, Johnson MJ (2009) On the reported magnetic precursor of the 1989 Loma Prieta earthquake. Physics of the Earth and Planetary Interiors 173(3-4): 207-215.
- Katori Y, Okubo K, Hato T, Tsukamoto A, Tanabe K, et al. (2014) Evaluation of High-resolution.
- Larsen ES 3d, Gottfried D (1960) Uranium and Thorium in selected sites of igneous rocks. American Journal of Science 258-A.
- Jashank M, Gupta SJ, Nair J (2014) Development of Radon Gas Sensor to Monitor the Precursors of Earthquake. IOSR Journal of Engineering 4(1): 10-15.
- Takeuchi A, Lau BW, Freund FT (2006) Current and surface potential induced by stress-activated positive holes in igneous rocks. Physics and Chemistry of the Earth 31(4-9): 240-247.
- Chen Z, Du J, Zhou X, Yi L, Liu L, et al. (2014) Hydrochemistry of the Hot Springs in Western Sichuan Province Related to the Wenchuan M S 8.0 Earthquake. Scientific World Journal 2014: 901432.
- McNeil GT III, Cornely PJ (2017) Water Chemistry Changes and Correlation with Seismic and pre-earthquakes Activities. Journal of Young Investigators.
- Geomagnetic Field Observation System Using HTS-SQUID Magnetometer and its Application. AGU Fall Meeting Abstracts 1: p. 3864.
© 2018 Pierre-Richard Cornely. This is an open access article distributed under the terms of the Creative Commons Attribution License , which permits unrestricted use, distribution, and build upon your work non-commercially.
 a Creative Commons Attribution 4.0 International License. Based on a work at www.crimsonpublishers.com.
Best viewed in


.jpg)


 Editorial Board Registrations
 Submit your Article
 Refer a Friend
 Advertise With Us
.jpg)


.jpg)


.bmp)
.jpg)
.png)
.jpg)


.jpg)


.png)

.png)


.png)


