- Submissions

Full Text
COJ Robotics & Artificial Intelligence
Extractive Analytics in Higher Education: A Conceptual Framework
Ranjan Vaidya*
Department of Business Information Systems, Auckland University of Technology, Auckland, New Zealand
*Corresponding author: Asad Ullah, Assistant Professor, Middle East College, Muscat, Oman
Submission: March 13, 2024;Published: April 01, 2024

ISSN:2832-4463 Volume3 Issue4
Abstract
Research and teaching in higher education institutions have seen increasing use of information systems. Currently, the focus of data analytics is mainly on one stakeholder group, the students. The other important stakeholder groups that can benefit from big data analytics are the instructors and the management. Studies have also called for a more inclusive approach in using data analytics in higher education. Our study addresses these calls and focuses on the instructors and how analytics can reduce the workload of instructors. Specifically, we present two example situations in which analytics can help instructors. Based on the characteristics of these examples, we conceptualize a new type of analytics and call it extractive analytics. We further suggest that extractive analytics forms an analytical layer that is fundamental to analytics.
Keywords:Extractive Analytics; Higher Education; R Language; Research
Introduction
Research and teaching in higher education institutions have seen increasing use of information systems. These systems leave traces of data that can be analyzed for improving organizational knowledge [1]. Currently, the focus of data analytics is mainly on students, and student performance is the prime concern of the analytics [2]. Consequently, the research on the use of big data analytics in higher education also focuses heavily on one stakeholder group, namely, the students. The other relevant stakeholder groups that can benefit immensely from big data analytics are the instructors and the management. Studies have also called for a more proactive approach in using data analytics so that their potential can be exploited for increasing the overall efficiency of the higher education institutions [3,4].
Our study addresses these calls encompassing other stakeholders in the analytics and focuses on the instructors and how analytics can reduce the workload of instructors. Specifically, we present two example situations in which analytics can help instructors. Based on the characteristics of these examples, we conceptualize a new type of analytics and call it extractive analytics. We further suggest that extractive analytics forms an analytical layer that is fundamental to analytics.
Within higher education, the types of analytics are different than those used in other industries. For example, past literature mentions that descriptive, prescriptive, or predictive analytics have wide applications within higher education [1]. Information Systems Adoption studies of higher education also present these types of analytics as those widely used in the higher education sector [4]. However, not all higher education activities can be categorized in these categories. For example, one instructor-led activity in higher education is extracting the student marks from the marking rubrics. Extracting student marks does not involve any predictions or descriptions, yet common analytical languages such as R and Python can immensely facilitate these activities.
The main contribution of our paper is in discussing a new type of analytics specific to higher education that we term extractive analytics. We discussed the usefulness of extractive analytics for the instructors. Instructor focus is important given that use of analytics for improving organizational process efficiencies has been ignored [2]. Extractive Analytics refers to the use of analytical packages that help in extracting bulk data from different types of sources. These various data sources can be from the area of teaching as well as research. For example, within teaching student rubrics, and assessment documents such as assignments can be valuable data sources. Apart from teaching, the instructors also perform research activities, and meaningful information can also be extracted from the research papers for the literature review. Using the programming language R, we provide two examples of situations where extractive analytics facilitates the teaching and research activities of the instructor.
This paper is a short paper that discusses two situations and explains their R code. While doing so, the study proposes the concept of extractive analytics and present its characteristics. One of these uses cases is based on a student assessment activity, and the other relates to the research literature review. The remaining paper is structured as follows. The next section presents the two examples where extractive analytics is applied. This section is followed by a section that discusses the characteristics of extractive analytics and establishes this as an essential missing link in the current analytics frameworks [5,6]. Finally, we present conclusions.
Teaching situation: extracting marks from marking rubrics
Marking rubrics are commonly used instruments for providing feedback on the quality of student performance [2]. Digital rubrics have grown in recent years, and these are backed by intelligent tools that can help student assessments (Cabrera and Villalon 2013). Instructors often provide marks in the rubrics and then enter these marks in the learning management systems. Some courses have hundreds of students enrolled, and groups of instructors input the scores from the marking rubrics in the learning management systems. In Figure 1 below, we provide the screenshot of an example rubric.
Figure 1:Example of a marking rubric.

The rubric has data about the following field, namely:
A. Student Name.
B. Student ID.
C. Student Marks/ Grades.
D. Instructor Name.
E. The marking criteria.
As an example, the marks are entered in the rubric as 91/100. In this situation, there are hundreds of students, and hence many rubrics. We assume that the course is offered in streams, and each stream has an instructor assigned for the teaching and the overall management of teaching activity. One instructor may be in-charge of more than one stream. The paper may be delivered at various levels, such as undergraduate and graduate.
We have developed an R script, that can be used for extracting
the data on student marks from multiple independent files. The
script can work with data with different file type extensions such
as .docx, .pdf, or .html. As an example, we use .docx files to extract
the data on the student’s name, student identification number, and
student marks. At a conceptual level, the extraction of the student
information from multiple files is achieved using the following
steps:
a) A list of all the marking rubrics, i.e., for each student that
has a .docx extension, is generated using the list. files command.
b) The list apply function (popularly known as lapply) of
dplyr package within the R framework is used to read the content
of each element within the list generated in step 1 above.
c) This generates a long list of the contents for each student
file. The entire content is read for each student, including the
student’s name, identification number, marks, and the marking
criteria.
d) The information about student name, identification
number and marks are extracted using the apply function to the
object created in step 3 above.
e) The extracted information is then converted into a table
format using the as data. frame function within the R framework.
f) In the final steps, the extracted information is subjected
to text processing techniques to remove the special characters, and
the last object is exported as an excel spreadsheet.
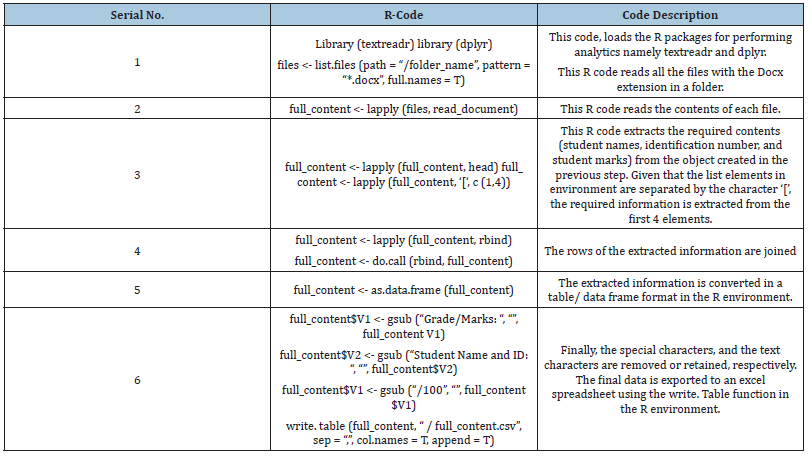
Thus, by running this script, information from multiple Docx files can be extracted. We also note that there are various ways in which this code can be refined, and our purpose here is to demonstrate how analytics applications can be useful in reducing the workload of the instructors. The R script is included in Table 1 and consists of the description of the programming codes. By using this script, the instructor can enter data into an excel spreadsheet for many students at a time. Also, based on the application program interface (API) of the learning management systems (LMS) used in the institution, this script can be modified to extract or enter these marks directly in the LMS.
Table 1:Example of R code for extracting student marks.

Research situation: extracting information for literature review
Our next example relates to a literature review situation. The literature review is an essential activity in the research process. While many studies perform a literature review on analytics in higher education (Viberg et al. 2018), however, none describe how analytics can help conduct literature reviews. Usually, literature reviews are performed for many years, and the time frame of five or ten years is not uncommon. The library databases provide the facility to download the research papers, and the overall data corpus for a literature review includes multiple files. We have written an R script that extracts information from many records of a data corpus. Information can be extracted using keywords, and the specific lines that include the keywords are extracted. These lines are exported in an excel spreadsheet from where these can be embedded in the literature review text. The data corpus here includes many journal articles, and the files can have different extensions such as .pdf, .docx, or .html.
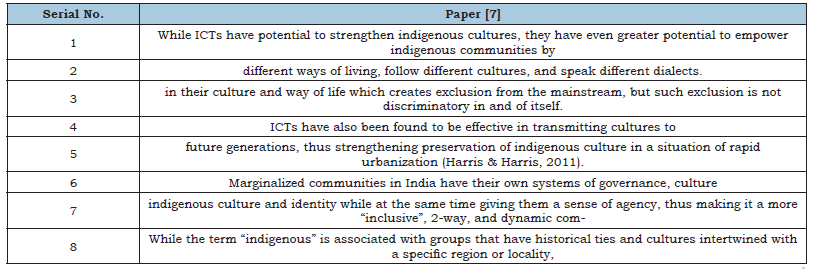
For testing this script, we downloaded 23 journal papers using the Scopus database, covering ten years from 2010 till 2019, using keywords such as “information systems” and “culture”. All these pdf files were kept in one directory, and the code was run on the data. The purpose of the code was to extract all the lines from each pdf file, where the term “culture” appeared. The R script was successfully able to extract the sentences that included the word “culture” in each paper. Finally, these lines were exported to an excel spreadsheet. As an example, in Table 2 we present the results of the script for one paper [7] for which the script was able to extract all the lines where the term culture appeared in the article.
Table 2:Line extracts from (Malhotra et al. 2018) with the ‘culture’ term.

The information extraction is achieved through the following
steps.
A. A list of all the .pdf files is generated using the list.files
command in the R programming language.
B. The list apply function (popularly known as lapply) of
dplyr package within the R framework is used to read the content
of each element within the list generated in step 1 above.
C. This produces a long list of the contents for each .pdf.
D. The grep function is run over this data corpus within the
lapply function. The grep function is used for extracting the lines
that have the ‘culture’.
E. Finally, the write. Table function is used to write the
extracted information onto an excel spreadsheet.
Table 3 presents the R codes used for extracting those lines where the term “culture” has appeared in the 23 research papers. For the demonstration, we have downloaded the papers as .PDF file from the Scopus Library Database. The documents can also be directly downloaded using the Scopus API, using the package RScopus [8]. It is worth noting that in both these examples, we have used the dedicated analytics package, namely R, and have extracted data for further analysis. For instance, in situation 1, the student marks data can be further analyzed. In situation 2, the extracted lines with the ‘culture’ word can be subjected to further analysis. We call this analytics type in which the data is extracted ‘extractive analytics. In the next section, we conceptualize extractive analytics by discussing its characteristics.
Table 3:R code for extracting information from research papers.

Characteristics of Extractive Analytics
Studies on the applications of data analytics in the higher education sector discusses the different categories of analytical methods. For example, analytics are categorized as useful for reporting and compliance, analysis and visualization, security and risk management, and predictive analytics [6]. Studies have also discussed the content categories of analytics and suggested that the analytics can be institutional analytics, information technology analytics, learning analytics, and academic analytics [1]. There are also organizational process categories where data analytics can be applied [2]. One conventional categorization of the types of analytics is on big data analytics categories of descriptive, predictive, and prescriptive analytics. One shortcoming of the existing higher education frameworks of analytics [1,4] is that some critical educational activities cannot be categorized into these analytics categories. The two situations that we have presented above, for example, cannot be classified as descriptive, predictive, or prescriptive analytics. Consequently, we propose a new category that is termed extractive analytics, which has broad applicability in the higher education sector. In this section, we discuss the characteristics of extractive analytics [8].
First, the output of extractive analytics is useful for predictive or prescriptive analytics. For example, in the literature review use case, the extracted lines can be further subjected to techniques of text analytics such as sentiment analysis, content analysis, or n-gram word analysis. Second, past studies have described analytics as an activity that requires specialized knowledge from disciplines of mathematics, statistics, and computer sciences [2]. The surge in big data analytics has also gained immense momentum since 2015, and this has made big data analytics as a chosen career choice of students [6]. However, acquiring the skills from different disciplines can be difficult, and impact the wellbeing of the students. Extractive analytics, on the other hand, does not require specialized knowledge of statistics or mathematics. This non-dependence on specialized discipline knowledge contributes to the simplicity of extractive analytics type.
Third, based on the above points, extractive analytics is more useful in the areas of improving the organizational processes. In contrast, the other analytics (descriptive, predictive, and prescriptive) are more useful for strategic purposes. Past studies have suggested that there is a knowledge gap in the area of how analytics can be used for improving the organizational processes [2], and extractive analytics can directly contribute to the efficiency of organizational processes. Lastly, extractive analytics can happen at various levels, even while conducting descriptive, predictive, and prescriptive analytics. In the Figure 2 below, we present a conceptual model of analytics in higher education that includes extractive analytics. The model proposes district analytics type, namely extractive analytics, and also shows the characteristics discussed above. In this model, extractive analytics is presented as a core layer that permeates through descriptive, predictive, and prescriptive analytics. The three attributes of extractive analytics are simplicity, process or activity focused and fundamental to other analytics.
Figure 2:Conceptual model of extractive analytics.

Conclusion
Recent studies suggest that the use of big data analytics in higher education has remained limited to student analytics, compliance, and performance reporting, and their usefulness in improving the organizational processes needs more research [2,3,6]. Multiple studies discuss the applications of analytics in areas of student performance and engagement (Foster and Francis 2019). Still, there are no studies, to the knowledge of the author, that discusses the role that analytics can play in reducing the workload of the instructors and thereby contribute to process efficiencies. This study contributes to these knowledge gaps and presents two use cases where analytics can help in the day-to-day working of the instructors. Our study also proposes an entirely new form of analytics specific to higher education, and we term this as extractive analytics.
References
- Daniel B (2015) Big data and analytics in higher education: Opportunities and challenges. British Journal of Educational Technology 46(5): 904-920.
- Njenga JK, Ildeberto AR, Karin H, Olaf J (2017) Identifying opportunities and challenges for adding value to decision-making in higher education through academic analytics. Advances in Intelligent Systems and Computing, Springer, Cham, Switzerland, pp. 474-480.
- Hadwer AA, Gillis D, Rezania D (2019) Big data analytics for higher education in the cloud era. 4th IEEE International Conference on Big Data Analytics (ICBDA), Suzhou, China.
- Matsebula F, Mnkandla E (2016) Information systems innovation adoption in higher education: Big data and analytics. 2016 3rd International Conference on Advances in Computing, Communication and Engineering (ICACCE), Durban, South Africa.
- Daniel BK (2016) Overview of big data and analytics in higher education. Big Data and Learning Analytics in Higher Education, Springer, Cham, Switzerland, pp. 1-4.
- Chaurasia, Sushil S, Frieda RA (2017) From big data to big impact: Analytics for teaching and learning in higher education. Industrial and Commercial Training 49(7-8): 321-328.
- Malhotra A, Rachana S, Raghavan S, Nirmala M (2018) Widening the arc of indigenous communication: Examining potential for use of ICT in strengthening social and behavior change communication efforts with marginalized communities in India. Electronic Journal of Information Systems in Developing Countries 84(4).
- Muschelli J (2019) Package ‘rscopus’.
© 2024 Ranjan Vaidya. This is an open access article distributed under the terms of the Creative Commons Attribution License , which permits unrestricted use, distribution, and build upon your work non-commercially.
 a Creative Commons Attribution 4.0 International License. Based on a work at www.crimsonpublishers.com.
Best viewed in


.jpg)


 Editorial Board Registrations
 Submit your Article
 Refer a Friend
 Advertise With Us
.jpg)


.jpg)


.bmp)
.jpg)
.png)
.jpg)


.jpg)


.png)

.png)


.png)


