- Submissions

Full Text
COJ Nursing & Healthcare
Economic and Clinical Impact of a Consultative Palliative Care Model for Patients with Cancer in Palestine
Mohamad Khleif*
AL-Sadeel Society for Palliative Care, Palestine
*Corresponding author: Mohamad HK, AL-Sadeel Society for Palliative Care, Bethlehem, Palestine
Submission: February 25, 2020;Published: March 05, 2020

ISSN: 2577-2007Volume6 Issue1
Abstract
Healthcare decisions demand evidence on cost-effectiveness, which is not well established for hospitalbased palliative care (PC) consultative model for inpatients with cancer. Full economic evaluation, using cost-utility analysis, over one-year follow-up of 195 patients, was used to determine this in Palestine. Aim was to assess the clinical and economic impact of this model by comparing PC with standard care (SC) groups. Utility and cost data were collected at each admission and analyzed statistically and economically. Very low quality of life (QoL) in general (PC=59%, SC=45%; p<0.01), better QoL at discharge (PC=71%, SC=49.5%; p<0.01), and improved longitudinal effects of the PC consultations for PC group (β from 9.3% to25.4%) were found in the cancer patients. Other predictors of poor QoL were stage four of cancer (β= -9.3%) and hospitalization for symptoms control (β= -19%).
The difference in mean costs between the two groups was not statistically significant (PC=22,332 NIS, SC=22,410 NIS; p=0.71), however, the difference in mean QALYs was highly statistically significant (PC=0.8199, SC=0.7513; p<0.0001). The main cost drivers were the costs of chemotherapy and length-ofstay, which were higher in the SC patients. Decision-tree analysis promoted PC as the dominant strategy with negative ICUR value for the base-case analysis. Sensitivity analysis revealed a robust enough decision with either dominant or cost-effective ratios. Ultimately, PC consultation team for in-patients was able to demonstrate improved outcomes of care and save costs for the healthcare system. Adoption of this costeffective strategy by policy makers would appear to be wise use of public funds.
Keywords: Economic evaluation; Palliative care; Palestine; Cost effectiveness; Cost utility analysis; Cancer; Quality of life
Background
In healthcare services, the debate centers on costs, as these services deplete scarce resources in providing quality care to patients and their families in order to improve their quality of life (QoL). This forces decision makers to look for efficiency and effectiveness, and to compare between competing alternatives of care based on evidence-based evaluation, which is not well established in many areas such as palliative care (PC), especially in developing countries [1]. When considering cancer care, these constrains are at the highest. Cancer is one of the leading causes of death both worldwide [2], and the second in Palestine accounting for 14% of all deaths [3], where most cases are diagnosed at the end stage of the disease [4,5]. Moreover, cancer incidence in Middle Eastern countries is predicted to increase by 70% in the next 20 years [6], as well as a significant need for PC service in the Middle East region, including Palestine [7].
The literature suggests that specialist inpatient PC services can significantly reduce healthcare costs and improve patient outcomes [8,9]. Conversely, there have been very few economic reviews focused on specialist hospital inpatient PC consultation and comparing costs within patient outcomes, with limited evidence from a prospective design [10,11]. This has not been studied in Palestine, nor in the region or in the Arab countries. This study explored such model of care and its effects on the clinical and economic outcomes of care for cancer patients, looking for level of evidence for the cost effectiveness of PC to be sufficient to support advocacy and lobbying toward initiation and integration of PC services into the healthcare system.
Methodology
The study adapted a one-year prospective observational analytic cohort design to study costs and clinical outcomes of care for patients with cancer at Beit Jala governmental hospital; the main cancer center with 65% of all cancer patients in the West Bank of Palestine. The follow- up was for all admitted adult patients from May 2016 to April 2017. The two groups were those received Standard Care (SC) alone and those received SC plus PC consultations by an external PC team; from AL-Sadeel Society for Palliative Care, in collaboration with the hospital team members. A cost-effectiveness model for the economic evaluation of this PC consultative model was then built. The PC consultations focused on physical and psychological symptom control, and supporting clinical decision making. Daily follow-up of patients recorded data on QoL, utility, symptoms, and costs of care.
Patients were allocated, upon arrival, randomly by the hospital system, according to their first visit to the outpatient clinic, and assigned to the attending physician. This physician becomes the in-charge of the treatment options; including the PC consultations, which are used only by half of the oncologists in the department. A total of 195 patients were considered for the study, including 49 PC cases and 146 SC controls. Statistical power analysis of the sample revealed excellent power (94%). Ethical considerations were taken through official approvals from IRB, Ministry of Health, and tool authors, in addition to patients informed consents. Assessments of health related QoL, symptoms, and costs were done on day one and at discharge. Then a follow-up assessment was conducted on a monthly basis, mainly by phone, until death or the end of the study period. This was to monitor long-term effects of PC on health outcomes of patients and the impact of PC on QoL over time after hospitalization. Assessment of health related QoL by phone is an acceptable approach using the EORTC QLQ-C30 research tool, as declared by its authors [12].
The study tools consisted of four parts:
- baseline demographic and clinical data at first contact,
- admission follow-up data at every admission of the patient to the oncology department,
- EORTC QLQ-C30 tool to assess QoL functions, domains, and symptom severity of cancer patients, and
- the utility scores of the health status of the patient, which were calculated using Rowen et al’s utility scores [13], based on the EORTC QLQ-C30 assessment tool for the health related QoL of cancer patients.
This method is more reliable for retrieving utility of the health state, and it is recommended for use by the health economist community as it calculates the utility score based on the public perception of the utility of the health state. Deriving a preference-based measure from this questionnaire was feasible for use in economic evaluation [13]. Validity of the tool for use with Palestinian cancer patients was assured by experts’ review, literature review, and through a high statistical significance (P<0.0001, 2-tailed) strong positive correlation of the intra-class correlation coefficient of the questionnaire items with the total degree of the tool. Reliability for internal consistency or responsiveness to change was examined by using Cronbach's alpha test, which was 0.94.
Data from patients were collected by self-filling questionnaires or by data collectors, and hospitalization cost data; for the LOS, chemotherapy drugs, and referrals for treatment or diagnostic procedures outside the governmental healthcare system, were collected from the computerized health information system for patient files in the hospital. Healthcare cost data were calculated based on the hospital pricing system. Cost-determining data included the number of admissions and readmissions to the hospital, Length of Stay (LOS) for each admission, chemotherapy medicines utilized, surgical interventions, and referrals for treatment or diagnostic procedures outside the governmental health system. SPSS version 20 was used for coding the data, building up the data set file, and filling in the questionnaires, as well as for performing the univariate and bivariate association testing using t-test, Mann-Whitney, chi-square, ANOVA or Kruskal-Wallis statistical tests. STATA version 13 was used to build Linear Mixed-Effect (LME) regression models for analyzing the longitudinal net effects of the independent variables on the outcomes among cases and controls. This model is the most appropriate regression model to fit the longitudinal repeated measures of cases and controls with unequal follow-up times. The model also can control for confounders in the study and can find the net pure effects.
Economic evaluation was done from the healthcare system perspective using a Cost-Utility Analysis (CUA) method. The average cost and average Quality Adjusted Life Years (QALYs) for both groups were calculated, with their confidence interval (95% CI), from the data set file. QALYs were calculated out of estimated utilities, and used to calculate the Incremental Cost Utility Ratio (ICUR) for the base-case analysis in CUA. Sensitivity analysis, based on the 95% CI limits of both costs and QALYs, was then done to reveal the robustness of the decision regarding the cost effectiveness. The economic analysis software Tree Age version R2 [14] was used in this analysis and to build the decision tree.
Findings
In general, QoL of Palestinian cancer patients was very low (45 scale points out of 100 or 45%), which is less than the half of the full function. The QoL measurement showed a statistically significant difference in the overall averages of the QoL domain scores between PC and SC groups. PC cases had 14 scale points more than SC controls in their global QoL score. The overall averages for the five QoL function scores were all also higher for the PC group (Δ= 8 - 20 scale points, p<0.01), and all were statistically significant, except for the social function where the difference was not statistically significant. The nine symptoms’ overall means were also better controlled in the PC group. Seven of these were statistically significant (Δ= -5 to -22, p<0.05), with the exception of nausea and vomiting (Δ= -4, p=0.4) and financial difficulties (Δ= -7, p=0.2). The greatest improvements were in controlling fatigue (-22 scale points, P<0.01) and pain (-21 scale points, p<0.01) (Table 1).
There was a statistically significant improvement in the global QoL overall mean score in the PC group from admission to discharge (12 scale points, p<0.01), while this was not the case in the comparator SC group (5 scale points, p=0.1). Furthermore, the level of QoL reached in the PC group was good (71 scale points), while it was still less than half of the full score in the SC group (49.5 scale points). The level of functionality was moderate to good in the PC group (55 to 90), while it was poor to moderate in the SC group (34 to 75). However, the overall scores’ mean differences in symptom control were somehow similar between the two groups. Even so, the magnitudes of improved symptom control were higher in the PC group (-1 to -18 scale points) than in the SC group (0 to -10 scale points). Comparing global QoL score means between PC cases and SC controls by the month of follow-up for each patient (FU#) showed significant score differences between the two groups in the third through seventh months of the study, where PC cases had better QoL average scores than SC controls (Table 2). The main significant difference between the groups was apparent in the middle, where there was a great enough effect and a sufficient number of cases. There was also progressive improvement in the QoL of PC cases over time, from 49.7% at initial measurement up to 82.3% in the seventh month in the study.
Table 1: Overall means of QoL measures for PC cases and SC controls.
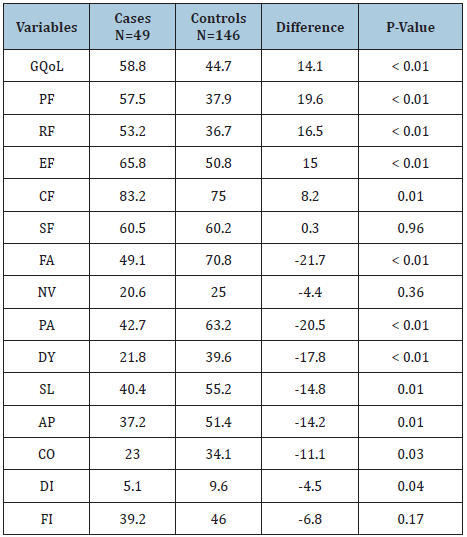
GQoL: global quality of life. PF: physical function. RF: role function. EF: emotional function. CF: cognitive function. SF: social function. FA: fatigue, NV: nausea &vomiting, PA: pain, DY: dyspnea, SL: insomnia, AP: loss of appetite, CO: constipation, DI: diarrhea, FI: financial difficulties. *Average of all the measurements of QoL over the study period.
Table 2: GQoL means scores per FU# month for PC and SC groups.
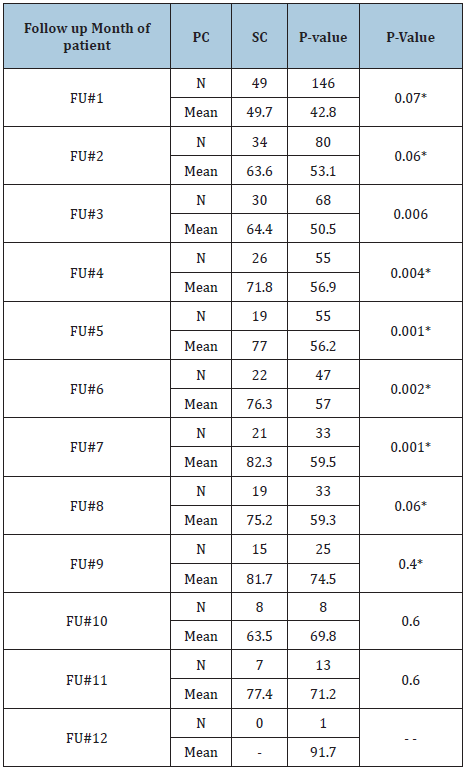
*P-value of Mann-Whitney test if distribution is not normal. Otherwise it’s from t-test.
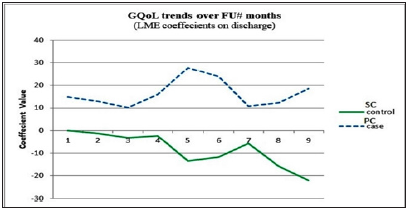
The LME regression model revealed that the net effects on GQoL were attributed to three factors, which are the follow-up month of patient (FU#), stage of cancer (Stage), and treatment type at hospitalization (Rx) (Table 3). The model revealed that there was a reliable effect of PC consultations, which appeared in the second to sixth follow-up months, on the QoL of cancer patients in the PC group (and not in the SC group). It was noticed that the changes in QoL scores in the SC group at admission were negatively marked most of the time even though they were not statistically significant. This indicates that the QoL of patients in the SC group was perhaps worse. Moreover, it was noticed that even in the first month of follow-up, at discharge, there was significant improvement in the QoL of PC cases. While the significant change found in the SC group, in the fifth and sixth months, at discharge, was actually toward worsening QoL. The model states that 32% and 38.8% of the change, at admission and discharge, respectively, can be explained by the random effects (ICC) for an individual subject’s variability of GQoL.
Table 2: Linear mixed-effects regression model: coefficients and their significance for GQoL at admission and discharge.
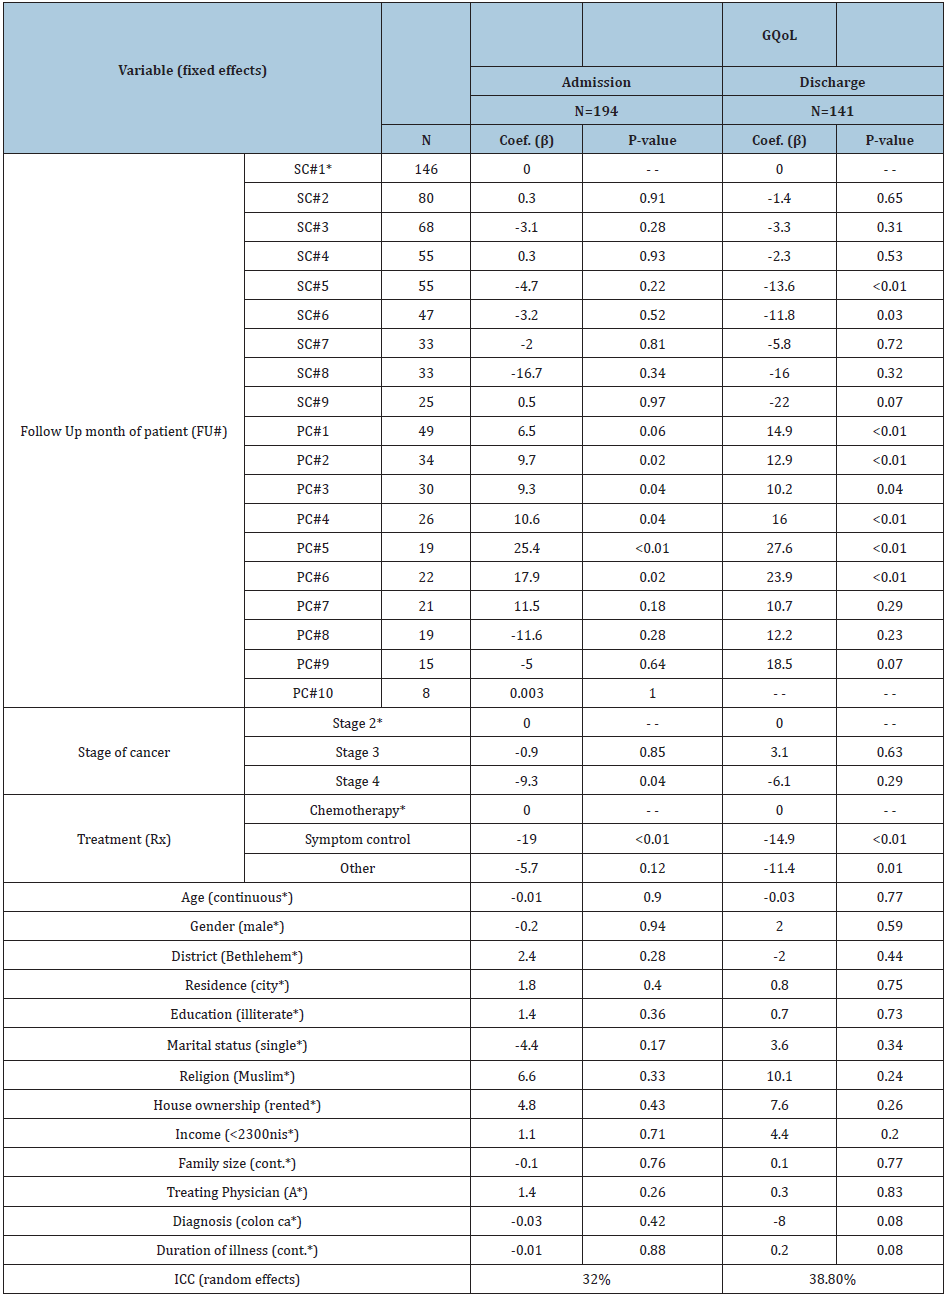
*The reference subgroup for comparison in the mixed-effects model. GQoL: global quality of life score. ICC: Intraclass Correlation. ICC: intraclass correlation.
No statistically significant differences in resource utilization were found between the two groups. However, a trend of more utilization was noticed in the SC group, even though it was not statistically significant. SC controls tended to utilize more chemotherapy per patient per session and per follow-up month, and more hospital days per patient and per admission. The average cost was 22,332 NIS/PC patient and 22,410 NIS/SC patient. The difference in costs between the two groups was not statistically significant (p=0.71). The mean utility score was calculated in the SPSS data file by taking the average of the measurements in each follow-up month for each patient. This produced an average utility score per patient follow-up month (Ui), which was used to calculate the QALYs. Average QALYs per month of follow-up for each patient were calculated in the SPSS data file. Mean QALYs per month were computed for both groups and summed. QALY values were 0.8199 in PC cases and 0.7513 in SC controls.
Figure 1: ICUR and threshold lines on the costeffectiveness plane.

Cost effectiveness analysis of the base-case was done using the means of the parameters. The average cost per QALY gained used to calculate the average cost-effectiveness ratios, which were 27,237 NIS/QALY for PC cases and 29,828 NIS/QALY for SC controls, which is less for the PC strategy, indicating that it is cheaper to adopt this strategy. The incremental cost-utility ratio (ICUR) is the most important parameter in CUA. It determines the cost of realizing health benefits and the incremental cost per QALY, which had a negative value indicating the dominance of the PC strategy over the SC strategy (Figure 1). This means that PC consultations strategy is not only improving the QoL of cancer patients, but also saves money for the healthcare system. The national threshold for accepting cost per QALY was calculated as 21,000 NIS per QALY, based on the WHO recommendations of three times the GDP per capita.
Results of sensitivity analysis revealed either a dominant or cost-effective conclusion for the value of the ICUR. The cost of chemotherapy treatments in the PC group was cost effective at its average value, but not at the upper limit of the 95% CI. PC strategy stayed dominant over SC strategy up to an 11,615 NIS cost for chemotherapy medication (M= 9,945 NIS; CI: [4,367, 15,523]). A two-way sensitivity analysis diagram representing all the possibilities for the decision regarding cost effectiveness of the PC strategy is presented in Figure 2, which shows that the area of PC is dominating the diagram. This means that most of the time PC is cost effective. The cost of chemotherapy treatment needs to be considerably increased and the utility level decreased to affect this decision.
Figure 2: Two-way sensitivity analysis: chemotherapy cost and utility score (WTP=21,000 NIS/QALY).

The same was done with the LOS cost and the utility score. The diagram (Figure 3) shows that PC strategy dominated almost all the area of the diagram. This means that the PC strategy was cost effective all the time regardless of changing parameter values, except in the case of extreme assumptions of very high costs of hospitalization and very low levels of utility and QoL.
Figure 3: Two-way sensitivity analysis: LOS cost and utility score (WTP=21,000 NIS/QALY).
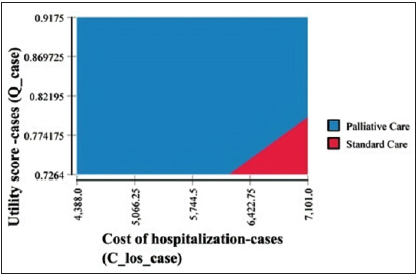
Furthermore, three-way sensitivity analysis, for the three most important parameters in the model, revealed similar results. Changing the utility scores over its 95% CI range showed clearly that increasing utility scores resulted in increasing the blue decision area in favor of PC strategy adoption. The previous sensitivity analysis confirms the conclusion that the consultative PC model is cost effective for in-patients with cancer and robust enough to make decisions that policy makers can rely on confidently. Further analysis showed that increased willingness-to-pay threshold will produce more net benefits from the PC strategy in comparison to an SC strategy. At the national threshold, the PC strategy produced more net monetary benefits for the PC strategy over the SC strategy. Increasing this threshold to 50,000 NIS/QALY increased this net monetary benefit almost three folds.
Discussion
The independent variables variations between PC and SC patients, initially and over the follow-up period, were not statistically significant to be considered influential on the effects resulted on the dependent variables in the study. Of the noticed key characteristics was that the majority of patients (over 90%) having advanced stage of cancer. This indicates the late presentation of cancer patients in a middle-income country like Palestine and highlights the importance and need for early detection strategies and efforts. Measuring QoL domain scores in this study confirmed results from previous national studies [14-16]. It showed that the QoL of Palestinian cancer patients is very low in general, as well as in comparison with international studies (Table 4) [17-19]. The poorer QoL of Palestinian cancer patients in comparison might be due to the deteriorating socio-economic and political situation in the country, but also it is associated with a lack of professional and specialized PC to support cancer patients.
Table 4: Comparison between several studies for GQoL, QoL functions, and most severe symptoms of cancer patients.

*In this study, results were calculated using linear transformation of the Likert scale.
Differences in the mean scores of QoL, functions, and symptom control between PC and SC groups (Table 1) are a strong indicator of the effect of the PC consultative model in improving the QoL of cancer patients, which was also apparent when looking for any improvement in QoL from admission to discharge (Table 2). Many studies found that PC interventions improved QoL and patient outcome [8,9,11,20-26]. There were significant differences in the scores of the QoL indicators within the categories of the independent demographic and clinical variables in both the PC cases and the SC controls, which were mostly similar. However, these bivariate associations were confounded by stage and treatment. The built regression model revealed that having an advanced stage of cancer and being admitted for symptom control treatment were the main factors that decreased the QoL scores, as well as confounding other variables in the study. Yet, these effects were expected, as advanced stage and symptom exacerbation lowers QoL in cancer patients. Other studies found a correlation between poor QoL and advanced stages of cancer and symptom exacerbation [4,17,27].
The developed LME regression model revealed that there was a reliably significant pure net effect of PC consultations on the QoL of cancer patients. The QoL of patients in the PC group improved significantly in the second through sixth months of follow-up. On the other hand, no significant improvements were noticed in the QoL of patients in the SC group, and even sometimes QoL scores were declining (Figure 4). The first month of patient follow-up revealed no significant change in the QoL scores in the PC group, emphasizing an equal start for both groups. Also, this indicates that the effects of the interventions of the PC team needed time to appear and were not large enough to be captured initially. This highlights the need for long-term care and consistency of work by the PC team. After the seventh month of follow-up, the statistical model could not capture the significance of change in QoL scores, even though the scores were improving. This is due to the fact that the numbers of followed-up patients decreased. This drop in numbers was attributed to loss or difficulty in follow-up, death of patients, or referral for treatment outside the governmental healthcare system. Other studies found that the effects of PC services had different peaks over the follow-up time. A meta-analysis found that PC was associated with statistically and clinically significant improvements in patient QoL between one and three months of follow-up time, but not in the four to six month period [28]. Another randomized controlled trial found PC improving QoL at three months of followup and beyond, in comparison to controls [29].
Figure 4: Trends over time for GQoL scores at discharge: net effect change in coefficient values of the linear mixedeffects regression model for PC cases and SC controls.
Scores of utility, four of the five functions (PF, RF, EF, and SF), and six of the nine symptoms (PA, FA, DY, SL, CO, and FI) were significantly improved by PC consultations. This stresses the need for a more holistic and clinical perspective of care for evaluating and caring for such patients. Other studies found that patients with advanced cancer had worse functioning, especially in role function [17]. A cost utility analysis, as a full economic evaluation method, is considered one of the best methods for economic evaluation of healthcare services. Decisions based on its results can be compared between different types of services as it uses utility measures through QALYs, which goes beyond merely measuring the natural units of improvements, but it also evaluates the perceived utility as a result of the intervention. Cost were almost similar in both groups with no statistically significant difference. The main drivers of the cost were the costs of chemotherapy medications and hospitalization days, which were higher in SC patients. One study found that reduced LOS was the biggest driver of cost savings from early PC consultation for advanced cancer patients [30].
Contrary to the cost, the difference in utility scores between the two groups was of high statistical significance. Cost utility and sensitivity analyses showed that the PC strategy is dominant over the SC strategy. The economic analysis, at the Willingness-To-Pay (WTP) threshold line, showed that the cost of chemotherapy was the only parameter that prevailed over that line, and it was the most critical parameter in analysis. This reiterates the importance of paying much attention to chemotherapy use in cancer patients with an advanced stage of disease. This highlights the importance of the role of PC teamwork in the decision-making process, especially at the end of life, where the goal of care shifts toward patient comfort, as well as to save unnecessary expenditure of valuable scarce resources in the healthcare system. Furthermore, drawing assumptions for different WTP points showed the potential for future consideration for more investment in this PC model to increase net monetary benefits over available alternatives. Net monetary benefits can be tripled when doubling the WTP threshold. This provides an opportunity for more strategic planning options for future decision-making processes and is a valuable tool providing robust evidence-based background for policy makers to utilize.
Conclusion
The economic analysis revealed a robust enough decision that the consultative PC model was cost effective for hospitalized cancer patients in Palestine. Therefore, policy makers can confidently adopt this program and integrate it within the healthcare system as a cost-effective strategy, which will improve the QoL of cancer patients and safeguard the limited resources in healthcare.
References
- Gomes B, Harding R, Foley KM, Higginson IJ (2009) Optimal approaches to the health economics of palliative care: Report of an International think tank. J Pain Symptom Manage 38(1): 4-10.
- (2018) WHO> cancer. World Health Organization NCD Management Unit Cancer.
- MOH (2017) Health Annual Report 2016. Nablus.
- Mohamad H Khleif, Asma M Imam (2013) Quality of life for Palestinian patients with cancer in the absence of a palliative-care service: A triangulated study. Lancet 382: S23.
- Husseini A (2009) Cardiovascular diseases, diabetes mellitus, and cancer in the occupied Palestinian territory. Lancet, England 373(9668): 1041-1049.
- Stewart BW, Wild CP (2014) World cancer report 2014. World Heal Organ, pp. 1-2.
- Bingley A, Clark D (2009) A comparative review of palliative care development in six countries represented by the Middle east cancer consortium (MECC). J Pain Symptom Manage 37(3): 287-296.
- May P, Normand C, Morrison RS (2014) Economic impact of hospital inpatient palliative care consultation: Review of current evidence and directions for future research. J Palliat Med 17(9): 1054-1063.
- Smith S, Brick A, O Hara S, Normand C (2014) Evidence on the cost and cost-effectiveness of palliative care: A literature review. Palliat Med 28(2): 130-150.
- Smith TJ, Hillner BE (2011) Bending the cost curve in cancer care. N Engl J Med 364(21): 2060-2065.
- Hanson LC, Usher B, Spragens L, Bernard S (2008) Clinical and economic impact of palliative care consultation. J Pain Symptom Manage 35(4): 340-346.
- Fayers P, Aaronson N, Bjordal K, Groenvold M, Curran D, et al. (2001) The EORTC QLQ-C30 scoring manual. In: Fayers P, Aaronson N, Bjordal K (Eds.), European Organization for Research and Treatment of Cancer (3rd edn), Belgium.
- Rowen D (2011) Deriving a preference-based measure for cancer using the EORTC QLQ-C30. Value Heal 14(5): 721-731.
- (2017) Treeage pro. TreeAge Software, Williamstown, Australia.
- Thweib N (2011) Quality of life of palestinian cancer patients. J Pediatr Hematol Oncol 33 (Suppl 1): S68-S69.
- Samara Awad M, Saca Hazbon H (2009) Factors influencing quality of life for women with breast cancer in Palestine. p. 63.
- Alawadi SA, Ohaeri JU (2009) Health - related quality of life of kuwaiti women with breast cancer: A comparative study using the EORTC quality of life questionnaire. BMC Cancer 9: 1-11.
- Rukiye, Pinar, Salepc T, Affiar F (2003) Assessment of quality of life in Turkish patients with cancer. Turkish J Cancer 33(2): 96-101.
- Scott NW (2007) The use of differential item functioning analyses to identify cultural differences in responses to the EORTC QLQ-C30. Qual Life Res 16(1): 115-129.
- Stjernswärd J, Foley KM, Ferris FD (2007) The public health strategy for palliative care. J Pain Symptom Manage 33(5): 486-493.
- Meier DE (2011) Increased access to palliative care and hospice services: opportunities to improve value in health care. Milbank Q 89(3): 343-380.
- Morrison RS (2008) Cost savings associated with US hospital palliative care consultation programs. Arch Intern Med 168(16): 1783-1790.
- Smith TJ, Cassel JB (2009) Cost and non-clinical outcomes of palliative care. J. Pain Symptom Manage 38(1): 32-44.
- May P (2015) Prospective cohort study of hospital palliative care teams for in patients with advanced cancer: Earlier consultation is associated with larger cost-saving effect. J Clin Oncol 33(25): 2745-2752.
- Higginson IJ, Evans CJ (2010) What is the evidence that palliative care teams improve outcomes for cancer patients and their families. Cancer J 16(5): 423-435.
- Hodgson C (2012) Cost-effectiveness of palliative care: A review of the literature.
- Boström B, Sandh M, Lundberg D, Fridlund B (2003) A comparison of pain and health‐related quality of life between two groups of cancer patients with differing average levels of pain. J Clin Nurs 12(5): 726-735.
- Kavalieratos D (2016) Association between palliative care and patient and caregiver outcomes: A systematic review and meta-analysis. JAMA-J Am Med Assoc 316(20): 2104-2114.
- El-Jawahri A (2016) Effect of inpatient palliative care on quality of life 2 weeks after hematopoietic stem cell transplantation: A randomized clinical trial. JAMA 316(20): 2094-2103.
- May P (2017) Cost analysis of a prospective multi-site cohort study of palliative care consultation teams for adults with advanced cancer: Where do cost savings come from. Palliat Med 31(4): 378-386.
© 2020 Mohamad Khleif. This is an open access article distributed under the terms of the Creative Commons Attribution License , which permits unrestricted use, distribution, and build upon your work non-commercially.
 a Creative Commons Attribution 4.0 International License. Based on a work at www.crimsonpublishers.com.
Best viewed in


.jpg)


 Editorial Board Registrations
 Submit your Article
 Refer a Friend
 Advertise With Us
.jpg)


.jpg)


.bmp)
.jpg)
.png)
.jpg)


.jpg)


.png)

.png)


.png)


