- Submissions

Full Text
COJ Nursing & Healthcare
Isolation, Characterization and Sequencing of Biofilm Bacterial Consortia from Drinking Water PVC Pipelines and their Influence on Corrosion of Mild Steel
Suprajaa N2, Prasad TNVKV1* and Davida E2
1Department of Nanotechnology, Acharya N G Ranga Agricultural University, India
2Department of biotechnology, Thiruvalluvar University, India
*Corresponding author: Prasad TNVKV, Department of Nanotechnology, Institute of Frontier Technology, Regional Agricultural Research Station, Acharya N G Ranga Agricultural University, Tirupati-517 502, AP, India, Email: tnvkvprasad@gmail.com
Submission: November 10, 2017; Published: December 21, 2017

ISSN: 2577-2007Volume1 Issue3
Abstract
Drinking water distribution system biofilms were investigated for the presence of hygienically relevant microorganisms. In this study we collected four PVC pipes from different Drinking water and studied the biofilm morphology, Characterizing the formation of biofilm on Polyvinyl chloride (PVC) pipe lines were analyzed by using the techniques, X-ray diffraction (XRD), Raman microscopy (RMS), X-ray fluorescence spectroscopy (XRF), Fourier transform infrared spectroscopy (FT-IR), and Scanning electron microscopy (SEM EDAX). Biofilm formation in drinking water PVC pipelines is due to many factors including pH, temperature, salt etc. In this study, microbiological aspects of biofilm formation and their role on electrochemical studies are presented. We report the design and evaluation of PCR primers 63f and 1387r for amplification of 16SrRNA genes from bacterial isolates, Phylogenetic analysis of partially sequenced 16SrRNA gene sequences revealed the diversity of bacterial and fungal strains in the PVC pipeline 7 different bacterial phyla were detected. In addition, localized biofilm of the PVC pipeline in the presence of the consortia was observed by scanning electron microscopy analysis and morphology was seen in EPI fluorescence microscopy, The dominant bacterial species identified in the PVC pipeline biofilm samples were Sphingobacterium sp respectively, several types of bacteria may be involved in biofilm arising and the potential role of each species in biofilm formation is discussed. Therefore, calcium carbonate and the allied calcium compounds are responsible for the biofilm formation in PVC pipes and these inferences may lead to develop effective water purification measures.
Keywords: PVC pipelines; Biofilm; Bacteria; Phylogenetic tree construction; Electro chemical studies
Introduction
Biofilms formation is a common phenomenon in aquatic environments [1]. Some microbes occurring in biofilm can cause taste and odour in water [2] or causing pathogenic [3] effects of water. Biofilm protects microbes against disinfection [4] and increases corrosion of piping materials [5]. The accumulation of microorganisms on the surfaces and the formation of biofilm depend on many factors like, type of surface material, microbial occurrence in water, concentration and quality of nutrients and disinfectants, temperature, and hydraulics of the system. Some pipe materials can affect microbial regrowth by releasing chemical compounds such as copper, iron, phosphorus ions, and organic compounds. It has been reported [6] that the formation of biofilm was slower in copper pipes than in polyethylene (PE) pipes. While plastic pipes such as PE and PVC, which have recently been used as cost-effective replacements of traditional metal plumbing, may release biodegradable organic compounds and phosphorus, which can arouse microbial re-growth and biofilm formation.
The basic unit constituent of PVC pipe is the polyvinyl chloride resin which is a polymer derived from petroleum or natural gas, salt water and air. PVC resin can be manufactured by suspension, emulsion, and bulk, processes which are named according to the technology used. This PVC resin is then merged with heat stabilizers, lubricants, and other ingredients to produce PVC compounds that can be extruded into pipes or moulded fittings [7]. Roughness of pipe surface and corrosion products also affects bacterial attachment on the surface. Chang [8] Found that biofilm re-growth on pipes made of rough surface materials such as cast iron, concrete-lined cast iron, and galvanized steel was greater than that on smooth-surface polyvinyl chloride (PVC) pipe. PVC pipes are resistant to both chemical and electrochemical corrosion because PVC is a non-conductor and is not damaged by aggressive waters or corrosive soils. PVC pipe will not deteriorate as a result of microbiological activity nor serve as a nutrient to microorganisms or fungi [9].
The deposition of CaCO3 scale on PVC pipes often results from the reaction of calcium and dissolved CO2. Calcium carbonate crystals are large but when the scale is formed with impurities in the form of finely divided crystals, the scale appears uniform. As the increase of pH and temperature, solubility of CaCO3 takes place at hotter regions. An increase of pH and decrease of total dissolved salts also favour CaCO3 scale formation in cooling water system. Another substance deposited from water in the form of scale or sludge is MgCO3. The solubility of MgCO3 is influenced by the same factors which influence CaCO3 solubility. However, MgCO3 scale is not as troublesome as CaCO3 since the solubility of MgCO3 is four times greater than that of CaCO3. Calcium sulphate or gypsum is another solid which is deposited in heat exchanger tubes. The crystals of CaSO4 are smaller than those of CaCO3, and so the scale is generally harder and denser than carbonate scales. Iron deposits are common in cooling water is aerated or chlorinated; the insoluble iron oxide is deposited. These deposits adhere to the metal surface or combine with other minerals to form deposits in lines. Phosphate scales are reaction products of reverted polyphosphates to orthophosphates and the minerals commonly found in cooling water such as Ca or Mg. The proper conditions to permit precipitation depend upon temperature, pH, orthophosphate content and calcium and magnesium contents [10].
However, it is unknown if biofilms present in water distribution systems are a general and ubiquitous reservoir for hygienically relevant microorganisms. To be more efficient in the control of biofilms, a better understanding of the mechanisms involved in biofilm development, and especially those factors affecting the rate of bacterial colonization and regrowth are necessary [11]. Therefore the evaluation of the diversity and community structure in environmental samples with classical, culture dependent approaches are not sufficient. Molecular techniques like fluorescence in situ hybridization (FISH) [12], 16S rDNA clone libraries of native biofilms [13]16S rRNA gene community fingerprints [14] are culture independent approaches for biofilm communities and are commonly used in investigations of biofilms. Community fingerprinting techniques such as denaturing gradient gel electrophoresis (DGGE) were already used for the comparison of biofilms at different water treatment steps and along the water supply systems. They were also used to investigate the influence of metals like copper on biofilms [15], to determine the community structures of groundwater habitat examine the effect of UV irradiation on biofilm communities [16].
Here in this study DNA samples extracted from biofilms associated with scale in lotic habitats, were found to be poor templates for amplification of the 16SrRNA gene with amplimers such as 27f and either 1492r or 1392r For bacteria. To the best of our knowledge, there are almost limited reports on biominelarization of biofilm formation in PVC pipelines. As the identification of bacteria in PVC pipelines appears lacking, this study would be useful for the selection of suitable biocides/inhibitors in the control of biofilm in water distribution system.
Materials and Methods
Sample collection (PVC biofilm)
The PVC Biofilm samples were collected from four different regions located in and around Tirupati, (Chittoor District) Andhra Pradesh, India. The samples were collected from drinking water PVC pipelines and taken in the sterile container. The collected samples were in amorphous form. These samples were stored in an ice box and transported for microbiological characterization to laboratory for further analysis.
Pipe cut-outs
Prior to removal of the pipe sections, water samples were collected at hydrants downstream of the pipeline. The external pipe surface were disinfected with 10% hydrogen peroxide for 5min and rinsed with sterile-filtered (0.2|im) deionized water. Pipe length of 1m was removed using mechanical cutters. The pipes were immediately sealed with sterile plastic foil and transported to the laboratory. In PVC pipes 100g of sterile glass beads (5mm diameter) in 150ml of deionized water were filled into the pipes, the open ends of the pipes were closed with plastic foil and the pipes were manually shaken for 5min. The resulting suspension was collected without the glass beads, the pipes were re-filled with 150ml of water and the procedure was repeated. After up to three repetitions, all suspensions were mixed and analyzed microbiologically as described below.
PVC pipe biofilm characterization studies
Various characterization techniques have been employed to identify the biofilm samples present in PVC pipelines. XRD, FT-IR, RMS, XRF, SEM and XPS analysis were performed in this study. XRD is a versatile, non-destructive analytical technique for identification of the various crystalline phases present in unknown powdered and solid samples. RMS provides information about molecular vibrations that can be used for samples identification and quantification. The technique allows the identification of homogenous materials on the basis of their molecular vibrational spectra, obtained by excitation with visible laser light. XRF is used to identify the elements present in biofilm samples, involves irradiating a solid in vaccum with monoenergetic soft X-ray and analyzing emitted electron by energy. Surface analysis by XPS, on the other hand involves irradiating a solid in vacuum with monoenergetic soft X-ray and analyzing the emitted electron by energy. FTIR, which is generally used to detect the functional group of compound (Bruker, Tensor 27-model). Data point resolution was approximately 1 point per wave number. The digitalized spectra were processed using OMNIC software, the spectrum was recorded in the transmittance mode. The morphology of the biofilm samples was analyzed in the Scanning electron microscope.
XRD analysis: The XRD analysis was carried out on powder, which had been previously scratched from the biofilm layer on the PVC pipe and grounded in a mortar. The equipment used consisted in a XRD model: X'pert PRO PAN, X-ray diffractometer with Syn Master 793 software to identify the biofilm. The XRD pattern was recorded using computer controlled XRD-system, JEOL, and Model: JPX-8030 with CuK radiation (Ni filtered=13418 Ao) at the range of 40kV, 20A. The 'peak search' and 'search match' program built in software (Syn master 7935) was used to identify the peak table and ultimately for the identification of XRD peak.
FT-IR analysis: FT-IR analysis was carried out on powder, which had been previously scratched from the biofilm layer on the PVC pipe and grounded in a mortar. Infrared spectrum obtained by passing an infrared beam through the sample and scanning the spectrum with dispersion device. The absorption areas detected and plotted as frequencies Vs intensities. The changes of functional group in the synthesized material at different temperature were characterized by FT-IR, which is generally used to detect the functional group of compound (Bruker, Tensor 27-model). The spectrum was taken in full range with 16 scan speed. Spectral resolution was cm-1. The FT-IR spectrum taken in the mid IR region of 400-4000cm-1. The spectrum was recorded using ATR (Attenuated Total Reflectance). Data point resolution was approximately 1 point per wave number. The digitalized spectra were processed using OMNIC software. The sample was directly placed in the potassium Bromide (KBr) powder and the spectrum was recorded in the transmittance mode.
Raman Spectroscopic analysis: RMS analysis was done by using micro-Raman system (Renishaw, Model: RM 1000 B). A 25mW argon-ion laser (514mn) was incident on the sample surface and the Raman scatters were collected. Raman spectrum was obtained in the range of 500-1500cm-1 with exposure time of 25s (100% intensity) as the expected calcium products from PVC pipes generally show their peaks in this range. Calibration is done with two standards samples: pure alumina silicon wafer.
XRF analysis: XRF analysis, 4x4mm samples were cut from PVC pipe biofilm and stored in the desiccators to remove adsorbed moisture. The XRF scan was performed using a (XGT-2700 X-ray analytical microscope, Horiba, Japan). The base pressure during analysis was 10-9 Torr.
XPS analysis: The XPS measurement was performed to obtain information about the elements in the water pipeline biofilm. The XPS spectrum was taken by PHI ESCA model VG 3000 SYSTEM. The base pressure in the experimental chamber was in the low 10-9 mbar range. The spectrum was collected using Mg-Ka (1253.6eV) X-radiation and the overall energy resolution was 0.8eV. Samples of 0.6cm2 were used. Survey spectrum was recorded for the samples in the O-1100eV kinetic energy by 1eV steps while high resolution scan with 0.1 eV steps were conducted over the following regions of interest: Ca, O2.
SEM and EDAX analysis: For SEM analysis consists of an energetically well defined focused beam of electrons across a sample. The microscope uses a LaB 6 source and is pumped using turbo and ion pumps to maintain the highest possible vaccum. Secondary electron imaging (SEI) works on the principle that this electron beams generates a "splash" of electrons with kinetics energies much lower than the primary incident electrons called secondary electrons as a function of primary beam position makes it possible to attain high magnifications as much as x 100000 in some cases and high resolution (up to 40A) resolution for imaging the areas of interest. Small biofilm samples of size 1cm X 1cm were mechanically polished and then were subjected to clean finally by immersion in nitric acid for 5 minutes at 60 °C water bath followed by gentle cleaning with trichloroethylene. The coupons were observed by employing SEM (Hitachi model S-3000H). The nature of the elements was analyzed by EDAX.
Bacterial enumeration in biofilm samples
The collected samples were serially diluted (10-fold) using 9ml of sterile distilled water-blanks and the samples were plated by pour plate technique. The nutrient agar mediums were used to enumerate bacteria. The collected samples were serially diluted up to 10-6 dilution. One millilitre (1ml) of each sample was poured into sterile petridishes. The prepared respective sterile medium was also poured into petridishes. The plates were gently swirled so that the medium might be distributed evenly in the plate. Plates in triplicate were prepared for each dilution. The plates were inverted and incubated at room temperature for 24h. After 24h the colonies were counted. The plates containing bacterial colonies with 30-300 numbers were selected for calculation. The bacterial colonies were expressed as colony forming units per millilitre (CFU/ml) of water. Morphologically dissimilar colonies were selected randomly from all plates and isolated colonies were purified using appropriate medium by streaking methods. The pure cultures were maintained in specific slants for further analysis. The isolated bacterial cultures were identified by their morphological and biochemical characteristics. 7 genera were identified in the biofilm samples. The strains were maintained at -4 °C to keep the microbial strain viable. The isolated bacterial cultures were identified up to genus level by their morphological and biochemical characterization viz., Gram staining, Motility, Indole test, Methyl red test, Voges-Proskauer test, Citrate test, H2S test, Carbohydrate fermentation test, Catalase test, Oxidase test, Starch, Gelatin, Lipid hydrolysis, etc.
Growth at various temperatures and pH
The selected dominated isolates inoculated in broth culture were tested under temperature of 37 °C. The biofilm sample bacteria were grown in the nutrient broth for pH measurement. The pH was also measured with time using a digital pH (Eutech instruments pH 510 (pH/mV/°C meter).
Epi-fluorescence microscope (Acridine orange stain, Bacteria)
A loopful of bacterial culture was used for the fluorescence studies. In a clean glass slide, the smear was prepared similar to gram's staining, 3% glutaraldehyde solution is fixed in the smear and then followed by two drops of 0.01% aqueous solution of acridine orange. Incubated for 10 minutes, the excess stain was washed with autoclaved sterile distilled water and examined by the Epi-fluorescence microscope. The cells were observed under oil immersion (100X). The model, Nikon Epi-fluorescence microscope (E 200, Nikon, Tokyo, Japan equipped with a 10X / 0.25 numerical apertures - 5400).
DAPI stain technique (Bacteria)
A loopful of bacterial culture was taken in a clean glass slide. The smear was prepared, two drops (1mg/ml) of DAPI (6-Diamidino- 2-phenylindole diHCl) Stain was added to the smear. Incubated for 10 minutes, the excess stain was washed with autoclaved sterile distilled water and examined by the Epi-fluorescence microscope. The cells were observed under oil immersion (100X).
Electrochemical studies
Conventional three electrode cell assembly was used for impedance measurements as well as for polarization studies. A mild steel test specimen as the working electrode, a large platinum foil as counter electrode and saturated calomel electrode as reference electrode were used.
Polarization studies: The specimens of 1cm x 1cm (Mild steel) coupons dimension with an extended stem of 10cm lengths were used for polarization studies. The coupons were polished to mirror finish by using trichloroethylene followed by deionized water. The coupons were immersed in separate conical flask containing nutrient medium. One ml of bacterial culture was inoculated into conical flasks and it was used as experimental systems. The uninoculated culture tubes act as control system; these conical flasks were incubated for 16 days and measured the polarization after the incubation period completes.
Polarization measurements were carried out potentio dynamically using modern PGP 201, potentiostat with voltammeter -1software employing a large platinum electrode, saturated calomel electrode (SCE) as reference electrode and the coupons as working electrode. The system was allowed to attain a steady potential value for 10 minutes. The steady state polarization was carried out from -200mV vs. SCE from the OCP and +200mV vs. SCE from the OCP separately using separate electrodes at a scan of 30mV/Sec.
Impedance studies: The specimens of 1cm x 1cm (Mild steel) coupons dimension with an extended stem of 10cm lengths were used for impedance studies. The coupons were polished to mirror finish by using trichloroethylene followed by deionized water. The coupons were immersed in separate conical flask containing nutrient medium. One ml of bacterial culture was inoculated into conical flasks and it was used as experimental systems. The uninoculated culture tubes act as control system; these conical flasks were incubated for 16 days and measured the impedance after the incubation period completes.
Electrodes of the same specification employed in polarization studies were used for impedance studies. These studies were carried out using computer control EG and g system: M6310 with software M398. Impedance measurements were taken after were attainment of steady state, an AC signal of 10mV amplitude was applied and Impedance values were measured for frequencies from 0.1Hz to 100Hz. The values of Rt were obtained from bode plots.
Extraction of DNA from bacterial biofilm
Genomic DNA was extracted from pure cultures, For DNA extraction, cotton swabs were mixed with 300ml DNA extraction buffer I (150mM Na2EDTA, 225mM NaCl; pH 8.5) and 45ml lysozyme (50mg/ml). After incubation at 37 °C for 30 minutes, 9ml 25% SDS and 9ml proteinase K (20mg/ml) were added. After incubation for an additional 60 minutes at 37 °C with agitation, 150ml of prewarmed (90 °C) DNA extraction buffer II [100mM Na2EDTA, 400mM Tris-HCl, 400mM Na2 phosphate buffer (pH 8.0), 5.55 M NaCl, 4% CTAB (hexadecyltrimethyl ammonium bromide); pH 8.0] and 27ml 25% SDS were added. After incubation at 65 °C for 60 minutes the samples were subjected to three cycles of freezing (280 °C) and thawing (65 °C). One hundred forty micro liters was subsequently used for purification of DNA with the QIAamp Viral RNA Mini Kit (Qiagen, Hilden, Germany) following the protocol of the manufacturer. This kit Removes several PCR inhibitors and contains carrier RNA, which facilitates the elution of small amounts of RNA as well as DNA. DNA was eluted with 60ml ddH2O and tested for two PCR primers were designed (Oligo, version 3.4; National Biosciences Inc.) to amplify approximately 1,300bp of a consensus 16S rRNA gene: forward primer 63f (59-CAG GCC TAA CAC ATG CAA GTC-39) and reverse primer 1387r (59-GGG CGG WGT GTA CAA GGC-39) (Pharmacia). Primers 27f and 1392r were also used.
Amplification of 16S rDNA (Bacteria)
Three micro liters of the extracted DNA was amplified with 2 primers forward primer 63f (51-CAG GCC TAA CAC ATG CAA GTC- 31) and reverse primer 1387r (51-GGG CGG WGT GTA CAA GGC-31) (Pharmacia). PCR product corresponding to nucleotide positions 8 to 926 of the bacterial samples 16S rDNA sequence. All reactions were carried out in 25ml volumes, containing 12.5pmol of each primer, 200mM of each deoxyribonucleoside triphosphate, 2.5ml of 103 PCR buffer (100mM Tris-HCl, 15mM MgCl2, 500mM KCl; pH 8.3), and 0.5U of Taq DNA polymerase (Roche Diagnostics, Mannheim, Germany), increased to 25ml with sterile water. PCR was performed in a Robocycler (Stratagene, La Jolla, CA) with the following thermocycling program: 5 minutes denaturation at 95 °C, followed by 30 cycles of 1 minute denaturation at 95 °C, 1 minute annealing at 55 °C, 1 minute extension at 72 °C, and a final extension step of 5 minutes at 72 °C.
Ten micro liters of PCR products was visualized by electrophoresis in 2% (wt/vol) agarose gels and with ethidium bromide (0.5mg/ ml) staining. To avoid contamination, all solutions were prepared with sterile water (Sigma-Aldrich, Vienna, Austria), autoclaved twice, and treated with hard UV for 90 minutes in 1-ml aliquots. Furthermore, all steps were performed with aerosol-resistant tips in a Clean Spot PCR/UV Work Station (Coy Laboratory Products, Grass Lake, MI). The preparation of the master mix, the addition of template, and the gel electrophoresis of PCR products were carried out in three separate rooms. For each master mix, two negative controls were carried out through the whole procedure, in which water instead of sample material was used to exclude the possibility of false-positive PCR results through cross contamination.
Sequencing of novel 16S rDNA sequences (Bacteria)
Sequence identification was carried out only with samples showing a PCR product after the first 30 amplification cycles. From some samples sequence information was obtained by excising and direct sequencing of reamplified 200-bp the extracted DNA was reamplified with primer 63f (51-CAG GCC TAA CAC ATG CAA GTC- 31) and reverse primer 1387r (51-GGG CGG WGT GTA CAA GGC- 31). To identify microorganisms on the basis of longer 16S rDNA fragments, from most samples 900-bp 16S rDNA clone libraries were constructed. One hundred micro liters of PCR products was purified with a QIA quick PCR Purification Kit (Qiagen) and sequenced with a LI-COR DNA Sequencer Long Read 4200.16 Sequencing reactions were carried out by cycle sequencing with the Sequi Therm system (EPICENTRE, Madison, WI) with 2pmol fluorescently labeled primers and 5U Sequi Therm thermo stable DNA polymerase.
BLAST search and phylogenetic analysis of the novel 16S rDNA sequence
Raw sequences were edited and assembled using the Auto Assembler program (V5.2). All the sequences were used to identify the bacteria with the help of the BLASTn program
http://www.ncbi.nlm.nih.gov/BLAST, and all the sequences were submitted to GenBank. The multiple sequence alignment was performed using CLUSTAL-W software package http://www.ebi. ac.uk/Tools/clustalw2/index.html. Significant database hits were aligned with our unknown sequence by using ClustalW software in MacVector (Genetics Computer Group, Oxford Molecular Co). A neighbor joining phylogenetic tree was constructed from the alignment by using MacVector (Genetics Computer Group, Oxford Molecular Co). A distance matrix was constructed by using a Tamura-Nei model without gamma correction and with gaps distributed proportionately. The phylogenetic tree was constructed by using four tree making algorithms, the UPGMA, KITSCH, FITCH and DNAPARS of the PHYLIP package [17]. The stability among clads of a phylogenetic tree was assessed by taking 1000 replicates of the dataset and was analyzed using the programs SEQBOOT, DNADIST, UPGMA and CONSENSE of the PHYLIP package. Neighbor-joining bootstrap values were derived from 1,000 replications and were added to the tree.
Nucleotide sequence deposition numbers
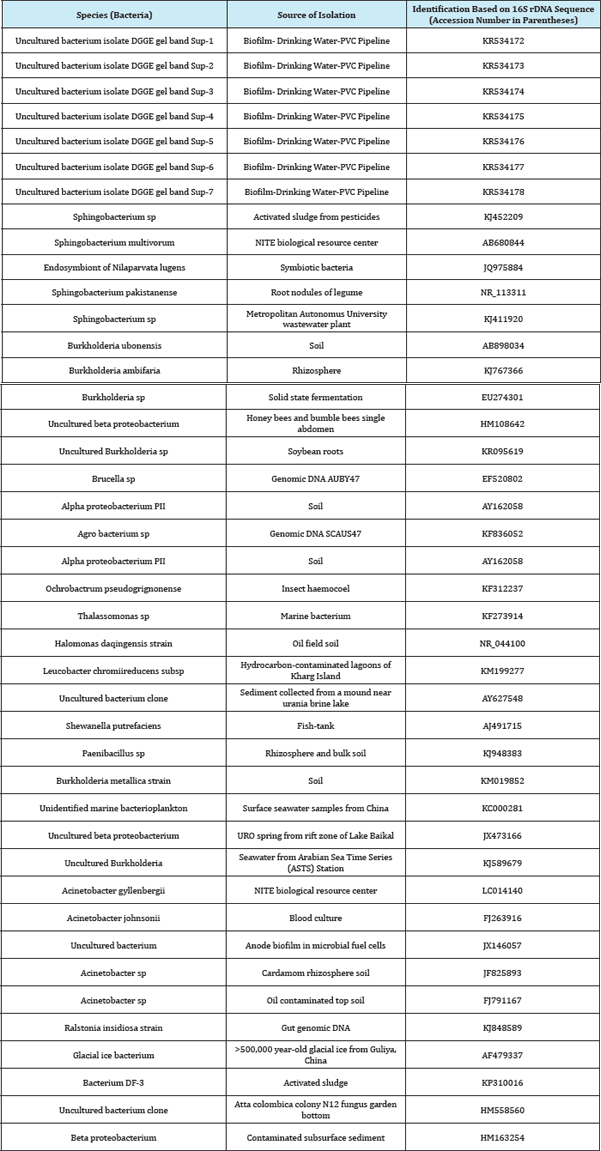
All the nucleotide sequences were deposited in the EMBL/ GenBank/DDBJ databases. Nucleotide sequences of the 16S-23S rDNA spacer region of Uncultured Ochrobactrum clone, Uncultured bacterium clone, Spingobacterium species, Ochrobactrum species, Uncultured organism clone, Spingobacterium thalpophilum, Acinetobacter species, were deposited under the accession numbers KR534175, KR534176, KR534177, KR534174, KR534173, KR534172, KR534178 respectively (Table 1).
Table 1: Bacterial strains and their 16s rDNA and 16s-23s ITS GenBank accession number.
Results and Discussion
Identification of biofilm products in PVC materials
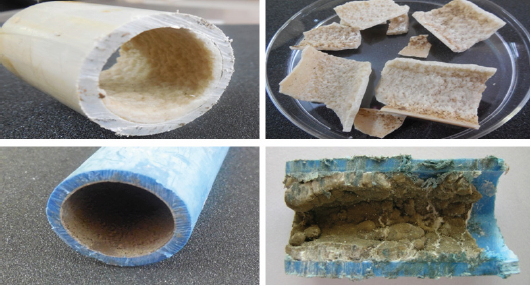
Surface morphology of the biofilm samples of four PVC pipe materials was first examined to determine the surface features of the historical biofilm products on the pipe surface which was in practical equilibrium with conventionally treated Drinking water in the distribution systems (Figure 1).
Figure 1: Biofilm samples collected from drinking water PVC pipelines.
XRD analysis
The results of XRD pattern for biofilm collected from PVC shows the deposition of Ca(HPO4), β Ca2P2O7, β Ca2(PO4)2, Mg3 Ca3(PO4)4, βCa2Mg(PO4)2, Ca9(POJ 6(OH), CaJPOJ 5(OH), Ca10(PO4) 6CO3, Ca10(PO4)6. Other oxide Fe2O3 also noticed. It indicates the presence of metal oxides and carbonates are present in the water pipeline biofilm. Based on these XRD results, it can be concluded that the crystalline calcium compounds are mainly associated with other peaks present in XRD (Figure 2).
Figure 2: XRD analysis of biofilm formed in drinking water PVC pipelines.

FT-IR analysis
Figure 3: FT-IR analysis of biofilm formed in drinking water PVC pipelines.
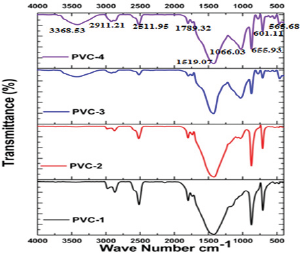
FT-IR spectrum was recorded for the biofilm samples present in Drinking water pipelines and are presented in Figure 3 shows. The peak present at 3368cm-1 can be assigned to the stretching vibrations of primary and secondary amines. The corresponding bending vibration was seen at 2911cm-1 can be assigned to the C-H stretching vibrations of alkane compounds. A peak observed at 2511cm-1 can be assigned to the P-H stretching vibration. The peak observed at 1789cm-1 can be assigned to the C=O stretching vibrations of metallic carbonates. The presence of bacterial proteins within all CaCO3 crystalline is indicated by strong amide II bond was observed at 1519cm-1. The peak noticed at 1066cm-1 can be assigned to the presence of P-O-H bands. The peak 655cm-1 that provide evidence of the formation of mixed phase of calcite and aragonite [18]. The peak noticed at 601cm-1 can be assigned to the PO42- stretching vibrations respectively. The peak noticed at 565cm-1 can be assigned to the C-Br stretching vibrations. In this FT-IR studies shows that the biofilm formation in PVC pipes is due to Ca present in pipes and this Ca playing a major role in accumulation of other components to form a biofilm in early stages.
RAMAN spectroscopy analysis
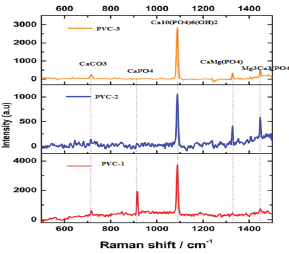
In the Raman spectrum the major peak a raised from the 1103cm1 shows the presence of Ca10 (PO4)6 (OH)2 it is the common peak and highest peak seen in all PVC samples. The peak at 700cm' 1 shows the presence of CaCO3, The peak at 900cm'1 shows the presence of Ca (PO4), the peak at 1320cm-1 shows the presence of Ca Mg (PO4). The peak at 1440cm-1 shows the presence of Mg3Ca3 (PO4)4, and some of very small and the disturbance of the peaks around the major peak due the elimination of the hydroxide and carbonate groups (Figure 4).
Figure 4: RAMAN spectra analysis of biofilm formed in drinking water PVC pipelines.
XRF analysis
Figure 5: XRF analysis of biofilm sample present in drinking water PVC pipelines and Elemental mapping of biofilm.
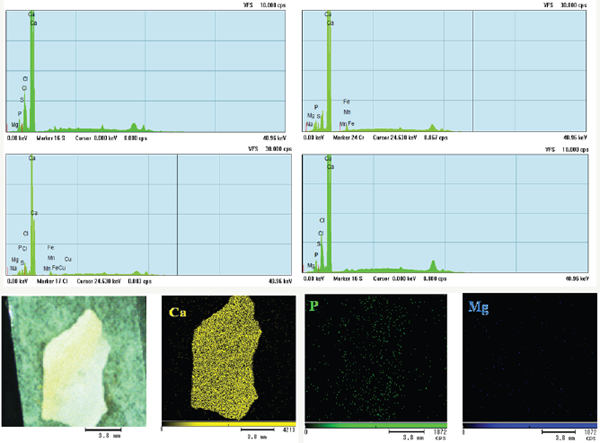
In this XRF analysis is used to detect the elements present in PVC pipe samples. Here in XRF analysis the biofilm sample consists of calcium, magnesium, iron, manganese, phosphate, copper, chloride, potassium and sodium, but the highest peak were raised highly at Ca region then next Cl and P peaks were identified, small peaks of Fe, Mn, Mg, Cu, Na, S. Here in this element mapping of biofilm sample clearly shown (Figure 5) that it has elements like High concentration of Calcium, Magnesium in less level and Phosphate in medium concentration, so with these elements only there is a biofilm formation seen in Drinking water PVC pipelines.
SEM and EDAX analysis
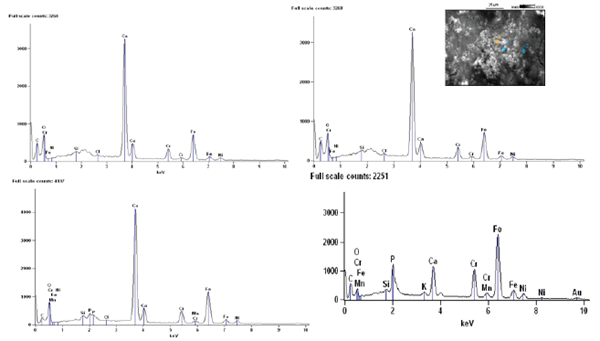
The morphology of biofilm samples from PVC pipelines collected from Drinking water, the size of the biofilm samples were noticed approximately 5-10|im. The higher magnification SEM (Figure 6) image clearly shows Ca(HPO4). These are generally either aggregates of planer, spherical, elongated, or cubic-shaped. EDAX spectra shown calcium element level has higher in the PVC pipelines collected from Drinking water the percentage of calcium was 29.44%. The EDAX reveals that in PVC pipelines calcium precipitating bacteria contains micro crystals of calcium accumulation on the cell wall (Figure 7).
Figure 6: SEM analysis of biofilm samples present in drinking water PVC pipelines.

Figure 7: EDAX analysis of biofilm samples present in drinking water PVC pipelines
XPS analysis
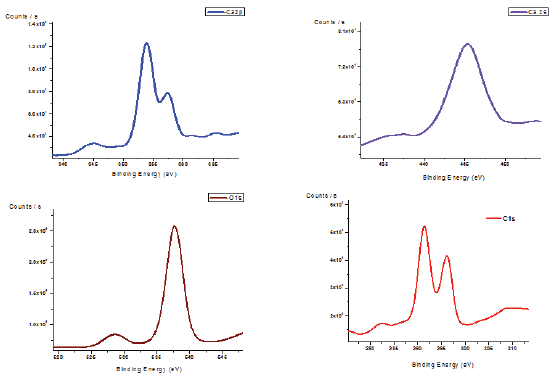
The survey XPS spectra in the binding energy range up to 12000eV identified peaks corresponding to Ca, C, O and P as shown in Figure 8. Figure represents Ca2p, O1s, C1s spectra for biogenic biofilm (lab induce scale formation by calcium precipitating bacteria). The calcium peak at 358eV and O1s peak at 528 were assigned to CaCO3. The oxygen peak at 538eV is attributed to oxygen in carbonate. The O1s peak revealed two peaks at 528 and 538eV corresponding to oxygen in CaCO3 and Ca3P2O7 respectively.
Figure 8: XPS analysis of biofilm samples present in drinking water PVC pipelines.
pH analysis (Bacteria)
Figure 9: pH curve of mixed bacterial culture collected from biofilm present in drinking water PVC pipelines.
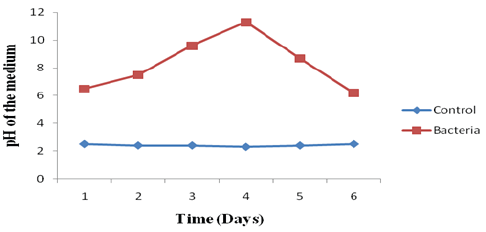
The pH curves of mixed Bacteria in nutrient medium were plotted in Figure 9. The initial pH of the medium was 3.5. In the control system, the pH of the medium was 3.5 at the end of 6th day. In the presence of bacteria, the pH was 6.0 slightly and it's gradually increased up to 11.4 at 4th day and finally at the end of the 6th day again it gradually decreased towards 6.5. It clearly indicates that the bacterium is alkaliphilic organism.
Bacterial growth rate based on temperature
The temperature curves of mixed bacteria in nutrient medium were plotted in Figure 10. The initial growth of the bacteria in nutrient medium at 37 °C was 0.0. In the control system, the growth of the B4 medium was 0.0 at the end of 10th day. In the presence of bacteria, the growth was 2.5 gradually increasing. It indicates that bacterial growth is depending upon temperature.
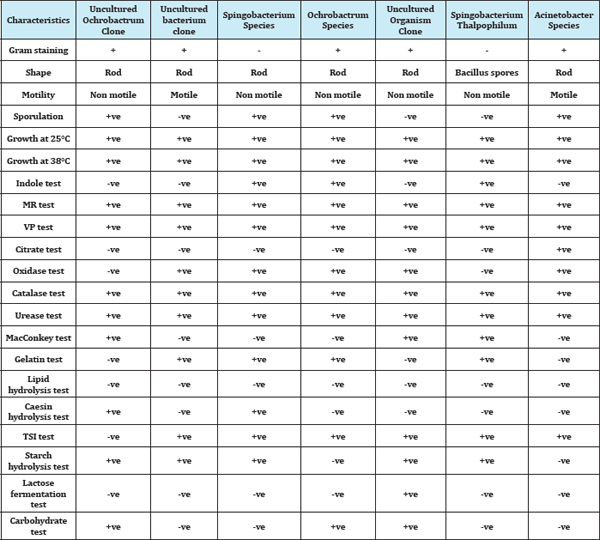
The bacteria were isolated from biofilm sample collected from Tirupathi region. The total viable bacterial count was 4.7*106CFU/ ml. The morphologically different isolates were obtained in the biofilm sample. These cultures were used for further study. All these isolates were characterized by biochemical tests (Table 2). The dominating isolates are positive in urease, catalase and MRVP tests. The selected isolates were grown at various temperatures like 37 °C.
Figure 10: Growth rate curve of mixed bacterial culture collected from biofilm present in drinking water PVC pipelines.
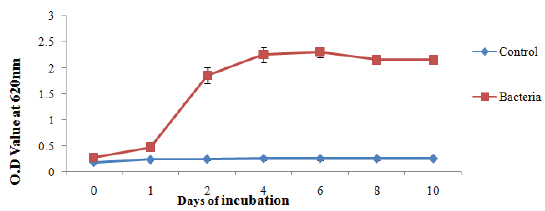
Table 2: Partial biochemical characterization of isolates from drinking water PVC pipeline.
EPI-fluorescence microscopy analysis
Figure 11: Plating and EPI- fluorescence microscopic images of bacterial biofilm isolated from drinking water PVC pipelines.
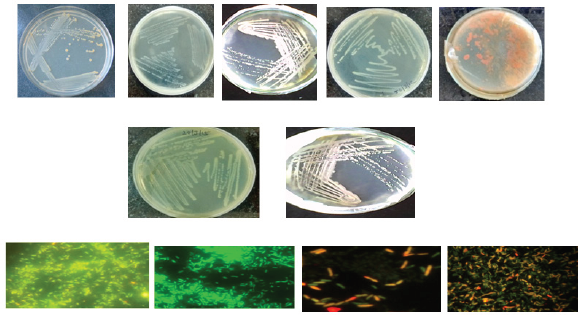
Acridine orange staining (Bacteria): The Epi-fluorescence microscopic photographs while using acridine orange for bacteria isolated from drinking water PVC pipelines are presented in Figure 11. The rod shaped bacteria was observed on crystal surface. It clearly indicates that a bacterium is deposited on crystal surface.
DAPI staining (Bacteria): The DAPI staining binding double stranded DNA to visualize green colour fluorescence it shows the chromosomal DNA and also it indicates live and dead cells of bacteria (Figure 12).
Figure 12: Showing the DAPI- staining of bacterial biofilm isolated from drinking water PVC pipelines.

Electro chemical studies
Figure 13: Impedance behaviour for mild steel in the Presence of bacterial sp isolated from drinking water PVC pipelines (anodic and cathodic curve).
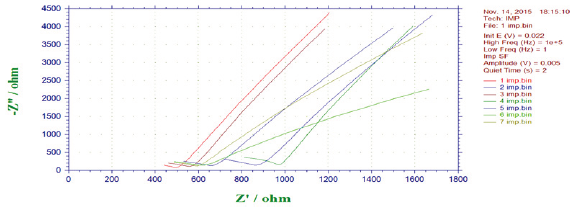
Impedance studies (Bacteria): Impedance behaviour of mild steel coupons in presence and absence of bacteria are presented in Figure 13. The resistance (Rt) of steel in absence of biofilm has 4.4 ohm where as the resistance of steel in presence of bacteria was in the ranges between 594 and 546 ohm. The resistance was higher in bacteria 1 and 2 when compared to that of other bacteria's. It reveals that bacteria enhancing steel corrosion on mild steel affected by changes in the nutrient medium due to bacterial growth.
Polarization studies (Bacteria): Polarization data (anodic and cathodic) for mild steel in the presence and absence of bacteria the corrosion current (icorr) value for control system was 2.42x10⁶A/ cm2 show that there was slight significant difference of icorr between control and bacterial inoculated system 3.21x-8.05A/ cm2 (Figure 14). The polarization study indicates the decreasing of cathodic current by the formation of cathodic inhibitors, viz., calcite and aragonite subsequently, due to the penetration of chloride, calcite formation may reduce the resistance of the steel. The nature of curve varied due to carboxylic acid and calcium deposition on the steel.
Figure 14: Polarization behaviour for mild steel in the Presence of bacterial sp isolated from drinking water PVC pipelines.

Isolation of genomic DNA, PCR amplification and sequencing of 16S rDNA (Bacteria)
Generally, PCR was done twice with template DNA obtained from each of the duplicate extractions per sample. Samples producing reproducible PCR products four times were regarded as PCR positive. In cases of negative PCR results in all amplifications, the samples were regarded as PCR negative. Nine samples showed very faint bands in agarose gels in only one of the duplicate DNA extractions. Therefore, they were amplified twice more under the same conditions. Because these very faint bands were reproducible in total, 10 investigated bacterial sp showed reproducible PCR products after 30 amplification cycles (Figure 15). Comparison of sequences with sequences listed in the EMBL database revealed that most of them had sequence similarities of 78% to 100% to sequences of known genera. As the investigated sequences were only parts (between 121 and 536bp) of the approximately 1600-bp- long 16S rDNA, a clear phylogenetic affiliation was obtained only to the genus and not to the species level. Generally, a reliable phylogenetic identification based on partial 16S rDNA analysis is often only possible to the genus level. For some sequences a clear identification to the genus level was not possible. The low sequence similarity value to known bacteria reveals that this sequence represents a new genus. The problem of inadequate phylogenetic identification could be improved by sequencing of the entire 16S rDNA (Figure 16) [19].
Figure 15: Detail of the ethidium bromide- stained 16S rDNA reamplified clones and excised bands derived from 7 bacteria isolated from drinking water PVC pipelines, from which 16S rDNA fragments could be amplified successfully after 30 amplification cycles.
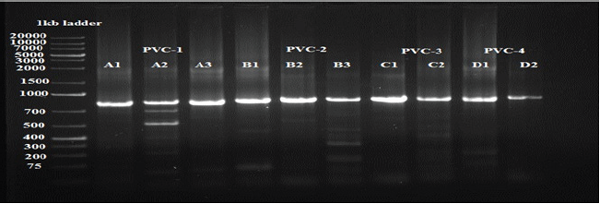
Figure 16: Neighbor-joining tree based on 16SrRNA gene sequences, showing the phylogenetic position of bacterial sp present in drinking water PVC pipelines.
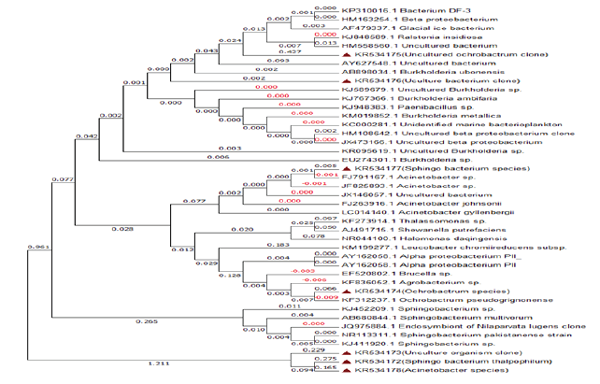
Table 3: Similarity values for 16S-23S rDNA spacer (ITS) sequences (lower left) and 16S rRNA sequences (upper right) for representatives of the biofilm (Bacteria) present in drinking water PVC pipelines.

Furthermore, number of 16S rDNA sequences in public databases is increasing day by day, a better identification of so far unknown bacteria and fungi may be possible in the future. The obtained results are mostly in accordance with results of other studies based on cultivation. Most bacteria and fungi frequently observed in this study are expected pathogenic organisms causing biofilm problem in PVC pipelines. The preliminary identification of the bacteria by biochemical test, fungi by morphological study through Epi-fluroscence microscope indicated the isolates. The sequences obtained were submitted to BLAST search to retrieve the corresponding phylogenetic relatives. The phylogenetic affiliations were confirmed by the analyses of all the related species recognized by the taxonomic and classification hierarchy done using the NCBI. The phylogenetic tree was constructed to analyze the relationship among the sequences of the ribosomal library and related organisms from the GenBank database and similarity values given in (Table 3).
Comparing the microbial population attached to pipe surfaces with the bacteria present in the bulk water- clear differences were observed in both a model system and a field distribution system [20], Recently the calcium precipitating bacteria in orthodontic wire and marine water systems were studied by [21,22]. It is noted that both of the studies were conducted in a distribution system with a chlorine residual, indicating the results may be influenced by the selective pressures on the bulk water bacteria posed by disinfection. On the other hand, as the bulk water bacteria are living freely suspended in the water and the pipe wall biofilm bacteria are growing on a support surface, the difference may also be attributed to the varying attachment capabilities of different groups of bacteria. If the conclusion that the majority of the biomass is in the biofilm and that bulk water bacteria mainly originate from pipe wall biofilm detachment is true, then the difference could also be related to the detachment Properties of the biofilm bacteria [23]. For example, only the top layers (loose structure) are readily released into bulk water, and the inner biofilm remains attached to the pipe wall. As only bacteria community information of bulk water and pipe wall biofilm is available, it is not possible to make a comparison of bacteria from all four phases. bacteria associated with suspended solids and loose deposits, Similar to the pipe wall, the particles in distribution systems offer surfaces for bacteria to attach to and to form biofilm [24].
The major concern of these particle-associated bacteria is that the suspended solids/ loose deposits can protect bacteria from disinfection by chlorine [25], ozone [26], and ultraviolet light [27]. Among the limited available information about loose deposit bacteria, pathogens and opportunistic pathogens have been reported, such as Mycobacteria [28]. Considering the better mobility of particle-associated bacteria than pipe wall biofilm bacteria, the former may be transferable throughout distribution systems. During the hydraulic peaks, these particle-associated bacteria may even reach customers' taps [29] and be consumed by customers. This can potentially lead to increased exposure in the case of particle-associated (opportunistic) pathogens.
Conclusion
In this study, we collected four PVC pipes and studied the biofilm morphology, Characterization of biofilm samples through XRD, XRF, RAMAN, FT-IR, and SEM and EDAX we conclude that biofilm sample was composed of different calcium containing materials like, Ca(HPO4),β Ca2P2O7, β Ca2(PO4)2, Mg3 Ca3(PO4)4, β Ca2Mg(PO4)2, Ca9 (PO4) 6(OH), Ca10(PO4) 5(OH), Ca10(PO4) 6CO3, Ca10 (PO4)6 The presence of metallic carbonate and phosphates noticed by FT-IR. SEM analysis revealed that the biofilm samples morphology is tetragonal, rhombohedral, monoclinic, anorthic and hexagonal with 200nm. RAMAN spectrograph revealed that the top most layer of biofilm consists of high concentration of calcium carbonate and middle layer is accumulated by calcium carbonate and sharing with another compound that is calcium hydrogen phosphate, finally the bottom layer of the biofilm consists of calcium phosphate present in huge amount simultaneously calcium carbonate is also present in bottom layer with less quantity. The work presented here indicates that biofilms are ubiquitous in water distribution systems but they don't represent a common habitat for hygienically relevant organisms. On the basis of results, it is concluded that the calcium is one of the causative factor of biofilm formation in drinking water PVC pipelines.
References
- Holden B, Greetham M, Croll BT (1995) The effect of changing inter process and final disinfection reagents on corrosion and biofilm growth in distribution pipes. Wat Sci Tech 32(8): 213-220.
- Astier F, Paquin JL, Mathieu L, Morlot M, Hartemann P, et al. (1995) Etude en Pilote du Developpement du Gout de Moisi en Fonction du Vieillissement de L'Eau Study of the Development of the Musty Taste in Water According to Its Ageing Process in Pilot Plant. Environ Technol 16(10): 955-965.
- Buswell CM, Herlihy YM, Lawrence LM, McGuiggan JTM, Marsh PD, et al. (1998) Extended survival and persistence of Campylobacter spp. in water and aquatic biofilms and their detection by immunofluorescent- antibody and -rRNA staining. Appl Environ Microbiol 64(2): 733-741.
- Bois FY, Fahmy T, Block JC, Gatel D (1997) Dynamic modeling of bacteria in a pilot drinking-water distribution system. Wat Res 31(12): 31463156.
- Beck GS (1995) Water Environ. Technol pp. 46-49.
- Lehtola MJ, Miettinena IT, Keinanen MM, Kekkia TK, Laineb O, et al. (2004) Microbiology, chemistry and biofilm development in a pilot drinking water distribution system with copper and plastic pipes. Water Res 38(17): 3769-3779.
- Boustead I (1999) Liquid epoxy resins the Association of Plastic Manufacturers in Europe Brussels Belgium.
- Chang YC, Le Puila M, Bigger staff J, Randall AA, Schultec A, et al. (2003) Direct estimation of biofilm density on different pipe material coupons using a specific DNA-probe. Mol Cell Probes 17(5): 237-243.
- Beardsley M, Adams C (2003) Modeling and control of vinyl chloride in drinking water distribution systems. J Environ Eng 129(9): 844-851.
- Maruthamuthu S, Dhandapani P, Ponmariappan S, Sathiyanarayanan S, Muthukrishnan S, et al. (2010) Anal and Preven 6: 1168-11679.
- Cosrerton JW, Ladd GG, Nickel JC, Dasgupta MK, Marie TJ, et al. (1987) Bacterial biofilms in nature and disease. Annu Rev of Microbiol 41: 435464.
- Manz W, Szewzyk U, Ericsson P, Amann R, Schleifer KH, et al. (1993) In situ identification of bacteria in drinking water and adjoining biofilms by hybridization with 16S and 23S rRNA-directed fluorescent oligonucleotide probes. Appl Environ Microbiol 59(7): 2293-2298.
- Feazel LM, Baumgartner LK, Peterson KL, Frank DN, Harris JK, et al. (2009) Opportunistic pathogens enriched in showerhead biofilms. Proc Natl Acad Sci U S A 106(38): 16393-16399.
- Eichler S, Christen R, Holtje C, Westphal P, Botel J, et al. (2006) Composition and dynamics of bacterial communities of a drinking water supply system as assessed by RNA- and DNA-based 16S rRNA gene fingerprinting. Appl Environ Microbiol 72(3): 1858-1872.
- Massieux B, Boivin MEY, Vandenende FP, Langenskiold J, Marvan P, et al. (2004) Analysis of structural and physiological profiles to assess the effects of Cu on biofilm microbial communities. Appl Environ Microbiol 70(8): 4512-4521.
- Pozos N, Scow K, Wuertz S, Darby J (2004) UV disinfection in a model distribution system: biofilm growth and microbial community. Water Res 38(13): 3083-3091.
- Felsenstein J (1989) PHYLIP-phylogeny inference package (version 3.2). Cladistics 5: 164-166.
- Wang L, Sondi I, Matijevic E (1999) Preparation of uniform needle-like aragonite particles by homogeneous precipitation. J Colloid Interface Sci 218(2): 545-552.
- Rajasekar A, Anand kumar B, Maruthamuthu S, Yen PT, Rahman KSM, et al. (2010) Characterization of corrosive bacterial consortia isolated from petroleum-product-transporting pipelines. Appl Microbiol Biotechnol 85(4): 1175-1188.
- Henne K, Kahlisch L, Brettar I, Hofle MG (2012) Analysis of structure and composition of bacterial core communities in mature drinking water biofilms and bulk water of a citywide network in Germany. Appl Environ Microbiol 78(10): 3530-3538.
- Dhandapani P, MuraliKannan M, Anand kumar B, Maruthamuthu S, Manoharan SP, et al. (2014) Electrochemistry of calcium precipitating bacteria in orthodontic wire. Oral Science International 11(1): 22-29.
- Supraja N, Maruthamuthu S, Prasad TNVKV (2015) Syn and Rea in Inorg, Metal-Org, and Nano-Metal Chem.
- Momba MNB, Binda F (2002) J Appl Microbiol 91: 1-8.
- Winkelmann N, Harder J (2009) An improved isolation method for attached-living Planctomycetes of the genus Rhodopirellula. J Micorbiol Methods 77(3): 276-284.
- Ridgway HF, Olson BH (1981) Scanning electron microscope evidence for bacterial colonization of a drinking-water distribution system. Appl Environ Microb 41(1): 274-287.
- Hess Erga OK, Attramadal KJK, Vadstein O (2008) Aquat Bio 4(2): 147154.
- Wu Y, Clevenger T, Deng B (2005) Impacts of goethite particles on UV disinfection of drinking water. Appl Environ Microb 71(7): 4140-4143.
- Torvinen E, Suomalainen S, Lehtola MJ, Miettinen IT, Zacheus O, et al. (2004) Mycobacteria in water and loose deposits of drinking water distribution systems in Finland. Appl Environ Microb 70(4): 1973-1981.
- Boe HR, Albrechtsen HJ, Arvin E, Jorgensen C (2002) Bulk water phase and biofilm growth in drinking water at low nutrient conditions. Water Res 36(18): 4477-4486.
© 2017 Suprajaa N, et al. This is an open access article distributed under the terms of the Creative Commons Attribution License , which permits unrestricted use, distribution, and build upon your work non-commercially.
 a Creative Commons Attribution 4.0 International License. Based on a work at www.crimsonpublishers.com.
Best viewed in


.jpg)


 Editorial Board Registrations
 Submit your Article
 Refer a Friend
 Advertise With Us
.jpg)


.jpg)


.bmp)
.jpg)
.png)
.jpg)


.jpg)


.png)

.png)


.png)


