
- About Us
- Information
-

The Author ensures that the research has been conducted responsibly and ethically with adherence to all relevant regulations. read more..
- For Authors
- For Reviewer
- Manuscript Guidelines
- Membership
- Publication Ethics
-
- Journals
- Reprints
- e-Books
- Videos
- Policies
- Contact Us
 COVID-19
- Submissions


Full Text
COJ Biomedical Science & Research
Enhanced Luminescence Studies of Synthesized Ca2MgSi2O7: Ce3+ Phosphor
Shashank Sharma1* and Sanjay Kumar Dubey2
1Department of Physics, Dr. C. V. Raman University, Kota Bilaspur (C.G.), 495113, India
2Department of Physics, Dr. Radha Bai Navin Girls College, Raipur (C.G.), 492001, India
*Corresponding author: Shashank Sharma, Assistant Professor, Department of Physics, Dr. C. V. Raman University, Kota Bilaspur (C.G.), Indi
Submission: January 24, 2023; Published: February 27, 2023

Volume2 Issue3February , 2023
Abstract
A promising candidate of purple blue Ca2MgSi2O7: Ce3+ phosphor sample was successfully fashioned via high temperature solid-state reaction technique and characterized in terms of structural, morphological, optical and thermal properties using XRD, FESEM, EDX, FTIR, PL, TL properties including with CIE chromaticity diagram. The results of the powder XRD patterns clearly informed that this sintered crystal structure demonstrates tetragonal crystallography (i.e., akermanite phase structure) with a space group (i.e., P¯421m). The average crystallite size (D) is calculated to be about 70nm. The actual formation and absorption of different functional groups was well clarified by FTIR. The PL emission spectra show the 5d-4f allowed transition of Ce3+ ions. This phosphor is a promising candidate of long persistent mechanism because the activation energy (i.e., trap depth) of the sintered sample was obtained in the range between (1.27eV-1.69eV). It can also be applicable in high temperature dosimetry applications. The favorable features for applications likewise near UV-LED conversion phosphor, white light emitting diodes (WLEDs), long-persistent afterglow properties, solid-state lighting devices, drug delivery, tissue engineering, bone material, detection of cancer disease, DNA transplantation, and Image processing of computer science etc.
Keywords:XRD; FTIR; Ca2MgSi2O7: Ce3+; Tetragonal; WLEDs; Solid-state reaction
Introduction
Commercially, white light is mostly obtained through the combination of blue LED chip and yellow emitting YAG: Ce3+ phosphors [1]. Blue and yellow color is well suitable for the correlated color temperature which plays an important role from the point of view of the generation of white light emission. During experimental observations it has been obtained that the blue color increases the color temperature while on the other hand yellow color decreases the color temperature. In this way, white light is emitted. Compared to various rare-earth ions, Cerium (Ce) and Europium (Eu) ions have often been chosen because of their efficient 5d-4f transitions. For this reason, indeed many Eu-doped and Ce-doped phosphor materials have been extensively investigated as scintillators [2]. Silicates are very better luminescent materials mainly because of their rigid and stable crystal structure. Many of the silicate-based phosphors doped with divalent or trivalent rare earth materials have been preferred for utilized as commercial phosphor in fluorescent lamps & scintillators etc. [3,4]. Silicate based phosphors have been extensively investigated because of their high thermal and chemical stabilities, excellent water-resistance properties, abundant nature, easier synthetization process, cheaper (i.e., low cost) and strong absorption in the near-UV [ultraviolet] region [5-8] and varied luminescence color from blue to yellow region [9]. Due to their special characteristics, they are better than sulfide & aluminate-based phosphors and play a leading role in luminescence field. The akermanite might be considered a probable bone material [10] and tempting bio-ceramic for tissue engineering applications [11]. For PC (i.e., phosphor converted) based WLEDs, rare-earth Ce3+ (as an activator ion) have been potentially applied in luminescence materials. The reason behind all this is that the rare-earth Ce3+ doped luminescent materials (i.e., phosphor) exhibits very strong intense bands (both excitation & emission spectra) due to the spin allowed (i.e., 5d-4f energy level) transitions between lower energy level (i.e., ground state) to higher energy level (i.e., excited state) of Ce3+ ions. Akermanite type structure such as M2MgSi2O7 (where M=Ca, Sr) activated with Eu2+ and Dy3+ phosphor has displayed quite better long-persisting behavior mechanism and have received continuous attention for their potential uses as white light-emitting diodes (WLEDs) [12-19]. Simultaneously, the results obtained from experimental observations gave a better indication that trivalent Cerium rare-earth ions [Ce3+] could not only be trap centre but also perform as luminescence-centre [20]. In this present investigation, we are informed of a well detailed study regarding the luminescence properties likewise (i.e., structural, morphological, optical and thermal) of Ca2MgSi2O7: Ce3+ phosphors which were successfully synthesized by a conventional solidstate reaction technique (basically applied in high temperature treatment). In addition, we have also clearly indicated that Ce3+ ions are responsible for enhancing the long-persisting afterglow characteristics in Ca2MgSi2O7 phosphor and make their valuable contribution. However, Ce3+ ions have a tendency to enhance their better luminescent characteristics is found well appropriate as compared to other rare-earth ions. The main intension behind this significant research is to focus on Ca2MgSi2O7: Ce3+ phosphor as a better choice for high temperature dosimetry, favorable WLEDs and long-persistent afterglow applications.
Experimental Analysis
Material preparation
A sample with the general structure formula Ca2MgSi2O7: Ce3+
(CMSC) was successfully fashioned via conventional solid-state
synthesis technique. The initial precursor reagents likewise CaCO3
(AR), MgO (AR), SiO2 (AR) and CeO2 (AR) with very small quantities
of H3BO3 (AR) added as flux were utilized in our experiment.
The precursor chemical reagents were weighed according to
stoichiometrically compositions and mixed homogeneously using
CH3COCH3 (AR) in an agate mortar & pestle for 2h. The prepare
mixture was sintered for 4h under a weak reducing atmosphere
(i.e., using activated charcoal) at 1100 °C temperature. In this way,
the obtained white powder sample after the cooling down of the
programmable furnace and subsequently converted into a super
fine powder sample by going through additional grinding process.
In an airtight bottle, the final phosphor sample was restored for
further structural and optical characterization studies.
The chemical reaction of synthesis process is given as follows:
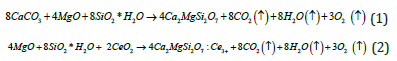
The reaction process involves the chemical decomposition of CaCO3 when the temperature is higher than approximate 950 °C according to following reaction process

Material characterization
For crystal structure and phase identification, X-ray powder diffraction patterns of the synthesized sample was carried out in an extensive range (10°-80°) of Bragg angle 2θ using a Bruker D8 advanced X-ray diffraction measuring instrument with Cu-Kα target radiation (λ=1.54056Å). Surface morphology of the sample was examined and EDX analysis performed with the help of SEM (ZEISS model microscope) fitted with EDX. FTIR spectrum was also recorded (Bruker Alpha FTIR Spectroscopy) to identify the vibrational features of the sample. Photoluminescence (PL) data were recorded using with the help of RF- 5301PC SHIMADZU Spectro fluorophotometer. Both Emission and excitation spectra were characterized with the help of a spectral slit width of 1.5nm at room temperature and CIE diagram was recorded using Go-CIE software. The PL decay was recorded with the help of an RCA 931 photomultiplier tube (PMT). The thermoluminescence (TL) data were collected using a TL Reader (Integral- PC Based) Nucleonix TL 1009I.
Result and Discussion
XRD analysis
In sequence to identify the phase structure, crystalline size, lattice constant powder XRD (X-Ray Diffraction) analysis has been recorded. The actual peak position and relative intensity of XRD diffraction patterns (Figure 1) of the synthesized Ce3+ doped Ca2MgSi2O7 phosphor was well clarified and examined to be well agreement with the actual powder XRD pattern with the help of JCPDS PDF file #77-1149 [21] and AMCSD DATA BASE CODE 0008032 [22]. The results of the powder XRD patterns clearly informed that this sintered crystal structure demonstrates tetragonal crystallography (i.e., akermanite phase structure) with a P¯421m space group (i.e., 113 space number and D32d space group) as well as cell parameters likewise a =b =7.8071 Å, c = 4.9821 Å & α=β=γ=90° and the cell volume is 303.663 (Å)3, molar volume 92.619 (m3/mol) as well as density is 2.944 (g/cm3). This crystal structure of sintered sample is an actual member of the melilite group and creates a layered compound. The crystal field symmetry and hence the effect of field on the shifting of emission lines is strongly dependent on the relative contents of these single crystal phase. The average crystallite size (D) was calculated from the XRD pattern with the help of Debye-Scherrer’s relation [Eq. 4]:
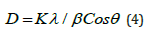
Figure 1:XRD Pattern of Ca2MgSi2O7: Ce3+ Sample.

Where is the general meaning of the symbols displayed in the equation such as: D denotes the crystallite size relevant for the (hkl) plane, 𝜆 denotes the incident wavelength of X-ray radiation [Cu-Kα (0.154nm)], β (in radians) denotes the FWHM (full width at half maximum), and 𝜃 denotes relevant Bragg diffraction angle [23]. Sharper and isolated X-ray diffraction peaks likewise 2𝜃=25.13 (210), 29.19 (201) 31.24 (211), 32.75 (220), 38.64 (102), 44.07 (212) were chosen for crystallite size evaluation. The relevant crystallite size is ~79nm, 76nm, 70nm, 69nm, 66nm, 65nm was evaluated with the help of the Debye-Scherrer’s formula respectively and the average crystallite size is obtained ~70nm. We observe that the doping of Ce3+ ion did not affect the phase crystal structure in any way.
FESEM analysis
It is absolutely true that the luminescence characteristics of any particles (i.e. Nano or Micro) are clearly defined on the basis of their corresponding specific properties likewise size, shape, size distribution, defects which depending on the morphology of the particles. FESEM images of the sintered Ca2MgSi2O7: Ce3+ powder sample is clearly displayed in 2μm range with single magnification (10.00 KX) in Figure 2. FESEM (Field Emission Scanning Electron Microscopy) image clearly indicated that the surface morphology of the particles in prepared sample was not uniform and they were tightly aggregated to each other with different particle size distribution. In addition, due to the high temperature heat treatment some big aggregates are clearly evident in this morphology of the particles.
Figure 2:FESEM Image of Ca2MgSi2O7: Ce3+ Sample.

EDX analysis
For an in-depth analysis of the chemical composition of any powder sample, it has been measured with the help of EDX (Energy Dispersive X-ray Spectroscopy) spectra. It is better utilized as an actual procedure for quantifying & identifying elemental composition of any specimen region as small as a few nanometers. The actual evidence of elements likewise Ca, Mg, Si, O and Ce sharp peaks are clearly present in EDX spectra which preliminary indicates the actual formation of the sample in Figure 3. Along with the clear evidence of rare-earth Cerium ions in their relevant EDX spectrum image. As such, their EDX spectrum showed no emission peaks other than (Ca)calcium, Si (silicon), (O)oxygen, Mg(magnesium) Ce(Cerium). The elements present the actual chemical composition with respect to Weight % and Atomic % also analyzed which is displayed in Table 1.
Figure 3:EDX Spectra of Ca2MgSi2O7: Ce3+ Sample.

Table 1:Evidence of expected elements in Ca1.96MgSi2O7: 0.04Ce3+ by weight % and atomic weight %.

FTIR analysis
The FTIR (Fourier Transform Infra-Red) spectroscopic analysis has been extensively utilized for the investigation of organic & inorganic compounds and identification of absorption bands as well as different functional groups which is clearly present in spectra [24]. In examined Infra-red [IR] spectrum (i.e., υ1 symmetric stretching, υ2 symmetric bending and υ3 asymmetric stretching, υ4 asymmetric bending), the absorption bands of silicate groups and various functional groups were clearly evident [25,26]. The IR (Infra-red) spectra of Ca2MgSi2O7: Ce3+ phosphor sample in the range between (4000 to 400cm-1) are displayed in Figure 4. The vibration modes of (SiO2) bands clearly peaked at 496.81 & 634.65cm-1 and tetrahedral Si4+ sites lie at 687.79, 896.27, 983.54 and 1092.39cm- 1. The intense band allocated at 896.27, 983.54cm-1 between the range of (800-1000cm-1), because of the (Si-O-Si) asymmetric stretching. In addition, the existence of the (Si-O-Si) vibrational mode, bands centered at 496.81cm-1 respectively [27]. The band peaked at 3546.43cm-1, indicating the vibrational stretching of (OH) group because of the existence of moisture via atmosphere [28]. The intense band peaked at 478.51cm-1, because of the presence of [Mg-O] vibration mode. At 1678.64cm-1 the vibration band is recorded because of the [Mg2+] ion and bending of the sharp peaks allocated in the region of 896.27 and 794.68cm-1 because of the vibration mode of [Ca2+] ion. A typical property of the IR spectrum is the observed influence of the vibration from the doping ions Ce3+ in the host lattice crystal structure. The spectrum of sintered sample displays a vibration band at 1678.64 and 1469.32cm-1, which was clearly responsible for Ce3+ ions. Such a way, Ce3+ ions are expected to substitute Ca2+ lattice site in the host crystal lattice (Ca2MgSi2O7) because the ionic radii of Ce3+ and Ce2+ ions are 1.143 and 1.12Å, respectively, and match closely. Ce3+ does not replace Mg2+ and Si4+ ions because the ionic radius of Mg2+ (0.89Å) & Si4+ (0.40Å) are far smaller than that of Ce3+ ions [29].
Figure 4:FTIR Spectra of Ca2MgSi2O7: Ce3+ Sample.

The vibration modes of Mg2+ and Ca2+ ions peaked at 1678.64 & 1469.32cm-1 respectively. When Ce3+ ion enters the host lattice site, it substitutes Ca2+ lattice sites which are clearly responsible for distortion in host crystal lattice site. The actual position of Ca2+ lattice site was clearly substituted by Ce3+ ions and the actual Ca2+ is located somewhere else. Therefore, the vibration mode of Ca2+ at 1469.32cm-1 is clearly observed with Ca2MgSi2O7: Ce3+ sample. The vibration mode of Mg2+ was observed at 1678.64cm-1 which are clearly responsible for the same distortion in the host crystal lattice site. The coordination number of calcium can be shown 6 and 8 [18] in sintered sample. Therefore, [Ca2+] lattice sites can occupy two alternative lattice sites, the six coordinated [Ca2+] site [CaO6 (Ca (I) site)] and the eight coordinated [Ca2+] site [CaO8 (Ca (II) site)]. We have also examined that in the crystal lattice sites, Mg2+ [MgO4], and Si4+ [SiO4] also exist, other two independent cations sites. Divalent magnesium [Mg2+] and tetravalent [Si4+] cations occupy in the tetrahedral sites [19,20]. The coordination no. of Cerium ion can be 6, 7, 8, 9 and 10 respectively. When Ce3+ ion enters the host crystal lattice site, it will only substitute the original Ca2+ lattice sites [17,18,21-23]. Eventually, Ce3+ doping ions will clearly acquire two alternative crystal lattice sites [Ce (I) and Ce (II)] with coordination no. of 6 and 8 respectively. After doping, Ce (I) and Ce (II) would be activated into different energy levels, thus resulting in different spectra.
Photoluminescence (PL) analysis
The PL spectra (both excitation & emission) of synthesized sample were characterized in the range between (250-350nm) & (350-500nm) wavelengths at room temperature which are clearly displayed in Figure 5 respectively. Such a way, synthesized Ca2MgSi2O7: Ce3+ sample exhibited strong absorption in the UV band and simultaneously emitted a blue light when excited by UV light which relevant to the energy level transitions from the ground state (i.e., lower energy level) to the different crystal field splitting energy levels of 5d state for Ce3+ ions. It is known about the Ce3+ doping ion that it has only single outer electron and only two spin-orbital splitting 4f energy states via 2F5/2 & 2F7/2. It has a very similar & better stimulated state energy structure as compared to another doping ion likewise Eu2+, Dy3+, Er3+, Gd3+ etc. In excitation spectra, at 338nm wavelength, the optimum peak is centered, and someanother spectral peak situated at 282nm. Under 338nm excitation spectra, the sintered sample displays an intense and broad purpleblue emission band at 392nm which is responsible to 5d-4f allowed transition of Ce3+ ions from lower energy level (i.e., ground state) to higher energy level (i.e., excited state). This phosphor emits light in the purple-blue region and hence it may be utilized as blue light emitting (LED) phosphor which is very helpful for white light emitting diodes (WLEDs).
Figure 5:Excitation & Emission Spectra of Synthesized Ca2MgSi2O7: Ce3+ Sample.

PL decay curve analysis
The PL (Photoluminescence) decay curve of Ca2MgSi2O7: Ce3+ phosphor sample has displayed in Figure 6 which is irradiated with 254nm light for 2min. During observation, it was found that this sample shows rapid decay process and subsequently also exhibits long-lasting phosphorescence characteristics. Hereby, the intensity of initial afterglow was so high. The decay times can be evaluated with the help of curve fitting technique and the decay curves are fitted by summing of two exponents, as given below in following mathematical expression:
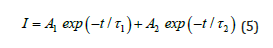
Figure 6:PL Decay Curves of Ca2MgSi2O7: Ce3+ Phosphor.

Where I denote the phosphorescence intensity, A1 and A2 are constants, t is time, and τ1 and τ2 denotes the decay times for the fast and slow decay exponential components, respectively. The fitting results are given in Table 2.
Table 2:Decay curves for exponential components of Ca2MgSi2O7: Ce3+ phosphor.

CIE color chromaticity diagram
The luminescent color is the most essential and important factor for application of phosphors. This colour coordinate of phosphors were examined based on a clear observation of their emission spectra [24,25]. The CIE diagram of Ca2MgSi2O7: Ce3+ phosphor is clearly displayed in Figure 7. It is very clear from the calculated colour-chromaticity coordinate that this [X=0.1896, Y=0.1248] co-ordinate represents the blue light emission from the phosphor. As a result, the colour chromaticity co-ordinate of the luminescent-color emission has been displayed by this phosphor, approaches very close to purple-blue light colour region.
Figure 7:CIE Chromaticity Diagram of Ca2MgSi2O7: Ce3+ Phosphor.

Thermoluminescence (TL) analysis
The phenomenon of TL is related to the process of light emission arising from semiconductors or insulator, either inorganic, crystalline-solid samples. This condition arises when it is heated after being exposed to some irradiation [26]. In such a situation, then the charge carriers likewise holes or electrons are freed. When TL analysis of any phosphor, then the TL glow-curve of that phosphor primly depends on the kinetic (i.e., trapping) parameters which mainly comprise such as [Order of Kinetics b] and [Frequency Factor S] as well as [Activation Energy or Trap Depth] [27]. The peak shape method is a well appropriate method for the determination of kinetic parameters (i.e., trapping parameters) [28].
Correlation between peak shape method and kinetic parameters: To determine the trapping parameters the peak shape method (Figure 8) is being well utilized. This method is an analytical technique which was proposed by Chens, thus also known as Chen’s glow curve method [28]. This method is also useful to detect the position of energy levels in the forbidden energy gap and defect centers [29]. Therefore, the complete analysis of glow curve has been done using this method. Figure 8 display the peak shape of glow curve of the sintered sample. In order, Tm denotes maximum value of temperature, T1 denotes lower (ascending part of glow curve) and T2 denotes higher (descending part of glow curve) temperature at half the intensity, respectively [30-32] and other kinetic parameters (τ,δ,ω) are originated using these temperatures, where (Tm-T1) denotes τ, (T2-Tm) denotes δ and (T2-T1) denotes ω. With the help of these parameters activation energy, order of kinetics and frequency factor is evaluated.
Figure 8:Determination of Peak Shape Method.

Order of kinetics [b]: For glow-curve peak, this parameter can be evaluated with the help of geometric shape factor) [μg] determination from the following mathematical form as below:
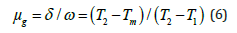
Where Tm represents the prominent peak temperature and T1&T2 denotes temperatures at half intensity on the ascending and descending orders of the glow-curve peak, respectively and [ω=T2–T1] and [δ=T2 –Tm] represents the high-temperature halfwidth. The geometric shape factor is a key part of TL glow-curve peak which is to differentiate between Ist and IInd order kinetics. The mathematical value of geometric shape factor [μg=0.39-0.42] represents for the Ist order kinetics and [μg=0.49-0.52] denotes for the IInd order kinetics as well as for the mixed order kinetics also represent as [μg =0.43-0.48] [29-33].
a) Activation energy (E) or (Trap Depth): The trapped electron needs some amount of energy to free itself, also known as activation energy (i.e., trap depth) which is required to liberate an electron to the conduction band from defects centre [34]. The value of trap-depth (i.e., activation energy) can be evaluated with the help of the following mathematical equation as mentioned, which is valid for any kinetics (i.e., first, second and mixed order-kinetics).
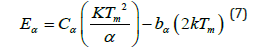
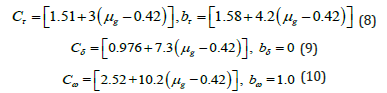
Cα & bα (where α indicates: τ,δ,ω) are determined with the help of the following mathematical equation, which is valid for any general order kinetics [35,36].
b) Frequency factor (s-1): This kinetic parameter is one of the most significant parameters which are used for sample characterization process [37]. This trapping-parameter is calculated by substituting the previously evaluated values of order of kinetics [b] and activation energy [E] in the mathematical equation (as mentioned):
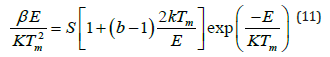
Where k denotes Boltzmann constant, E represents activation energy & b denotes an order of kinetics, Tm represents the prominent temperature of glow-curve peak position, and β (i.e., at present work 50Cs-1) represents the heating rate of the any material sample [38-40].
TL kinetic parameters of Ca2MgSi2O7: Ce3+ phosphor with different UV exposure: For clarity, the TL glow curves of synthesized Ca2MgSi2O7: Ce3+ sample for different UV radiation doses at a fixed heating rate of 5 °Cs-1 are shown in Figure 9. The maximum & minimum TL glow curve peaks were obtained at 109.19 °C temperature. In all glow curve peaks, no important modification in peak position was clearly observed with different UV radiation. It is significant to notice that the fixed and appropriate do-pant concentration is utilized. Simultaneously, it is a potential approach to responsible for optimizing TL efficiency & reforms sensitivity as well as dose-linearity for an exclusive UV-irradiation type and can be highly utilized for high temperature dosimetry applications [41]. Figure 9 displays the TL glow curve of synthesized Ca2MgSi2O7: Ce3+ sample for 5,10,15,20 and 25min UV irradiation. The synthesized micro particles have displayed that the peak intensities approximately between 3684.6-6954.7 units and the peak position was centered at 109.19 °C with single glow curve peaks. TL intensity increases with increasing UV irradiation time. The optimum TL intensity for 15min UV exposure time was obtained at least one single trap clearly evidence in sintered phosphor. However, being able to recognize the actual nature of the trap is still a challenging task in a difficult process. In the meantime, the TL glow curves play a significant role in providing some beneficial information for the decay process. In this case, the position of the TL peak is associated with the initial concentration of trapped carriers and the change in initial concentration necessarily changes Tm. The released carriers are retrapped before they recombine, giving rise to a delay in the luminescence emission and a spreading of the emission over a wider temperature range [42] (Table 3). The Geometric shape factor (μg) lies between (0.52-0.57) which displays the second order kinetics which clearly supports the probability of re-trapping released charge carriers before recombination process. The trap depth (i.e., activation energy) was calculated in the range between (1.27-1.69eV) and frequency factor also as (4.03×10⁷-6.8×10⁷ s-1). So, on this basis we can say that this phosphor exhibits very high persistency but it can be considered as the value of trap depth is widespread range from 0.50eV to 1.50eV. According to Sakai and Mashangva [43,44] research reports, they have reported that a very appropriate trap depth (0.65~0.75eV) is very necessary for phosphors to display long persistency phenomenon [45-49]. So, we suggest that this phosphor is well suitable for long lasting phosphor.
Figure 9:TL glow Curves of Synthesized Phosphor with Different UV Irradiation Time.

Table 3:Evaluated TL Kinetic Parameters of Synthesized Ca2MgSi2O7: Ce3+ Phosphor.

Conclusion
In brief, purple blue Ca2MgSi2O7: Ce3+ phosphor was well synthesized via high temperature solid-state reaction technique. The XRD patterns were well clarified and clearly matched through JCPDS PDF File #77-1149. The average crystallite size (D) was obtained ~70nm. XRD results also show that the synthesized phosphor is crystalline with a single phase. The PL emission spectra, purple-blue emission peak, observed at 392nm due to 5d-4f allowed transition from Ce3+ ions The CIE chromaticity co-ordinates located in the purple-blue color region; hence the synthesized phosphor might be very useful in blue component of WLED’s trichromatic phosphors and has potential applications in solid-state lighting (SSL) devices and WLEDs. It is very clear from TL spectra that second order kinetics which supports the probability of retrapping released charge carriers before recombination process and the trap depth (i.e., activation energy) of the synthesized sample was obtained in the range between (1.27-1.69eV). This phosphor is suitable for long lasting phosphor, novel TL material and high temperature dosimetry applications because it exhibits very high persistency.
Application
The favorable features for applications likewise near UV-LED conversion phosphor, white light emitting diodes (WLEDs), longpersistent afterglow properties, solid-state lighting (SSL) devices, biomedical research such as drug delivery, tissue engineering, bone material, detection of cancer disease, DNA transplantation, and Image processing of computer science etc.
Acknowledgement
Authors are very grateful to Dept. of Physics, Dr. Radha Bai, Govt. Navin Girls College, Raipur (C.G) for support in experimental research work and Furnace facility. We are also thankful to kind support NIT Raipur (C.G.) and Pt. Ravishankar Shukla University, Raipur (C.G.) India. The first author undertakes the work of writing the entire research Paper, data collection, paper design and resultsdiscussion. Similarly, the second author has properly checked the spelling mistake and grammatical error and helped in sample preparation.
Conflict of Interest
The authors declare that no conflict or any economic interest exists in our present research work.
Authors Contribution
This work was carried out in collaboration between both authors. Author Dr. Shashank Sharma undertakes the manuscript designed and conducted the entire experiments & characterization studies, collected and analyzed the research data, and prepared the entire manuscript draft as well as supervised the resultsdiscussion. Similarly, author Dr. Sanjay Kumar Dubey has properly checked the spelling mistake, punctuation, grammatical error, conceptualization, writing, review, editing and helped in sample preparation. Both authors read and approved the final manuscript.
References
- Ye S, Xiao F, Pan YX, Ma YY, QY Zhang (2010) Phosphors in phosphor-converted white light-emitting diodes: Recent advances in materials, techniques and properties. Mat Sci & Engi R: Reports 71(1): 1-34.
- Ogawa T, Nakauchi D, Okada G, Kawaguchi N, Yanagida T (2019) Scintillation properties of Ce-and Eu-doped Ca2MgSi2O7 Opt Mat 89: 63-69.
- Kamiya S, Mizuno H (1999) Phosphor Handbook; CRC Press: USA.
- Aitasalo T, Holsa J, Laamanen T, Lastusaari M, Lehto L, et al. (2005) Luminescence properties of Eu2+ doped dibarium magnesium disilicate, Ba2MgSi2O7: Eu2+. Ceramics-Silikáty 49(1): 58-62.
- Rao TGVM, Kumar AR, Veeraiah N, Reddy MR (2013) Optical and structural investigation of Sm3+–Nd3+ co-doped in magnesium lead borosilicate glasses. J Phy & Chem of Solids 74(3): 410-417.
- Shukla D, Ghormare KB, Dhoble SJ (2014) Wet chemical synthesis and photoluminescence characteristics of Ca5(PO4)3F: Dy phosphor. Adv Mat Lett 5(7): 406-408.
- Sharma S, Dubey SK, Diwakar AK (2021) Synthesization of Ba2MgSi2O7: Eu2+,Dy3+ phosphor by combustion route and their characteristics. Int J Mat Sci 2(2): 1-7.
- Sharma S, Dubey SK (2021) The significant properties of silicate based luminescent nanomaterials in various fields of applications: A review. Int J Sci Res in Phy & Applied Sci 9(4): 37-41.
- Wu H, Hu Y, Chen L, Wang X (2011) Enhancement on the afterglow properties of Sr2MgSi2O7: Eu2+ by Er3+ Mat Lett 65(17-18): 2676-2679.
- Wu C, Chang J, Zhai W, Ni S, Wang J (2006) Porous akermanite scaffolds for bone tissue engineering: Preparation, characterization, and in vitroJ Biomed Mat Res Part B: Applied Biomat 78(1): 47-55.
- Bhatkar VB, Bhatkar NB (2011) Combustion synthesis and photoluminescence study of silicate biomaterials. Bull Mat Sci 34: 1281-1284.
- Kim T, Kim Y, Kang S (2012) Luminescence properties of Eu2+ in M2MgSi2O7 (M=Ca, Sr, and Ba) phosphors. Appl Phys B 106: 1009-1013.
- Blasse G, Wanmaker WL, Tervugt JW (1968) Some new classes of efficient Eu2+ ‐activated phosphors. J Electrochem Soc 115: 673.
- Aitasalo T, Hreniak D, Holsa J, Laamanen T, Lastusaari M, et al. (2007) Persistent luminescence of Ba2MgSi2O7: Eu2+. J Lumin 122-123: 110-112.
- Yao S, Li Y, Xue L, Yan Y (2010) Luminescent properties of Ba2(Mg, Zn)Si2O7: Eu2+ particles as potential blue-green phosphors for ultraviolet light-emitting diodes. J Am Ceram Soc 93(11): 3793-3797.
- Zhang X, Zhang J, Wang R, Gong M (2010) Photo-physical behaviors of efficient green phosphor ba2mgsi2o7: eu2+ and its application in light-emitting diodes. J Am Ceram Soc 93(5): 1368.
- Wu H, Hu Y, Zeng B, Mou Z, Deng L (2011) Tunable luminescent properties by adjusting the Sr/Ba ratio in Sr97−xBaxMgSi2O7: Eu2+0.01, Dy3+0.02 phosphors. J Phys Chem Solids 72(11): 1284-1289.
- Tam TH, Du NV, Kien NDT, Thang CX, Cuong ND, et al. (2014) Co-precipitation synthesis and optical properties of green-emitting Ba2MgSi2O7: Eu2+ J Lumin 147: 358-362.
- Pan W, Ning G, Zhang X, Wang J, Lin Y, et al. (2008) Enhanced luminescent properties of long-persistent Sr2MgSi2O7: Eu2+, Dy3+ phosphor prepared by the co-precipitation method. J Lumin 128(12): 1975-1979.
- JCPDS International Center for Diffraction Data. 17-1149.
- American Mineralogist Crystal Structure Data-Base-Code AMCSD 0008032.
- Kauppinen J, Partanen J (2001) Fourier transforms in spectroscopy. John Wiley & Sons.
- Stuart BH (2007) Analytical techniques in materials conservation. John Wiley & Sons.
- Nakamoto K (2008) Infrared and raman spectra of inorganic and coordination compounds, part B: Applications in coordination, organometallic, and bioinorganic chemistry. (6th edn), John Wiley & Sons.
- Gou Z, Chang J, Zhai W (2005) Preparation and characterization of novel bioactive dicalcium silicate ceramics. J European Ceram Soc 25(9): 1507-1514.
- Hales MC, Frost RL (2007) Synthesis and vibrational spectroscopic characterisation of synthetic hydrozincite and smithsonite. Polyhedron 26(17): 4955-4962.
- Shannon RD (1976) Revised effective ionic radii and systematic studies of interatomic distances in halides and chalcogenides. Acta crystallogr A 32(5): 751-767.
- Brisdon A, Kazuo N (2010) Infrared and raman spectra of inorganic and coordination compounds, part b, applications in coordination, organometallic, and bioinorganic chemistry. (6th edn), Applied Organometallic Chemistry, p. 424.
- Caracas R, Gonze X (2003) Ab initio determination of the ground-state properties of Ca2MgSi2O7 å Physical Review B 68: 184102.
- Vicfeientini G, Zinner LB, Schpector JZ, Zinner K (2000) Luminescence and structure of europium compounds. Coordination Chemistry Reviews 196(1): 353-382.
- Dubey SK, Sharma S, Pandey S, Diwakar AK (2021) Structural characterization and optical properties of monoclinic Ba2MgSi2O7 (BMS) phosphor. Int J Res Publication and Reviews 2(11): 327-332.
- Sharma S, Dubey SK, Diwakar AK, Pandey S (2021) Novel white light emitting (Ca2MgSi2O7: Dy3+) Phosphor. JMSRR 8(4): 164-171.
- CIE (1931) International Commission on Illumination. Publication CIE no. 15 (E-1.3.1).
- Kang HR (2013) Computational color technology spie press monograph. SPIE Digital Library. Volume. PM1590.
- Vij DR (1998) Thermoluminescence. Luminescence of Solids, pp. 271-307.
- Vij DR (1998) Luminescence of Solids. Springer Science & Business Media.
- Srinivas M, Rao BA (2012) Luminescence studies of Eu3+ doped BaGd2O4 Indian J Sci Technol 5(7): 3022.
- Pagonis V, Kitis G, Furetta C (2006) Numerical and practical exercises in thermoluminescence. Springer Sci, New York.
- Ege AT, Ekdal E, Karali T, Can N (2007) Determination of thermoluminescence kinetic parameters of Li2B4O7: Cu, Ag, P. Rad Measure 42(8): 1280-1284.
- Jose MT, Anishia SR, Annalakshmi O, Ramasamy V, (2011) Determination of thermoluminescence kinetic parameters of thulium doped lithium calcium borate. Rad Measure 46(10): 1026-1032.
- Deshpande A, Dhoble NS, Gedam SC, Dhoble SJ (2016) Photo and thermoluminescence in K2Mg(SO4)2: Dy phosphor and evaluation of trapping parameters. J Lumin 180: 58-63.
- Chen R, Mckeever SWS (1997) Theory of thermoluminescence and related phenomena. World Scientific, Singapore.
- Sakai R, Katsumata T, Komuro S, Morikawa T (1999) Effect of composition on the phosphorescence from BaAl2O4: Eu2+, Dy3+ J Lumin 85(1-2): 149-154.
- Mashangva M, Singh MN, Singh TB (2011) Estimation of optimal trapping parameters relevant to persistent luminescence. Int J Pure & Applied Physics 49: 583-589.
- Chen R J (1969) Thermally stimulated current curves with non-constant recombination lifetime. Phys D: Appl Phys 2: 371.
- Xiao X, Yan B (2012) Solid state synthesis and photoluminescence of Sr3Y(PxV1−xO4)3: Eu3+ submicrocrystalline rod.Bull Mat Sci 35(4): 617-621.
- Wu H, Hu Y, Wang X (2011) Investigation of the trap state of Sr2MgSi2O7: Eu2+, Dy3+ phosphor and decay process. Radiat meas 46(5-6): 591.
- Pratibha BS, Chandrashekara MS, Nagabhushana N, Ramesh KP, Nagabhushana B, et al. (2014) Thermoluminescence Studies on Sr2SiO4 Nano Powder. Procedia Mater Sci 5: 944-952.
- Chen R, (1983) On the order of kinetics in the study of thermoluminescence. J Phys D: Appl Phys 16: L107.
© 2023 Shashank Sharma. This is an open access article distributed under the terms of the Creative Commons Attribution License , which permits unrestricted use, distribution, and build upon your work non-commercially.
Editor In Chief


.jpg)


Signup for Newsletter

Quick Links
 Editorial Board Registrations
 Submit your Article
 Refer a Friend
 Advertise With Us
Our Recent Edition

.jpg)


Top Editors


.jpg)


.bmp)
.jpg)
.png)
.jpg)


.jpg)


.png)

.png)


.png)


Financial Support

Sponsors

Latest e-Books

Latest Video

 a Creative Commons Attribution 4.0 International License. Based on a work at www.crimsonpublishers.com.
Best viewed in
a Creative Commons Attribution 4.0 International License. Based on a work at www.crimsonpublishers.com.
Best viewed in